 🏷️ Likely Rental
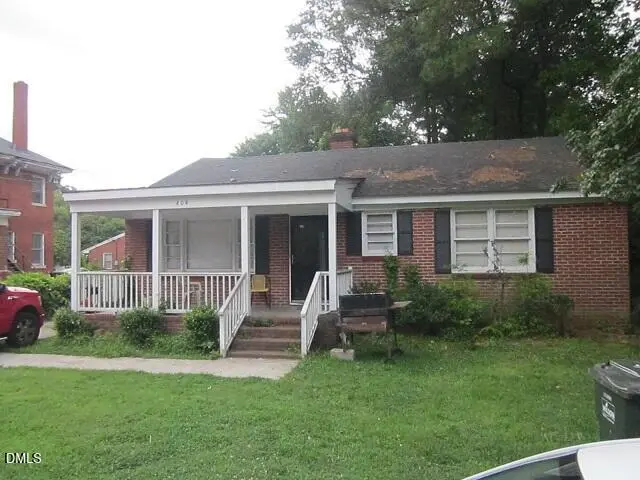
404 Rogers Ave N · Wilson, NC
Flood risk 1/10 · Minimal
- FEMA flood zone
- X (unshaded)
- Chance of flooding over 30 yrs
- 0.0%
- Est. flood insurance / yr
- $507 – $1,088
Fire risk 2/10 · Minimal
- Est. fire insurance / yr
- $906 – $1,684
Heat risk 7/10 · Major
- Hot days now (above 108°F)
- 7 days/yr
- Hot days in 30 yrs
- 15 days/yr
Wind risk 7/10 · Major
- Chance of severe wind over 30 yrs
- 75.0%
Air-quality risk 2/10 · Minimal
- Unhealthy air days now
- 2 days/yr
- Unhealthy air days in 30 yrs
- 2 days/yr
Risk factors via First Street. Map © Google.
Why this score? — see what drove the B- grade
The composite is a weighted blend of 9 inputs, each scored 0–100. Each bar is that input's sub-score; the figure is the points it added to the 100-point composite (weight × sub-score).
- Cash flow +25.6/30.0
- ARV discount +15.0/15.0
- DSCR +8.5/10.0
- 1% rule +6.7/10.0
- Rent growth +4.3/5.0
- Schools +3.3/10.0
- Livability +3.2/5.0
- Condition / age +2.5/5.0
- Appreciation +0.0/10.0
$120,000
🖨 Deal sheet (PDF) 📄 Offer letter ✓ Due diligence
Listing remarks MLS
3 Bedroom, 2 Bath Brick Ranch with long-term tenant. Currently rented for $700 per month. Tenant is month to month. Must give 24 hour notice for showings.
Key facts
- 6,970 sq ft lot
- Built 1958
- Listed 45 days
Property features AI
Finance
- Other: Lot size approximately 0.16 acres; Located in Wilson County; public maintained road access
- HOA & community: No homeowners association
Exterior
- Utilities: Public water; Public sewer
- Home design: Single-story house; Finished above-grade living area of 1,569
- Construction: Brick veneer and frame construction; Built with crawl space foundation
- Exterior features: Shingle roof
Interior
- Bedrooms: 3 bedrooms (all on the main level)
- Flooring: Wood
- Bathrooms: 2 full bathrooms
- Heating & cooling: Forced air heating; Central air conditioning
- Interior features: Wood flooring; Crawl space basement
Neighborhood map
What this means for you Summary
Snapshot
- This is a 3-bed/1.5-bath single-family listed at $120k.
Deal economics
- At list price, monthly cash flow is $284 ($3k/yr) — positive.
- The deal already cash-flows at list — no discount required.
- Meets the 1% rule at list price ($1k rent vs $120k).
- Recommended offer: $116k (3.0% below list) — sets the bar for market timing.
- Cap rate 9.1% vs local median 3.4% in Wilson — top-decile yield for the area; either an underpriced asset or a hidden risk that comps aren't pricing in. Stress-test before assuming the spread holds.
Location & tenants
- Location reads 64/100 on livability (#374 in NC) — a middle-class / working-renter tenant base. Strengths: cost of living A+, housing A+, health & safety A; Watch: crime F, amenities F, commute F.
- Wilson County Schools (rural): math 38% / reading 40% proficiency, ranked #119 of 178 in NC (top 67%) — families likely to look elsewhere, expect single-tenant / working-renter base with shorter leases.
- Zoned schools: Forest Hills Middle (math 32% / reading 38%, grade F, #286 of 475 statewide, top 61%, 670 students, 99% FRL) — zoned schools average 99% FRL vs 58% district-wide (41 pts higher); higher-poverty schools than district average — tighter screening recommended.
- Market conditions: Rents rising fast (+7.0%/yr); 261 active listings in the ZIP; lower-income renter base — watch delinquency; 580 units permitted in Wilson County in 2024 (168 in 5+ unit buildings).
- This rent runs 39% of the median local income ($43k/yr) — at the standard rent-burdened threshold; future hikes will face affordability resistance.
Forward outlook
- Local home prices are declining (-3.0%/yr); year-one equity from $830 of loan paydown is wiped out by about $4k of value loss. Plan a longer hold.
- Wilson County population projected to shrink 5% by 2050 — rents likely to lag national; underwrite the cash flow, not the appreciation.
- At projected returns (-3.0% appreciation + 7.0% rent growth), your $34k cash investment doubles in ~8 years — after that, you're playing with house money.
Negotiation context
- It's been on market 45 days — a 3% lower offer ($116k) is reasonable based on typical stale-listing flexibility.
- 2 sale attempts with the ask held roughly flat each time — persistent listings suggest the price (not the market) is what's stuck; bring a comps-based counter.
Risks & watch-outs
- Watch-outs: built in 1958 — expect roof / HVAC / electrical / plumbing capex.
- Climate carrying-cost: major wind risk, 75% chance of damaging wind over 30y; extreme-heat days projected 7→15/yr by 2055 (HVAC capex compounding) — expect insurance premiums to compound above CPI over the hold.
Questions for the listing agent
- It's been on market 45 days. Have you received any prior offers? Is the seller open to a 3% concession, seller financing, or rate buy-down credit?
- Built in 1958 — when were the roof, HVAC, electrical panel, plumbing, and water heater last replaced?
- Is there a deadline driving the sale (1031 exchange, divorce, estate, relocation)? That informs how much negotiation room exists.
- Schools are F-rated, which usually means shorter tenancies and higher turnover. Who's the typical renter profile here, and what's been the actual vacancy rate?
- Crime grade is F in this area — have there been break-ins, vandalism, or insurance claims at this property in the last 3 years? What carrier currently insures it and at what premium?
- What's the average days-on-market for RENTAL listings here right now (not sales)? A rising rental-DOM trend means longer vacancies and softer asking-rent achievability than the comps imply.
- What's the recent tenant-quality profile in this submarket — average credit score on applications, eviction rate, late-payment / NSF rate, and stable-employment percentage? A property-management company in the area should have these aggregated.
- How much new for-sale + rental construction is in the pipeline within 1–3 miles? Heavy new supply typically softens prices + rents 12–24 months out; constrained supply supports both.
Investment metrics
- 1% rule
- 1.17% ✓
- Cap rate
- 9.13%
- Cash-on-cash
- 10.15%
- DSCR
- 1.45
- GRM
- 7.1
CMA / ARV
- ARV (on-the-fly)
- $223,366
- Comps found
- 12
Show comp detail 12 sales within ~0.75 mi
| Address | Dist | Beds/Ba | Sqft | Sold | Price | $/sf | Match |
|---|---|---|---|---|---|---|---|
| 1209 Gold St N | 0.08mi | 3/1.0 | 1,540 (-2%) | 3mo | $138,500 | $90 | 88 |
| 1105 Anderson St NW | 0.30mi | 3/2.0 | 1,665 (+6%) | 3mo | $277,500 | $167 | 72 |
| 185 N Movado Trl | 0.18mi | 4/2.0 (+1) | 1,420 (-10%) | 5mo | $279,900 | $197 | 64 |
| 806 Vance St N | 0.31mi | 2/1.0 (-1) | 1,420 (-10%) | 2mo | $112,500 | $79 | 60 |
| 903 Lee St N | 0.23mi | 4/2.0 (+1) | 1,711 (+9%) | 9mo | $165,000 | $96 | 60 |
| 909 Lee St N | 0.21mi | 3/1.0 | 1,355 (-14%) | 7mo | $137,500 | $101 | 59 |
| 1606 Adams St N | 0.45mi | 3/2.0 | 1,728 (+10%) | 2mo | $245,000 | $142 | 59 |
| 1121 Vance St N | 0.15mi | 3/3.0 | 1,784 (+13%) | 8mo | $304,000 | $170 | 58 |
| 1607 Branch St NW | 0.65mi | 2/2.0 (-1) | 1,572 (-0%) | 11mo | $205,000 | $130 | 54 |
| 1003 Branch St NW | 0.39mi | 3/1.5 | 1,802 (+15%) | 5mo | $249,900 | $139 | 53 |
| 1603 Branch St NW | 0.63mi | 4/2.0 (+1) | 1,722 (+10%) | 7mo | $308,000 | $179 | 42 |
| 1705 Kenan St NW | 0.69mi | 4/2.0 (+1) | 1,745 (+11%) | 5mo | $265,000 | $152 | 38 |
Match score weights: distance 35% · size 25% · config 20% · recency 20%. Top-matched comps best support the ARV.
Projected returns pro-forma
-3.0% appreciation · 7.01% rent growth · sell at horizon
- IRR
- 3.4%
- Equity multiple
- 1.14×
- Total profit
- $4,551
- Equity at exit
- $17,892
- IRR
- 16.4%
- Equity multiple
- 2.59×
- Total profit
- $53,554
- Equity at exit
- $10,375
Cash invested: $33,600 (down + closing). Projections, not guarantees.
Landlord ↔ Tenant lean methodology
- Overall (STATE)
- 85 Strongly Landlord-Friendly
- State North Carolina
- 85 Strongly Landlord-Friendly · R+3
- County
- — inherits STATE
- City
- — inherits STATE
ZIP-level market 27893
- Rents YoY
- 7.0%
- Active inventory
- 261
- Price-to-rent
- 7.1×
Monthly cashflow live
- Estimated rent
- $1,401 medium interval (Pro) →
- Mortgage (P&I)
- −$629
- Tax from tax record
- −$144 /mo · $1,724/yr
- Insurance
- −$50
- HOA
- −$0
- Vacancy / Maint / Mgmt
- −$294
- Net cashflow
- $284
Break-even live
Sensitivity live
| Price | -10% $352 | -5% $318 | +0% $284 | +5% $250 | +10% $216 |
|---|---|---|---|---|---|
| Rent | -10% $173 | -5% $229 | +0% $284 | +5% $339 | +10% $395 |
| Rate | -1.0pp $345 | -0.5pp $315 | base $284 | +0.5pp $253 | +1.0pp $221 |
UW: 25.0% down · 7.5% · 30yr · 1.5% tax · 5.0% vac · 8.0% maint · 8.0% mgmt
Financing live
Cash to close
- Down payment
- $30,000
- Closing costs
- $3,600
- Reserves months
- —
- Total cash needed
- —
Loan-product check · same deal, 3 products live
Conventional
25% down · 7.5% · 30yr
- Down + closing
- —
- Monthly P&I
- —
- Monthly cashflow
- —
- DSCR
- —
- Eligible?
- —
Personal DTI + credit; lowest rate.
DSCR
20% down · 8.5% · 30yr
- Down + closing
- —
- Monthly P&I
- —
- Monthly cashflow
- —
- DSCR
- —
- Eligible?
- —
No personal income docs; deal must DSCR.
Hard money
10% down · 12.0% · 12mo
- Down + closing
- —
- Monthly P&I
- —
- Monthly cashflow
- —
- DSCR
- —
- Eligible?
- —
Short-term bridge; refi at stabilization.
Listing history 12 events
-
2026-06-09status $120,000 Pending 45 DOM
-
2026-06-08days on market $120,000 Active 45 DOM
-
2026-06-07days on market $120,000 Active 44 DOM
-
2026-06-05days on market $120,000 Active 41 DOM
-
2026-06-03days on market $120,000 Active 40 DOM
-
2026-06-02days on market $120,000 Active 39 DOM
-
2026-06-01days on market $120,000 Active 38 DOM
-
2026-05-31days on market $120,000 Active 37 DOM
-
2026-05-30days on market $120,000 Active 36 DOM
-
2026-04-24$120,000 Active 154-char remark
Show marketing remark (154 chars)
3 Bedroom, 2 Bath Brick Ranch with long-term tenant. Currently rented for $700 per month. Tenant is month to month. Must give 24 hour notice for showings.
-
2026-04-24$120,000 Active
Show marketing remark (154 chars)
3 Bedroom, 2 Bath Brick Ranch with long-term tenant. Currently rented for $700 per month. Tenant is month to month. Must give 24 hour notice for showings.
-
2014-04-08soldstatus $1,025,000
ⓘ Source: listings_history table (triggers on properties + properties_extension) + one-shot
backfill from property_details.listing_events for pre-trigger history.
Tax reassessment forecast NC · Resets to sale price
- Current annual tax
- $1,724 · $144/mo
- Projected year-2 tax
- $1,724 · $144/mo
- Expected delta
- $0/yr ($0/mo · 0.0%)
ⓘ Screening estimate from a state-policy table — verify with the county assessor before closing.
Climate risk First Street
- Flood 1/10 Low FEMA zone X (unshaded) · 0% chance over 30 yrs
- Wildfire 2/10 Low
- Heat 7/10 Severe 7 d/yr ≥108°F today · 15 d/yr by 30 yrs out
- Wind 7/10 Severe 75% chance of damaging wind over 30 yrs
- Air quality 2/10 Low 2 unhealthy d/yr today · 2 by 30 yrs out
Nearby sold comps map
Loading sold comps map…
Walkable amenities ~0.75 mi
Loading nearby amenities…
Taxation est. · year 1
- Rental income
- $16,816
- − Mortgage interest
- −$6,722
- − Property taxes
- −$1,724
- − Insurance
- −$600
- − Repairs & maintenance
- −$1,345
- − Management
- −$1,345
- − Depreciation
- −$3,491
- Taxable income
- $1,589
- Est. tax owed @ 24.0%
- −$381
- After-tax cash flow
- $3,028/yr
For passive investors: Depreciation is non-cash, so a rental often shows a tax loss while cash-flowing — sheltering income. Rental losses are passive: they offset passive income freely, and up to $25,000/yr can offset ordinary (W-2) income if you actively participate and your MAGI is under $100k (phasing out to $0 by $150k); unused losses carry forward. On sale, claimed depreciation is recaptured at up to 25%, and gains may owe capital-gains tax (a 1031 exchange can defer both). Figures are a year-1 estimate at your 24.0% rate — not tax advice; consult a CPA.
Schools (NCES district)
- District
- Wilson County Schools
- NCES district ID
- 3705020
- Math proficiency
- 38% ▲ 2.00%
- Reading proficiency
- 40% ▼ -1.00%
- Median HH income
- $39,342
- Composite
- 32.64/100
- National rank
- #5665
- State rank
- #119 of 178 in NC
Livability — Wilson
- Score
- 64/100
- State rank
- #374
- US rank
- #14674
Category grades
Schools grade is shown separately in the Schools card above.
Census & demographics
- Census place
- Wilson, NC
- County
- Wilson County · 57,967 people
- City population
- 57,967
- Metro
- Wilson, NC
- Population (ZIP)
- 38,512
- Household income
- $42,810
- Rent vs Own
- Severe rent burden
- 2175.0
Population outlook (Wilson County) Hauer SSP2
- Today (2025)
- 82,765 people
- By 2030
- 82,492 · -0.3%
- By 2040
- 81,054 · -2.1%
- By 2050
- 78,610 · -5.0%
- By 2075
- 71,865 · -13.2%
- By 2100
- 62,792 · -24.1%
Race, ethnicity, and origin ACS 2023
- Neighborhood character
- Diverse neighborhood (Simpson 0.61)
- Race & ethnicity
- Black 55% White 27% Hispanic / Latino 16% Two or more races 5%
- Hispanic origin (detail)
- Mexican 13%
- Common ancestry
- Serbian 1% Slovak 1% Lithuanian 1%
- Foreign-born
- 6% · Canada, Jamaica
- Languages at home
- 86% English-only · Spanish 13%
Political lean MEDSL · Wilson
- 2024 margin
- Toss-up / Even · D 49.8% · R 49.4%
- 2008→2024 swing
- -5.7pp toward R · 2008: 6.1pp · 2024: 0.4pp
- All cycles
- 2024: D+0.4 2020: D+2.9 2016: D+5.6 2012: D+7.3 2008: D+6.1
Not yet ingested
- Civics
- —
Market trends
- HPI YoY
- ▼ -149.54%
- Current HPI
- 211.4136
- Rent YoY
- ▲ 7.01%
- Metro
- Wilson, NC
- State GDP YoY
- ▲ 3.28%
- F500 in state
- 26
Industry mix (Fortune 500 HQ in NC)
| Industry | F500 HQs | Revenue |
|---|---|---|
| Financial Services | 2 | $213B |
|
||
| Retail | 2 | $95B |
|
||
| Industrial Conglomerate | 1 | $38B |
|
||
| Metals / Steel | 1 | $35B |
|
||
| Utilities | 1 | $30B |
|
||
| Industrial Machinery | 1 | $19B |
|
||
Price history
-88.3% since first listed3 events — show timeline
- 2026-04-24 Listed $120,000 TMLS
- 2026-04-24 Listed $120,000 Hive MLS
- 2014-04-08 Sold (Public Records) $1,025,000 Public Records
Property tax history
+2.3%/yrLatest (2025): $1,724 · +0.0% YoY. Source: county tax records.
Cash-flow waterfall
monthlySold comps — $/sqft
last 12 mo · ≤1 miLoading sold comps…