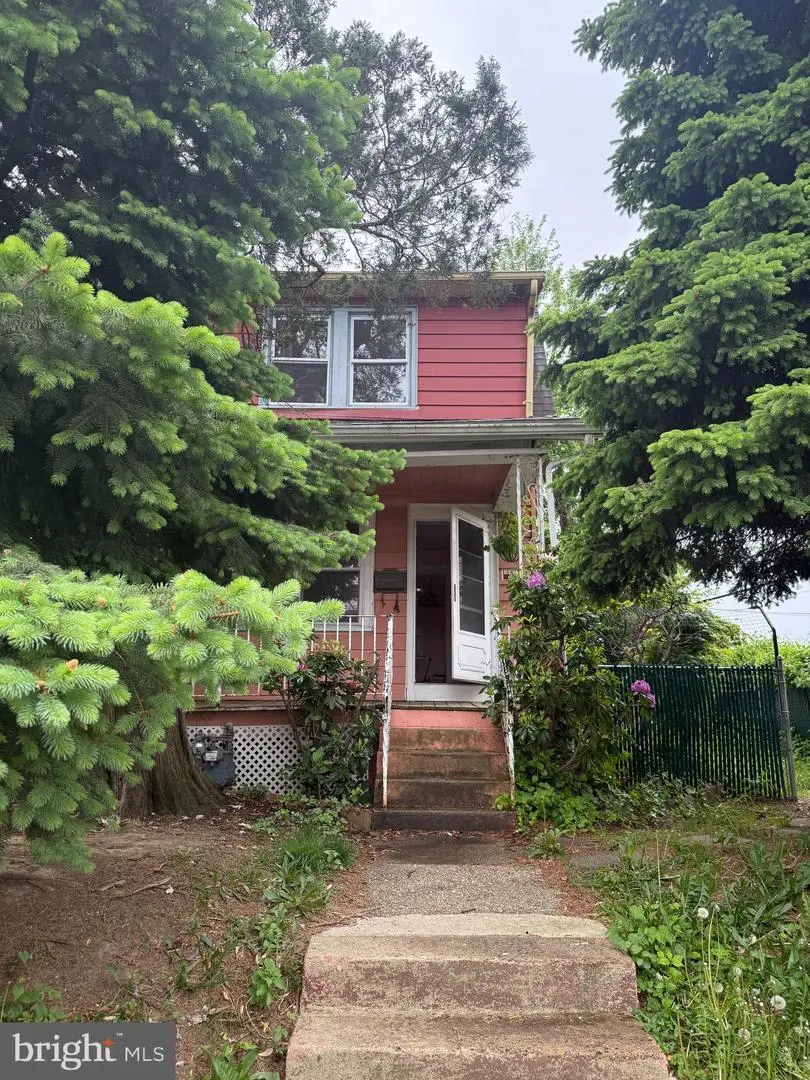
426 Custer Ave · Glenolden, PA
Flood risk 1/10 · Minimal
- FEMA flood zone
- X (unshaded)
- Chance of flooding over 30 yrs
- 0.0%
- Est. flood insurance / yr
- $473 – $860
Fire risk 1/10 · Minimal
- Est. fire insurance / yr
- $511 – $949
Heat risk 6/10 · Moderate
- Hot days now (above 103°F)
- 7 days/yr
- Hot days in 30 yrs
- 15 days/yr
Wind risk 6/10 · Moderate
- Chance of severe wind over 30 yrs
- 27.0%
Air-quality risk 4/10 · Minor
- Unhealthy air days now
- 3 days/yr
- Unhealthy air days in 30 yrs
- 6 days/yr
Risk factors via First Street. Map © Google.
Why this score? — see what drove the C grade
The composite is a weighted blend of 9 inputs, each scored 0–100. Each bar is that input's sub-score; the figure is the points it added to the 100-point composite (weight × sub-score).
- Cash flow +17.3/30.0
- ARV discount +15.0/15.0
- 1% rule +7.7/10.0
- DSCR +5.4/10.0
- Livability +4.2/5.0
- Schools +3.3/10.0
- Rent growth +2.5/5.0
- Condition / age +2.5/5.0
- Appreciation +0.0/10.0
$150,000
🖨 Deal sheet 📄 Offer letter ✓ Due diligence
Listing remarks
Investment opportunity. This lovely twin needs a some updating and repairs, but has excellent potential. Once completed this home will be a great investment. It's a corner lot, lots of square footage with a private parking space. The rooms are large and there's so much potential. Being sold as is, seller cannot make any repairs but inspections are welcome. The buyer would be responsible for the U & O and offer would reflect that. PLEASE DO NOT PUT AN OFFER WITHOUT READING AGENT PRIVATE REMARKS.
Key facts
- Corner lot
- Parking
- Built 1930
Tags
Property features AI
Exterior
- Parking: On-street parking; Driveway with space for one vehicle; One total garage/parking space
- Utilities: Public water; Public sewer; Electric service
- Home design: Semi-detached; Major rehab needed
- Construction: Vinyl and aluminum siding; Asphalt roof; Other foundation; Above- and below-grade structures
- Exterior features: Not in a federal flood zone; Lot approximately 35 x 100
Interior
- Bedrooms: Three bedrooms on the upper level
- Flooring: Wood
- Bathrooms: One full bathroom
- Heating & cooling: Hot water heating; Natural gas fuel; Electric hot water
- Interior features: Wood flooring; Basement present (other type)
Neighborhood map
What this means for you Summary
Snapshot
- This is a 3-bed/1.0-bath townhouse listed at $150k.
Deal economics
- At list price, monthly cash flow is $110 ($1k/yr) — positive.
- The deal already cash-flows at list — no discount required.
- Meets the 1% rule at list price ($2k rent vs $150k).
- Cap rate 7.2% vs local median 3.8% in Glenolden — top-decile yield for the area; either an underpriced asset or a hidden risk that comps aren't pricing in. Stress-test before assuming the spread holds.
Location & tenants
- Location reads 85/100 on livability (#69 in PA, #481 nationally) — a professional / high-income tenant draw. Strengths: commute A+, cost of living A+, housing A+; Watch: amenities D.
- Interboro SD (suburban): math 25% / reading 50% proficiency, ranked #369 of 539 in PA (top 68%) — families likely to look elsewhere, expect single-tenant / working-renter base with shorter leases.
- Zoned schools: Kindergarten Academy (239 students, 61% FRL); Interboro Shs (math 82% / reading 24%, grade C-, #104 of 437 statewide, top 24%, 1,028 students, 55% FRL) — zoned schools average 58% FRL vs 38% district-wide (20 pts higher); higher-poverty schools than district average — tighter screening recommended.
- Zoned-school proficiency averages 53% at this address vs 38% district-wide (+16 pts) — the actual schools serving this property are materially stronger than the Interboro SD average implies; a family-tenant draw the district grade alone would hide.
- Market conditions: 46 active listings in the ZIP; 38 comparable units currently listed for rent nearby; rentals at typical pace (median 24d on market — plan ~3-4 weeks tenant-placement turnaround); solid renter incomes; 299 units permitted in Delaware County in 2024 (5 in 5+ unit buildings).
Forward outlook
- Local home prices are declining (-3.0%/yr); year-one equity from $1k of loan paydown is wiped out by about $4k of value loss. Plan a longer hold.
Negotiation context
- Only 10 days on market — expect competitive offers; lowballing is unlikely to land.
Risks & watch-outs
- Watch-outs: property tax is 4.4% of price; built in 1930 — expect roof / HVAC / electrical / plumbing capex.
- Climate carrying-cost: major wind risk, 27% chance of damaging wind over 30y; extreme-heat days projected 7→15/yr by 2055 (HVAC capex compounding) — expect insurance premiums to compound above CPI over the hold.
Questions for the listing agent
- Built in 1930 — when were the roof, HVAC, electrical panel, plumbing, and water heater last replaced?
- Property tax is high relative to price — has the assessment been appealed recently, and will the sale trigger a re-assessment?
- Is there a deadline driving the sale (1031 exchange, divorce, estate, relocation)? That informs how much negotiation room exists.
- Schools are B-rated — typically a magnet for longer-tenancy family renters. What's the average tenant stay here, and is there a school-zone premium baked into asking?
- What's the average days-on-market for RENTAL listings here right now (not sales)? A rising rental-DOM trend means longer vacancies and softer asking-rent achievability than the comps imply.
- What's the recent tenant-quality profile in this submarket — average credit score on applications, eviction rate, late-payment / NSF rate, and stable-employment percentage? A property-management company in the area should have these aggregated.
- How much new for-sale + rental construction is in the pipeline within 1–3 miles? Heavy new supply typically softens prices + rents 12–24 months out; constrained supply supports both.
Investment metrics
- 1% rule
- 1.27% ✓
- Cap rate
- 7.17%
- Cash-on-cash
- 3.14%
- DSCR
- 1.14
- GRM
- 6.6
CMA / ARV
- ARV (median comp)
- $259,369
- List price
- $150,000
- Delta
- -42.17%
- Verdict
- UNDERPRICED
- Comps
- 20 within 1.0 mi
Show comp detail 12 sales within ~0.75 mi
| Address | Dist | Beds/Ba | Sqft | Sold | Price | $/sf | Match |
|---|---|---|---|---|---|---|---|
| 419 Custer Ave | 0.03mi | 3/2.0 | 1,178 (0%) | 2mo | $219,900 | $187 | 93 |
| 5 S Wells Ave | 0.10mi | 3/1.5 | 1,210 (+3%) | 2mo | $245,000 | $202 | 88 |
| 221 Park Dr | 0.36mi | 3/1.5 | 1,152 (-2%) | 2mo | $226,500 | $197 | 76 |
| 816 Crescent Dr | 0.39mi | 3/1.5 | 1,152 (-2%) | 1mo | $245,000 | $213 | 75 |
| 437 Park Dr | 0.53mi | 3/2.0 | 1,152 (-2%) | 1mo | $262,000 | $227 | 67 |
| 751 Rively Ave | 0.63mi | 3/1.0 | 1,152 (-2%) | 1mo | $234,300 | $203 | 66 |
| 614 Rively Ave | 0.68mi | 3/1.0 | 1,152 (-2%) | 1mo | $255,000 | $221 | 64 |
| 1075 Brookwood Ln | 0.68mi | 3/1.5 | 1,152 (-2%) | 0mo | $238,000 | $207 | 62 |
| 1032 Brookwood Ln | 0.69mi | 3/1.5 | 1,152 (-2%) | 2mo | $214,000 | $186 | 61 |
| 1117 Tremont Dr | 0.70mi | 3/1.5 | 1,152 (-2%) | 1mo | $150,000 | $130 | 60 |
| 317 N Llanwellyn Ave | 0.41mi | 3/1.5 | 1,322 (+12%) | 3mo | $206,500 | $156 | 56 |
| 102 Rambler Rd | 0.59mi | 3/1.0 | 1,316 (+12%) | 1mo | $299,000 | $227 | 53 |
Match score weights: distance 35% · size 25% · config 20% · recency 20%. Top-matched comps best support the ARV.
Projected returns pro-forma
-3.0% appreciation · 3.0% rent growth · sell at horizon
- IRR
- -11.2%
- Equity multiple
- 0.59×
- Total profit
- $-17,054
- Equity at exit
- $22,365
- IRR
- -1.7%
- Equity multiple
- 0.89×
- Total profit
- $-4,820
- Equity at exit
- $12,969
Cash invested: $42,000 (down + closing). Projections, not guarantees.
Landlord ↔ Tenant lean methodology
- Overall (STATE)
- 62 Landlord-Friendly
- State Pennsylvania
- 62 Landlord-Friendly · EVEN
- County
- — inherits STATE
- City
- — inherits STATE
ZIP-level market 19036
- Active inventory
- 46
- Price-to-rent
- 6.6×
Monthly cashflow live
- Estimated rent
- $1,906 high interval (Pro) →
- Mortgage (P&I)
- −$787
- Tax from tax record
- −$546 /mo · $6,557/yr
- Insurance
- −$62
- HOA
- −$0
- Vacancy / Maint / Mgmt
- −$400
- Net cashflow
- $110
Break-even live
UW: 25.0% down · 7.5% · 30yr · 1.5% tax · 5.0% vac · 8.0% maint · 8.0% mgmt
Financing live
Cash to close
- Down payment
- $37,500
- Closing costs
- $4,500
- Reserves months
- —
- Total cash needed
- —
Loan-product check · same deal, 3 products live
Conventional
25% down · 7.5% · 30yr
- Down + closing
- —
- Monthly P&I
- —
- Monthly cashflow
- —
- DSCR
- —
- Eligible?
- —
Personal DTI + credit; lowest rate.
DSCR
20% down · 8.5% · 30yr
- Down + closing
- —
- Monthly P&I
- —
- Monthly cashflow
- —
- DSCR
- —
- Eligible?
- —
No personal income docs; deal must DSCR.
Hard money
10% down · 12.0% · 12mo
- Down + closing
- —
- Monthly P&I
- —
- Monthly cashflow
- —
- DSCR
- —
- Eligible?
- —
Short-term bridge; refi at stabilization.
Rent comps 38 comps
| Address | Beds | Baths | Sqft | Rent | $/sqft | DOM | Units | Dist |
|---|---|---|---|---|---|---|---|---|
| 1074 N Academy Ave Glenolden, PA | 3.0 | 1.0 | 1152 | $1,850 | $1.61 | 5d | 1 | 0.17mi |
| 29 Logan Ave Unit 11 Glenolden, PA | 2.0 | 1.0 | 850 | $1,350 | $1.59 | 24d | 1 | 0.45mi |
| 201 Westbridge Rd Glenolden, PA | 3.0 | 1.5 | 1224 | $2,350 | $1.92 | 24d | 1 | 0.48mi |
| 350 S Scott Ave Unit 1 Glenolden, PA | 2.0 | 1.0 | 715 | $1,700 | $2.38 | 24d | 1 | 0.56mi |
| 925 Maple Ave Glenolden, PA | 3.0 | 2.0 | 1152 | $2,800 | $2.43 | 21d | 1 | 0.58mi |
| 902 Maple Ave Glenolden, PA | 3.0 | 1.0 | 1152 | $1,745 | $1.51 | 43d | 1 | 0.62mi |
| 1201 Bartram Ave Darby, PA | 2.0 | 1.0 | 700 | $1,350 | $1.93 | 10d | 1 | 0.63mi |
| 132 Folcroft Ave Folcroft, PA | 2.0 | 1.0 | 725 | $1,679 | $2.32 | 2d | 3 | 0.65mi |
| 66 Folcroft Ave Folcroft, PA | 3.0 | 1.0 | 1224 | $1,895 | $1.55 | 3d | 1 | 0.66mi |
| 145 Isabel Ave Unit 145B Glenolden, PA | 2.0 | 1.0 | 890 | $1,525 | $1.71 | 43d | 1 | 0.67mi |
| 432 S Chester Pike Glenolden, PA | 2.0 | 1.0 | 792 | $1,325 | $1.67 | 44d | 1 | 0.68mi |
| 100 E Glenolden Ave Glenolden, PA | 1.0–4.0 | 1.0–2.0 | 920 | $2,167 | $2.36 | 1d | 4 | 0.71mi |
| 640 South Ave Secane, PA | 1.0–2.0 | 1.0–1.5 | 742 | $1,600 | $2.16 | 12d | 5 | 0.73mi |
| 306 Pine St Glenolden, PA | 3.0 | 2.0 | 1120 | $2,400 | $2.14 | 3d | 1 | 0.75mi |
| 304 Pine St Glenolden, PA | 3.0 | 2.0 | 1120 | $2,400 | $2.14 | 43d | 1 | 0.75mi |
| 100 S Oak Ave Glenolden, PA | 1.0–2.0 | 1.0–2.0 | 830 | $1,500 | $1.81 | 23d | 3 | 0.77mi |
| 926 Green Ln Secane, PA | 2.0 | 1.0 | 862 | $2,185 | $2.53 | 43d | 1 | 0.77mi |
| 1512 Elmwood Ave Folcroft, PA | 2.0 | 1.0 | 850 | $1,499 | $1.76 | 24d | 1 | 0.87mi |
| 1513 Elmwood Ave Unit 5 Folcroft, PA | 3.0 | 1.0 | 850 | $1,799 | $2.12 | 43d | 1 | 0.90mi |
| 1513 Elmwood Ave Unit 4 Folcroft, PA | 3.0 | 1.0 | 1025 | $1,699 | $1.66 | 24d | 1 | 0.90mi |
| 1511 Elmwood Ave Folcroft, PA | 1.0–3.0 | 1.0 | 725 | $1,649 | $2.27 | 23d | 3 | 0.90mi |
| 1505 Elmwood Ave Unit 5 Folcroft, PA | 2.0 | 1.0 | 850 | $1,499 | $1.76 | 24d | 1 | 0.91mi |
| 1503 Elmwood Ave Folcroft, PA | 3.0 | 1.0 | 1025 | $1,699 | $1.66 | 24d | 1 | 0.91mi |
| 1503 Elmwood Ave Folcroft, PA | 3.0 | 1.0 | 850 | $1,799 | $2.12 | 43d | 1 | 0.91mi |
| 943 South Ave Clifton Heights, PA | 1.0–2.0 | 1.0 | 662 | $2,000 | $3.02 | 2d | 10 | 0.95mi |
| 112 Juliana Ter Darby, PA | 3.0 | 1.0 | 1020 | $2,450 | $2.40 | 24d | 1 | 1.07mi |
| 112 Juliana Ter Darby, PA | 3.0 | 1.0 | 1020 | $2,350 | $2.30 | 44d | 1 | 1.07mi |
| 118 Felton Ave Darby, PA | 3.0 | 1.0 | 1152 | $1,750 | $1.52 | 21d | 1 | 1.10mi |
| 804 Grant Rd Folcroft, PA | 3.0 | 1.0 | 1088 | $2,050 | $1.88 | 43d | 1 | 1.19mi |
| 820 Greenhill Rd Sharon Hill, PA | 4.0 | 2.0 | 1184 | $2,600 | $2.20 | 5d | 1 | 1.20mi |
| 777 Bennington Rd Folcroft, PA | 4.0 | 1.5 | 1488 | $2,800 | $1.88 | 43d | 1 | 1.25mi |
| 304 Christopher Pl Unit 1st Floor Primos, PA | 2.0 | 1.0 | 875 | $1,400 | $1.60 | 3d | 1 | 1.28mi |
| 2001 Carter Rd Folcroft, PA | 3.0 | 1.0 | 1224 | $2,150 | $1.76 | 43d | 1 | 1.36mi |
| 1637 Lincoln Ave Prospect Park, PA | 1.0–2.0 | 1.0 | 675 | $1,599 | $2.37 | 4d | 7 | 1.38mi |
| 216 Borough Rd Unit A Primos, PA | 2.0 | 2.0 | 800 | $1,500 | $1.88 | 24d | 1 | 1.41mi |
| 319 S Church St Clifton Heights, PA | 3.0 | 1.0 | 1152 | $1,900 | $1.65 | 43d | 1 | 1.42mi |
| 1320 Lincoln Ave Prospect Park, PA | 2.0 | 1.0 | 770 | $1,645 | $2.14 | 5d | 3 | 1.46mi |
| 151 S Bishop Ave Clifton Heights, PA | 1.0–2.0 | 1.0–2.0 | 875 | $1,989 | $2.27 | 1d | 3 | 1.47mi |
Listing history 1 events
-
2026-05-10$150,000 Active 503-char remark
ⓘ Source: listings_history table (triggers on properties + properties_extension) + one-shot
backfill from property_details.listing_events for pre-trigger history.
Tax reassessment forecast PA · Partial reset (capped growth)
- Current annual tax
- $6,557 · $546/mo
- Projected year-2 tax
- $6,557 · $546/mo
- Expected delta
- $0/yr ($0/mo · 0.0%)
ⓘ Screening estimate from a state-policy table — verify with the county assessor before closing.
Climate risk First Street
- Flood 1/10 Low FEMA zone X (unshaded) · 0% chance over 30 yrs
- Wildfire 1/10 Low
- Heat 6/10 Major 7 d/yr ≥103°F today · 15 d/yr by 30 yrs out
- Wind 6/10 Major 27% chance of damaging wind over 30 yrs
- Air quality 4/10 Moderate 3 unhealthy d/yr today · 6 by 30 yrs out
Nearby sold comps map
Loading sold comps map…
Walkable amenities ~0.75 mi
Loading nearby amenities…
Taxation est. · year 1
- Rental income
- $22,868
- − Mortgage interest
- −$8,402
- − Property taxes
- −$6,557
- − Insurance
- −$750
- − Repairs & maintenance
- −$1,829
- − Management
- −$1,829
- − Depreciation
- −$4,364
- Taxable loss
- −$864
- Est. tax savings @ 24.0%
- +$207
- After-tax cash flow
- $1,527/yr
For passive investors: Depreciation is non-cash, so a rental often shows a tax loss while cash-flowing — sheltering income. Rental losses are passive: they offset passive income freely, and up to $25,000/yr can offset ordinary (W-2) income if you actively participate and your MAGI is under $100k (phasing out to $0 by $150k); unused losses carry forward. On sale, claimed depreciation is recaptured at up to 25%, and gains may owe capital-gains tax (a 1031 exchange can defer both). Figures are a year-1 estimate at your 24.0% rate — not tax advice; consult a CPA.
Schools (NCES district)
- District
- Interboro SD
- NCES district ID
- 4212170
- Math proficiency
- 25% ▼ -17.00%
- Reading proficiency
- 50% ▼ -16.00%
- Median HH income
- $56,802
- Composite
- 32.97/100
- National rank
- #5587
- State rank
- #369 of 539 in PA
Livability — Glenolden
- Score
- 85/100
- State rank
- #69
- US rank
- #481
Category grades
Schools grade is shown separately in the Schools card above.
Census & demographics
- Census place
- Glenolden, PA
- County
- Delaware County · 399,863 people
- City population
- 13,668
- Metro
- Philadelphia-Camden-Wilmington, PA-NJ-DE-MD
- Population (ZIP)
- 13,668
- Household income
- $79,144
- Rent vs Own
- Severe rent burden
- 383.0
Population outlook (Delaware County) Hauer SSP2
- Today (2025)
- 577,490 people
- By 2030
- 581,243 · +0.6%
- By 2040
- 584,700 · +1.2%
- By 2050
- 586,581 · +1.6%
- By 2075
- 598,706 · +3.7%
- By 2100
- 590,823 · +2.3%
Race, ethnicity, and origin ACS 2023
- Neighborhood character
- Predominantly White (71%)
- Race & ethnicity
- White 71% Black 18% Two or more races 6% Hispanic / Latino 4% Asian 1%
- Common ancestry
- Romanian 5% Lithuanian 2% Hispanic 1%
- Foreign-born
- 5% · Canada, China
- Languages at home
- 92% English-only · Other Indo-European 1% French/Haitian/Cajun 1% Spanish 1%
Political lean MEDSL · Delaware
- 2024 margin
- Strong D (+23.7) · D 61.4% · R 37.6% · Other 1.0%
- 2008→2024 swing
- +2.3pp toward D · 2008: 21.4pp · 2024: 23.7pp
- All cycles
- 2024: D+23.7 2020: D+26.7 2016: D+22.0 2012: D+21.8 2008: D+21.4
Not yet ingested
- Civics
- —
Market trends
- HPI YoY
- ▼ -218.04%
- Current HPI
- 267.7452
- Rent YoY
- —
- Metro
- Philadelphia-Camden-Wilmington, PA-NJ-DE-MD
- State GDP YoY
- ▲ 1.68%
- F500 in state
- 34
Industry mix (Fortune 500 HQ in PA)
| Industry | F500 HQs | Revenue |
|---|---|---|
| Healthcare | 2 | $309B |
|
||
| Insurance | 2 | $27B |
|
||
| Telecommunications / Media | 1 | $124B |
|
||
| Industrial Distribution | 1 | $22B |
|
||
| Financial Services | 1 | $20B |
|
||
| Chemicals / Materials | 1 | $18B |
|
||
Price history
2 events — show timeline
- 2026-05-19 Pending — BRIGHT MLS
- 2026-05-10 Listed $150,000 BRIGHT MLS
Property tax history
+4.4%/yrLatest (2026): $6,557 · +39.3% YoY. Source: county tax records.
Cash-flow waterfall
monthlySold comps — $/sqft
last 12 mo · ≤1 miLoading sold comps…