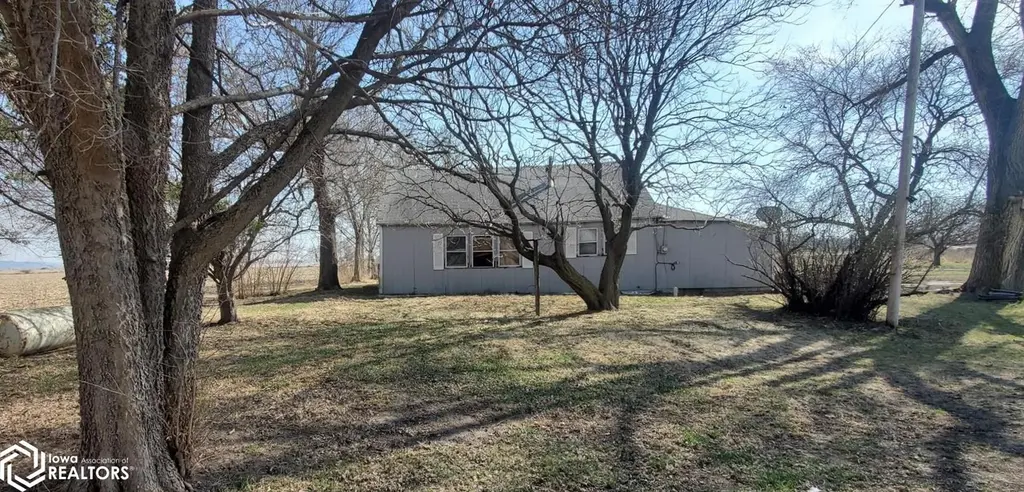
1326 141st St #1324 · River Sioux, IA
Flood risk 1/10 · Minimal
- FEMA flood zone
- D
- Chance of flooding over 30 yrs
- 0.0%
- Est. flood insurance / yr
- $400 – $4,352
Fire risk 2/10 · Minimal
- Est. fire insurance / yr
- $902 – $1,676
Heat risk 3/10 · Minor
- Hot days now (above 105°F)
- 7 days/yr
- Hot days in 30 yrs
- 15 days/yr
Wind risk 2/10 · Minimal
- Chance of severe wind over 30 yrs
- —
Air-quality risk 1/10 · Minimal
- Unhealthy air days now
- 0 days/yr
- Unhealthy air days in 30 yrs
- 0 days/yr
Risk factors via First Street. Map © Google.
Why this score? — see what drove the B+ grade
The composite is a weighted blend of 9 inputs, each scored 0–100. Each bar is that input's sub-score; the figure is the points it added to the 100-point composite (weight × sub-score).
- Cash flow +30.0/30.0
- 1% rule +10.0/10.0
- DSCR +10.0/10.0
- ARV discount +7.5/15.0
- Appreciation +7.0/10.0
- Schools +5.3/10.0
- Livability +2.9/5.0
- Rent growth +2.5/5.0
- Condition / age +2.5/5.0
$42,500
🖨 Deal sheet (PDF) 📄 Offer letter ✓ Due diligence
Listing remarks
This property is an excellent opportunity for fix & flip, rental, or make it your own. The property needs considerable cleanup of the land as well as the house, and the house needs some repairs and updates, but the peace and quiet of the location will make it all worthwhile. Over 4.3 acres, just off of I-29, minutes from Omaha and Sioux City, this property has a lot to offer, including tons of instant equity!
Key facts
- Minutes from omaha
- Over 4.3 acres
- Just off of i-29
Tags
Neighborhood map
What this means for you Summary
Snapshot
- This is a 3-bed/1.0-bath single-family listed at $42k.
Deal economics
- At list price, monthly cash flow is $487 ($6k/yr) — positive.
- The deal already cash-flows at list — no discount required.
- Meets the 1% rule at list price ($1k rent vs $42k).
- Recommended offer: $42k (1.5% below list) — sets the bar for market timing.
Location & tenants
- Location reads 58/100 on livability (#884 in IA) — a working-class tenant base; expect higher turnover. Strengths: cost of living A+, housing A+; Watch: crime C-, amenities F, commute F.
- West Harrison Community School District (rural): math 55% / reading 65% proficiency, ranked #281 of 330 in IA (top 85%) — acceptable for families but not a draw, mixed tenant base, ~2y average lease.
- Zoned schools: West Harrison Elementary (math 54% / reading 54%, grade C, #462 of 616 statewide, top 79%, 161 students, 55% FRL); West Harrison Middle School/High School (math 57% / reading 62%, grade C+, #263 of 336 statewide, top 81%, 148 students, 43% FRL) — zoned schools average 49% FRL vs 32% district-wide (17 pts higher); higher-poverty schools than district average — tighter screening recommended.
- Market conditions: 4 active listings in the ZIP; 41 units permitted in Harrison County in 2024 (0 in 5+ unit buildings).
Forward outlook
- In year one you build about $2k of equity ($294 loan paydown + $2k appreciation (3.9% local appreciation)).
- Harrison County population projected at -26% by 2050 — secular population decline; favor cash flow + early exit over multi-decade hold.
- At projected returns (3.9% appreciation + 3.0% rent growth), your $12k cash investment doubles in ~2 years — after that, you're playing with house money.
Negotiation context
- It's been on market 23 days — a 2% lower offer ($42k) is reasonable based on typical stale-listing flexibility.
Risks & watch-outs
- Watch-outs: property tax is 2.6% of price; built in 1914 — expect roof / HVAC / electrical / plumbing capex.
Questions for the listing agent
- Built in 1914 — when were the roof, HVAC, electrical panel, plumbing, and water heater last replaced?
- Property tax is high relative to price — has the assessment been appealed recently, and will the sale trigger a re-assessment?
- Is there a deadline driving the sale (1031 exchange, divorce, estate, relocation)? That informs how much negotiation room exists.
- Schools are F-rated, which usually means shorter tenancies and higher turnover. Who's the typical renter profile here, and what's been the actual vacancy rate?
- What's the average days-on-market for RENTAL listings here right now (not sales)? A rising rental-DOM trend means longer vacancies and softer asking-rent achievability than the comps imply.
- What's the recent tenant-quality profile in this submarket — average credit score on applications, eviction rate, late-payment / NSF rate, and stable-employment percentage? A property-management company in the area should have these aggregated.
- How much new for-sale + rental construction is in the pipeline within 1–3 miles? Heavy new supply typically softens prices + rents 12–24 months out; constrained supply supports both.
Investment metrics
- 1% rule
- 2.44% ✓
- Cap rate
- 20.03%
- Cash-on-cash
- 49.07%
- DSCR
- 3.18
- GRM
- 3.4
CMA / ARV
No comps found within radius.
Projected returns pro-forma
3.93% appreciation · 3.0% rent growth · sell at horizon
- IRR
- 55.4%
- Equity multiple
- 4.22×
- Total profit
- $38,281
- Equity at exit
- $21,376
- IRR
- 54.2%
- Equity multiple
- 8.59×
- Total profit
- $90,373
- Equity at exit
- $34,825
Cash invested: $11,900 (down + closing). Projections, not guarantees.
Landlord ↔ Tenant lean methodology
- Overall (STATE)
- 83 Strongly Landlord-Friendly
- State Iowa
- 83 Strongly Landlord-Friendly · R+6
- County
- — inherits STATE
- City
- — inherits STATE
ZIP-level market 51545
- Home prices YoY
- 3.5%
- Active inventory
- 4
- Price-to-rent
- 3.4×
Monthly cashflow live
- Estimated rent
- $1,037 medium interval (Pro) →
- Mortgage (P&I)
- −$223
- Tax from tax record
- −$92 /mo · $1,102/yr
- Insurance
- −$18
- HOA
- −$0
- Vacancy / Maint / Mgmt
- −$218
- Net cashflow
- $487
Break-even live
Sensitivity live
| Price | -10% $511 | -5% $499 | +0% $487 | +5% $475 | +10% $463 |
|---|---|---|---|---|---|
| Rent | -10% $405 | -5% $446 | +0% $487 | +5% $528 | +10% $569 |
| Rate | -1.0pp $508 | -0.5pp $497 | base $487 | +0.5pp $476 | +1.0pp $464 |
UW: 25.0% down · 7.5% · 30yr · 1.5% tax · 5.0% vac · 8.0% maint · 8.0% mgmt
Financing live
Cash to close
- Down payment
- $10,625
- Closing costs
- $1,275
- Reserves months
- —
- Total cash needed
- —
Loan-product check · same deal, 3 products live
Conventional
25% down · 7.5% · 30yr
- Down + closing
- —
- Monthly P&I
- —
- Monthly cashflow
- —
- DSCR
- —
- Eligible?
- —
Personal DTI + credit; lowest rate.
DSCR
20% down · 8.5% · 30yr
- Down + closing
- —
- Monthly P&I
- —
- Monthly cashflow
- —
- DSCR
- —
- Eligible?
- —
No personal income docs; deal must DSCR.
Hard money
10% down · 12.0% · 12mo
- Down + closing
- —
- Monthly P&I
- —
- Monthly cashflow
- —
- DSCR
- —
- Eligible?
- —
Short-term bridge; refi at stabilization.
Listing history 3 events
-
2026-04-18status Pending
-
2026-04-03historical Active Under Contract
-
2026-03-26$42,500 Active
ⓘ Source: listings_history table (triggers on properties + properties_extension) + one-shot
backfill from property_details.listing_events for pre-trigger history.
Tax reassessment forecast IA · Partial reset (capped growth)
- Current annual tax
- $1,102 · $92/mo
- Projected year-2 tax
- $1,102 · $92/mo
- Expected delta
- $0/yr ($0/mo · 0.0%)
ⓘ Screening estimate from a state-policy table — verify with the county assessor before closing.
Climate risk First Street
- Flood 1/10 Low FEMA zone D · 0% chance over 30 yrs
- Wildfire 2/10 Low
- Heat 3/10 Moderate 7 d/yr ≥105°F today · 15 d/yr by 30 yrs out
- Wind 2/10 Low
- Air quality 1/10 Low 0 unhealthy d/yr today · 0 by 30 yrs out
Nearby sold comps map
Loading sold comps map…
Walkable amenities ~0.75 mi
Loading nearby amenities…
Taxation est. · year 1
- Rental income
- $12,441
- − Mortgage interest
- −$2,381
- − Property taxes
- −$1,102
- − Insurance
- −$212
- − Repairs & maintenance
- −$995
- − Management
- −$995
- − Depreciation
- −$1,236
- Taxable income
- $5,519
- Est. tax owed @ 24.0%
- −$1,324
- After-tax cash flow
- $4,515/yr
For passive investors: Depreciation is non-cash, so a rental often shows a tax loss while cash-flowing — sheltering income. Rental losses are passive: they offset passive income freely, and up to $25,000/yr can offset ordinary (W-2) income if you actively participate and your MAGI is under $100k (phasing out to $0 by $150k); unused losses carry forward. On sale, claimed depreciation is recaptured at up to 25%, and gains may owe capital-gains tax (a 1031 exchange can defer both). Figures are a year-1 estimate at your 24.0% rate — not tax advice; consult a CPA.
Schools (NCES district)
- District
- West Harrison Community School District
- NCES district ID
- 1930960
- Math proficiency
- 55% ▼ -15.00%
- Reading proficiency
- 65% ▼ -10.00%
- Median HH income
- $49,566
- Composite
- 52.63/100
- National rank
- #3352
- State rank
- #281 of 330 in IA
Livability — River Sioux
- Score
- 58/100
- State rank
- #884
- US rank
- #20641
Category grades
Schools grade is shown separately in the Schools card above.
Census & demographics
- Census place
- River Sioux, IA
- Population (ZIP)
- 258
Population outlook (Harrison County) Hauer SSP2
- Today (2025)
- 13,193 people
- By 2030
- 12,519 · -5.1%
- By 2040
- 11,134 · -15.6%
- By 2050
- 9,749 · -26.1%
- By 2075
- 7,254 · -45.0%
- By 2100
- 5,298 · -59.8%
Race, ethnicity, and origin ACS 2023
- Neighborhood character
- Predominantly White (97%)
- Race & ethnicity
- White 97% Hispanic / Latino 2% Two or more races 1%
- Common ancestry
- Portuguese 1% Hungarian 1% Iranian 1%
- Languages at home
- 96% English-only · Spanish 2% German/W. Germanic 2%
Political lean MEDSL · Harrison
- 2024 margin
- Solid R (+41.8) · D 28.3% · R 70.1% · Other 1.6%
- 2008→2024 swing
- -37.2pp toward R · 2008: -4.7pp · 2024: -41.8pp
- All cycles
- 2024: R+41.8 2020: R+38.4 2016: R+37.5 2012: R+12.7 2008: R+4.7
Not yet ingested
- Civics
- —
Market trends
- HPI YoY
- ▲ 3.93%
- Current HPI
- 115.1704
- Rent YoY
- —
- Metro
- —
- State GDP YoY
- ▲ 2.48%
- F500 in state
- 4
Industry mix (Fortune 500 HQ in IA)
| Industry | F500 HQs | Revenue |
|---|---|---|
| Financial Services | 1 | $16B |
|
||
| Retail / Convenience | 1 | $15B |
|
||
Price history
3 events — show timeline
- 2026-04-18 Pending — IAR
- 2026-04-03 Contingent — IAR
- 2026-03-26 Listed $42,500 IAR
Property tax history
+11.1%/yrLatest (2025): $1,102 · +4.8% YoY. Source: county tax records.
Cash-flow waterfall
monthlySold comps — $/sqft
last 12 mo · ≤1 miLoading sold comps…