90 S Park Ave Unit B3 · Rockville Centre, NY
Flood risk 4/10 · Minor
- FEMA flood zone
- X (unshaded)
- Chance of flooding over 30 yrs
- 0.24%
- Est. flood insurance / yr
- $473 – $860
Fire risk 1/10 · Minimal
- Est. fire insurance / yr
- $691 – $1,283
Heat risk 6/10 · Moderate
- Hot days now (above 97°F)
- 7 days/yr
- Hot days in 30 yrs
- 16 days/yr
Wind risk 6/10 · Moderate
- Chance of severe wind over 30 yrs
- 69.0%
Air-quality risk 4/10 · Minor
- Unhealthy air days now
- 5 days/yr
- Unhealthy air days in 30 yrs
- 8 days/yr
Risk factors via First Street. Map © Google.
Why this score? — see what drove the F grade
The composite is a weighted blend of 9 inputs, each scored 0–100. Each bar is that input's sub-score; the figure is the points it added to the 100-point composite (weight × sub-score).
- ARV discount +8.2/15.0
- Schools +7.4/10.0
- Livability +4.3/5.0
- Cash flow +4.2/30.0
- 1% rule +3.1/10.0
- Rent growth +2.5/5.0
- Condition / age +2.5/5.0
- DSCR +0.0/10.0
- Appreciation +0.0/10.0
$375,000
🖨 Deal sheet 📄 Offer letter ✓ Due diligence
Listing remarks MLS
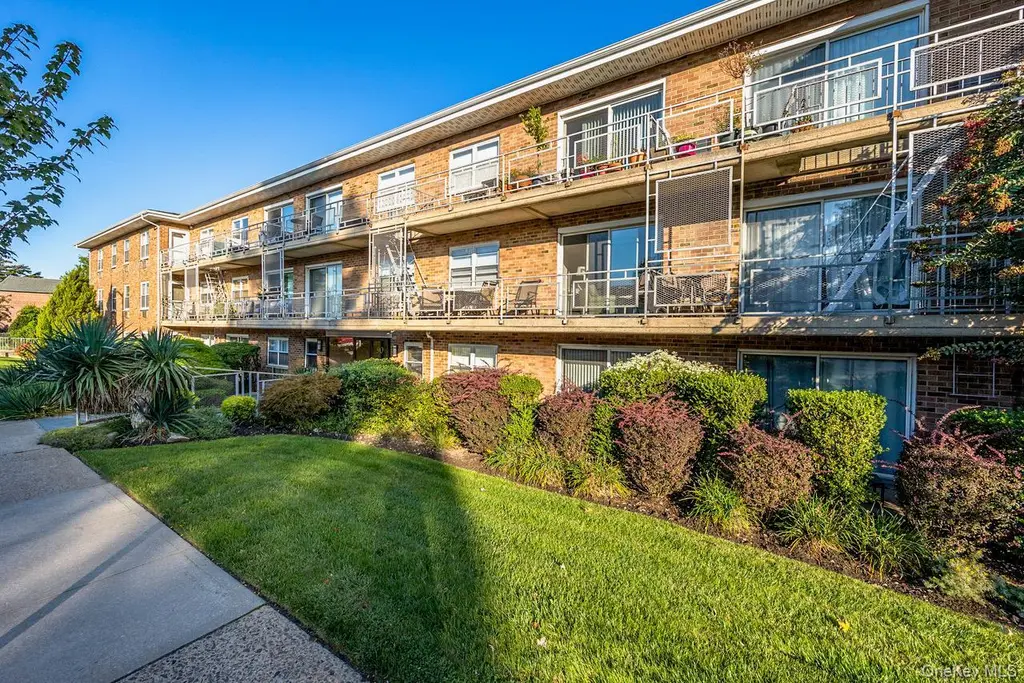
Discover a rare gem, a beautiful one-bedroom in the heart of Rockville Centre. This stunning, bright, and sunny Co-op features a renovated kitchen, spacious living room/dining room with your own private balcony that faces the back to enjoy your serenity. This lovely unit has great closet space and includes a private storage unit and one parking spot. Each floor has its own laundry room with this low maintenance that includes taxes, water, and heat. Convenient to shopping, village dining, and LIRR. Look no more!
Key facts
- Private balcony
- Laundry room
- Renovated kitchen
Tags
Neighborhood map
What this means for you Summary
Snapshot
- This is a 1-bed/1.0-bath condo listed at $375k.
Deal economics
- At list price, monthly cash flow is $-1k ($-12k/yr) — negative.
- To cash-flow at today's rent, offer at most $349k (7.0% below list).
- To meet the 1% rule (rent ≥ 1% of price), the offer needs to be $305k (18.6% below list).
- Recommended offer: $305k (18.6% below list) — sets the bar for 1% rule.
- Cap rate 3.0% vs local median 2.5% in Rockville Centre — meaningfully above typical; check what's discounted (condition, days-on-market, listing class) to confirm the premium yield is real.
Location & tenants
- Location reads 86/100 on livability (#17 in NY, #365 nationally) — a professional / high-income tenant draw. Strengths: schools A+, amenities A+, commute A+; Watch: cost of living F.
- Rockville Centre Union Free School District (suburban): math 82% / reading 82% proficiency, ranked #37 of 590 in NY (top 6%) — strong family-tenant draw, lease renewals of 3-5y typical; only 9% free/reduced lunch — higher-income household profile.
- Market conditions: 143 active listings in the ZIP; 13 comparable units currently listed for rent nearby; rentals at typical pace (median 25d on market — plan ~3-4 weeks tenant-placement turnaround); high-income renter base; 824 units permitted in Nassau County in 2024 (153 in 5+ unit buildings).
Forward outlook
- Local home prices are declining (-3.0%/yr); year-one equity from $3k of loan paydown is wiped out by about $11k of value loss. Plan a longer hold.
- Nassau County population projected at +7% by 2050 — modest demand growth; plan on rents tracking national, not racing it.
Negotiation context
- It's been on market 36 days — a 3% lower offer ($364k) is reasonable based on typical stale-listing flexibility.
- 3 sale attempts since 8y ago with the ask held roughly flat each time — persistent listings suggest the price (not the market) is what's stuck; bring a comps-based counter.
- Current owner paid $230k; list at $375k implies a 63% gain — meaningful room to come down on a strong offer.
Risks & watch-outs
- Watch-outs: HOA is 28% of rent.
- Climate carrying-cost: major wind risk, 69% chance of damaging wind over 30y; extreme-heat days projected 7→16/yr by 2055 (HVAC capex compounding) — expect insurance premiums to compound above CPI over the hold.
Questions for the listing agent
- What do current leases actually rent for vs. the listed asking? Can we see a recent rent roll and the last 12 months of T-12 income?
- It's been on market 36 days. Have you received any prior offers? Is the seller open to a 19% concession, seller financing, or rate buy-down credit?
- Built in 1969 — when were the roof, HVAC, electrical panel, plumbing, and water heater last replaced?
- What does the HOA fee cover, when was the last increase, and are there any pending special assessments or reserve-fund shortfalls?
- Any open or pending special assessments — roof, HVAC, plumbing, elevator, façade? What's the per-unit balance and payoff schedule, and is the seller paying it off at close or rolling it to the buyer?
- Is there a deadline driving the sale (1031 exchange, divorce, estate, relocation)? That informs how much negotiation room exists.
- Schools are A-rated — typically a magnet for longer-tenancy family renters. What's the average tenant stay here, and is there a school-zone premium baked into asking?
- The area grade is low — what's the realistic commute time and amenity access for the typical tenant pool here? Any planned neighborhood developments (good or bad) we should know about?
- What's the average days-on-market for RENTAL listings here right now (not sales)? A rising rental-DOM trend means longer vacancies and softer asking-rent achievability than the comps imply.
- What's the recent tenant-quality profile in this submarket — average credit score on applications, eviction rate, late-payment / NSF rate, and stable-employment percentage? A property-management company in the area should have these aggregated.
- How much new apartment / multifamily construction is in the pipeline within 1–3 miles? Heavy new supply (>2% of stock underway) typically softens rents 12–24 months out; light construction supports rent growth.
Investment metrics
- 1% rule
- 0.81% ✗
- Cap rate
- 3.02%
- Cash-on-cash
- -11.70%
- DSCR
- 0.48
- GRM
- 10.2
CMA / ARV
- ARV (median comp)
- $381,141
- List price
- $375,000
- Delta
- -1.61%
- Verdict
- FAIR
- Comps
- 20 within 1.0 mi
Projected returns pro-forma
-3.0% appreciation · 3.0% rent growth · sell at horizon
- IRR
- -37.5%
- Equity multiple
- -0.19×
- Total profit
- $-125,380
- Equity at exit
- $55,914
- IRR
- -52.8%
- Equity multiple
- -0.82×
- Total profit
- $-190,813
- Equity at exit
- $32,423
Cash invested: $105,000 (down + closing). Projections, not guarantees.
Landlord ↔ Tenant lean methodology
- Overall (STATE)
- 15 Strongly Tenant-Friendly
- State New York
- 15 Strongly Tenant-Friendly · D+10
- County
- — inherits STATE
- City
- — inherits STATE
ZIP-level market 11570
- Active inventory
- 143
- Price-to-rent
- 10.2×
Monthly cashflow live
- Estimated rent
- $3,052 high interval (Pro) →
- Mortgage (P&I)
- −$1,967
- Tax est. 1.5%
- −$469 /mo · $5,625/yr
- Insurance
- −$156
- HOA est. from 1 same-building comp
- −$843
- Vacancy / Maint / Mgmt
- −$641
- Net cashflow
- $-1,023
Break-even live
UW: 25.0% down · 7.5% · 30yr · 1.5% tax · 5.0% vac · 8.0% maint · 8.0% mgmt
Financing live
Cash to close
- Down payment
- $93,750
- Closing costs
- $11,250
- Reserves months
- —
- Total cash needed
- —
Loan-product check · same deal, 3 products live
Conventional
25% down · 7.5% · 30yr
- Down + closing
- —
- Monthly P&I
- —
- Monthly cashflow
- —
- DSCR
- —
- Eligible?
- —
Personal DTI + credit; lowest rate.
DSCR
20% down · 8.5% · 30yr
- Down + closing
- —
- Monthly P&I
- —
- Monthly cashflow
- —
- DSCR
- —
- Eligible?
- —
No personal income docs; deal must DSCR.
Hard money
10% down · 12.0% · 12mo
- Down + closing
- —
- Monthly P&I
- —
- Monthly cashflow
- —
- DSCR
- —
- Eligible?
- —
Short-term bridge; refi at stabilization.
Rent comps 13 comps
| Address | Beds | Baths | Sqft | Rent | $/sqft | DOM | Units | Dist |
|---|---|---|---|---|---|---|---|---|
| 111 S Centre Ave Apt 1SS Rockville Centre, NY | 2.0 | 1.0 | 950 | $3,250 | $3.42 | 4d | 1 | 0.08mi |
| 80 N Centre Ave Rockville Centre, NY | 3.0 | 1.0–3.5 | 1254 | $3,962 | $3.16 | 1d | 1 | 0.41mi |
| 45 Grand Ave Rockville Centre, NY | 2.0 | 1.0 | 800 | $3,000 | $3.75 | 24d | 1 | 0.53mi |
| 22 N Forest Ave Unit 3E Rockville Centre, NY | 1.0 | 1.0 | 800 | $2,500 | $3.12 | 24d | 1 | 0.53mi |
| 55 Grand Ave Apt 2A Rockville Centre, NY | 2.0 | 1.0 | 875 | $3,000 | $3.43 | 4d | 1 | 0.54mi |
| 8 Roswell Ave Oceanside, NY | 2.0 | 1.5 | 741 | $3,100 | $4.18 | 24d | 1 | 0.78mi |
| 275 Maple Ave Apt 6D Rockville Centre, NY | 2.0 | 1.0 | 673 | $2,875 | $4.27 | 24d | 1 | 0.86mi |
| 1 Jefferson Ave Unit K4 Rockville Centre, NY | 2.0 | 1.0 | 820 | $3,000 | $3.66 | 43d | 1 | 0.90mi |
| 24 Doxsey Pl Unit 3 Lynbrook, NY | 2.0 | 1.0 | 900 | $3,300 | $3.67 | 24d | 1 | 1.14mi |
| 112 Atlantic Ave Apt 71 Lynbrook, NY | 2.0 | 1.0 | 760 | $3,000 | $3.95 | 13d | 1 | 1.18mi |
| 318 Earle Ave Unit 2 Lynbrook, NY | 1.0 | 1.0 | 600 | $2,500 | $4.17 | 24d | 1 | 1.22mi |
| 157 Hempstead Ave Unit B6 Lynbrook, NY | 1.0 | 1.0 | 700 | $2,700 | $3.86 | 24d | 1 | 1.35mi |
| 336 Oceanside Pkwy Unit 1 Oceanside, NY | 2.0 | 1.0 | 850 | $2,650 | $3.12 | 12d | 1 | 1.40mi |
HOA detail condo
- Monthly dues
- $0 · $0/yr
- Likely covers
- water
- Assessments
- None detected in remarks — confirm with the listing agent.
Listing history 10 events
-
2026-05-05price $375,000 516-char remark
Show marketing remark (516 chars)
Discover a rare gem, a beautiful one-bedroom in the heart of Rockville Centre. This stunning, bright, and sunny Co-op features a renovated kitchen, spacious living room/dining room with your own private balcony that faces the back to enjoy your serenity. This lovely unit has great closet space and includes a private storage unit and one parking spot. Each floor has its own laundry room with this low maintenance that includes taxes, water, and heat. Convenient to shopping, village dining, and LIRR. Look no more!
-
2026-04-14$389,000 Active 516-char remark
Show marketing remark (516 chars)
Discover a rare gem, a beautiful one-bedroom in the heart of Rockville Centre. This stunning, bright, and sunny Co-op features a renovated kitchen, spacious living room/dining room with your own private balcony that faces the back to enjoy your serenity. This lovely unit has great closet space and includes a private storage unit and one parking spot. Each floor has its own laundry room with this low maintenance that includes taxes, water, and heat. Convenient to shopping, village dining, and LIRR. Look no more!
-
2023-01-21historical
-
2023-01-13price $325,000
-
2022-12-16price $329,000
-
2022-09-21$339,000 Active
-
2019-05-20soldstatus $230,000 Closed
-
2019-02-28status Under Contract
-
2019-01-29price $249,000
-
2018-12-10$259,000 New
ⓘ Source: listings_history table (triggers on properties + properties_extension) + one-shot
backfill from property_details.listing_events for pre-trigger history.
Climate risk First Street
- Flood 4/10 Moderate FEMA zone X (unshaded) · 24% chance over 30 yrs
- Wildfire 1/10 Low
- Heat 6/10 Major 7 d/yr ≥97°F today · 16 d/yr by 30 yrs out
- Wind 6/10 Major 69% chance of damaging wind over 30 yrs
- Air quality 4/10 Moderate 5 unhealthy d/yr today · 8 by 30 yrs out
Nearby sold comps map
Loading sold comps map…
Walkable amenities ~0.75 mi
Loading nearby amenities…
Taxation est. · year 1
- Rental income
- $36,626
- − Mortgage interest
- −$21,006
- − Property taxes
- −$5,625
- − Insurance
- −$1,875
- − Repairs & maintenance
- −$2,930
- − Management
- −$2,930
- − HOA
- −$10,116
- − Depreciation
- −$10,909
- Taxable loss
- −$18,765
- Est. tax savings @ 24.0%
- +$4,504
- After-tax cash flow
- $-7,777/yr
For passive investors: Depreciation is non-cash, so a rental often shows a tax loss while cash-flowing — sheltering income. Rental losses are passive: they offset passive income freely, and up to $25,000/yr can offset ordinary (W-2) income if you actively participate and your MAGI is under $100k (phasing out to $0 by $150k); unused losses carry forward. On sale, claimed depreciation is recaptured at up to 25%, and gains may owe capital-gains tax (a 1031 exchange can defer both). Figures are a year-1 estimate at your 24.0% rate — not tax advice; consult a CPA.
Schools (NCES district)
- District
- Rockville Centre Union Free School District
- NCES district ID
- 3624780
- Math proficiency
- 82% ▲ 3.00%
- Reading proficiency
- 82% ▲ 2.00%
- Median HH income
- $102,401
- Composite
- 74.33/100
- National rank
- #162
- State rank
- #37 of 590 in NY
Livability — Rockville Centre
- Score
- 86/100
- State rank
- #17
- US rank
- #365
Category grades
Schools grade is shown separately in the Schools card above.
Census & demographics
- Census place
- Rockville Centre, NY
- County
- Nassau County · 653,051 people
- City population
- 28,908
- Metro
- New York-Newark-Jersey City, NY-NJ-PA
- Population (ZIP)
- 28,908
- Household income
- $157,163
- Rent vs Own
- Severe rent burden
- 732.0
Population outlook (Nassau County) Hauer SSP2
- Today (2025)
- 1,409,302 people
- By 2030
- 1,431,482 · +1.6%
- By 2040
- 1,471,607 · +4.4%
- By 2050
- 1,502,845 · +6.6%
- By 2075
- 1,575,403 · +11.8%
- By 2100
- 1,554,356 · +10.3%
Race, ethnicity, and origin ACS 2023
- Neighborhood character
- Predominantly White (74%)
- Race & ethnicity
- White 74% Hispanic / Latino 12% Two or more races 7% Black 5% Asian 5%
- Hispanic origin (detail)
- Puerto Rican 2% Dominican 4%
- Common ancestry
- Romanian 4% Scotch-Irish 4% Subsaharan African 1%
- Foreign-born
- 12% · Canada, China, South Korea
- Languages at home
- 84% English-only · Spanish 8% Other Indo-European 5% Chinese 1%
Political lean MEDSL · Nassau
- 2024 margin
- Toss-up / Even · D 47.9% · R 52.1%
- 2008→2024 swing
- -12.6pp toward R · 2008: 8.4pp · 2024: -4.2pp
- All cycles
- 2024: R+4.2 2020: D+9.5 2016: D+5.3 2012: D+6.7 2008: D+8.4
Not yet ingested
- Civics
- —
Market trends
- HPI YoY
- ▼ -731.15%
- Current HPI
- 275.9882
- Rent YoY
- —
- Metro
- New York-Newark-Jersey City, NY-NJ-PA
- State GDP YoY
- ▲ 2.60%
- F500 in state
- 92
Industry mix (Fortune 500 HQ in NY)
| Industry | F500 HQs | Revenue |
|---|---|---|
| Financial Services | 10 | $950B |
|
||
| Consumer Goods | 9 | $162B |
|
||
| Insurance | 4 | $225B |
|
||
| Telecommunications | 2 | $144B |
|
||
| Pharmaceuticals | 2 | $112B |
|
||
| Media / Entertainment | 2 | $69B |
|
||
Price history
+44.8% since first listed10 events — show timeline
- 2026-05-05 Price Changed $375,000 OneKey® MLS as Distributed by MLS Grid
- 2026-04-14 Listed $389,000 OneKey® MLS as Distributed by MLS Grid
- 2023-01-21 Listing Removed — OneKey® MLS as Distributed by MLS Grid
- 2023-01-13 Price Changed $325,000 OneKey® MLS as Distributed by MLS Grid
- 2022-12-16 Price Changed $329,000 OneKey® MLS as Distributed by MLS Grid
- 2022-09-21 Listed $339,000 OneKey® MLS as Distributed by MLS Grid
- 2019-05-20 Sold (MLS) $230,000 OneKey® MLS as Distributed by MLS Grid
- 2019-02-28 Pending — OneKey® MLS as Distributed by MLS Grid
- 2019-01-29 Price Changed $249,000 OneKey® MLS as Distributed by MLS Grid
- 2018-12-10 Listed $259,000 OneKey® MLS as Distributed by MLS Grid
Cash-flow waterfall
monthlySold comps — $/sqft
last 12 mo · ≤1 miLoading sold comps…