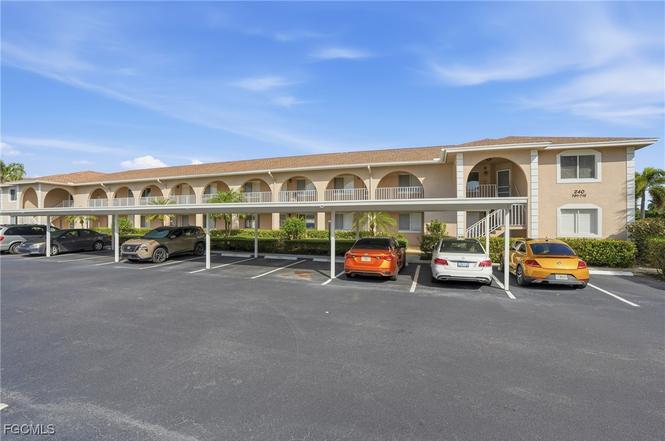
240 Pebble Beach Blvd #712 · Lely, FL
Flood risk 9/10 · Severe
- FEMA flood zone
- X (shaded)
- Chance of flooding over 30 yrs
- 0.99%
- Est. flood insurance / yr
- $507 – $1,088
Fire risk 2/10 · Minimal
- Est. fire insurance / yr
- $947 – $1,759
Heat risk 10/10 · Severe
- Hot days now (above 107°F)
- 7 days/yr
- Hot days in 30 yrs
- 29 days/yr
Wind risk 10/10 · Severe
- Chance of severe wind over 30 yrs
- 99.0%
Air-quality risk 2/10 · Minimal
- Unhealthy air days now
- 2 days/yr
- Unhealthy air days in 30 yrs
- 2 days/yr
Risk factors via First Street. Map © Google.
Why this score? — see what drove the B grade
The composite is a weighted blend of 9 inputs, each scored 0–100. Each bar is that input's sub-score; the figure is the points it added to the 100-point composite (weight × sub-score).
- Cash flow +30.0/30.0
- 1% rule +10.0/10.0
- DSCR +10.0/10.0
- ARV discount +7.5/15.0
- Schools +5.0/10.0
- Rent growth +3.9/5.0
- Livability +3.3/5.0
- Condition / age +2.5/5.0
- Appreciation +0.0/10.0
$210,000
🖨 Deal sheet (PDF) 📄 Offer letter ✓ Due diligence
Listing remarks
Welcome to this beautiful 3-bedroom, 2-bath condo. This second-story residence offers peaceful open-space and golf course views, creating a bright and relaxing atmosphere. The home features an updated kitchen with stainless steel appliances, ample cabinetry, and a functional layout perfect for everyday living and entertaining. Enjoy the comfort of a quiet, well-kept community with a community pool just steps away. Conveniently located minutes from shopping, dining, and entertainment, this condo offers the perfect blend of tranquility and accessibility.
Key facts
- Community pool
- Updated kitchen
- Golf course views
Tags
Property features AI
Finance
- Financial info: Pets allowed on a conditional basis (maximum pet weight 25 lbs)
- HOA & community: Part of a 60-unit community; Homeowners association with quarterly fee; Association covers management, insurance, irrigation water, legal/accounting, grounds maintenance, pest control, reserve fund, sewer, street lights and trash; Community amenities include clubhouse, pool, sidewalks, vehicle wash area and on-site management; Non-gated community with street lights
Exterior
- Parking: Assigned covered parking; Detached carport; One covered space (carport)
- Utilities: Public water; Public sewer; Cable available; High-speed internet available; Underground utilities
- Home design: Single-story (1 story); Entry level at 2; Resale property
- Construction: Block, concrete and stucco construction; Shingle roof
- Exterior features: Patio; Community pool; Municipal irrigation; Paved road access; North exposure; Has a view; South-facing
Interior
- Kitchen: Dishwasher; Electric cooktop; Disposal; Microwave; Refrigerator
- Bedrooms: Entry level: 2
- Flooring: Laminate flooring; Tile flooring
- Bathrooms: Two full bathrooms
- Heating & cooling: Central heating (electric); Central air conditioning (electric)
- Interior features: Cable TV available; Dual sinks in bath(s); Family/dining room layout; Living/dining room combination; Walk-in closet(s); Split bedroom floorplan; See remarks
- Laundry & utility: Washer included; Laundry located inside
Neighborhood map
What this means for you Summary
Snapshot
- This is a 3-bed/2.0-bath condo listed at $210k.
Deal economics
- At list price, monthly cash flow is $1k ($13k/yr) — positive.
- The deal already cash-flows at list — no discount required.
- Meets the 1% rule at list price ($4k rent vs $210k).
- Recommended offer: $191k (9.0% below list) — sets the bar for market timing.
Location & tenants
- Location reads 66/100 on livability (#586 in FL) — a middle-class / working-renter tenant base. Strengths: crime A+, housing A+; Watch: health & safety D, amenities F, commute F.
- Collier (suburban): math 60% / reading 56% proficiency, ranked #16 of 73 in FL (top 22%) — acceptable for families but not a draw, mixed tenant base, ~2y average lease.
- Zoned schools: Lely Elementary School (math 45% / reading 46%, grade D-, #1,247 of 2,144 statewide, top 59%, 499 students, 62% FRL); Manatee Middle School (math 61% / reading 43%, grade C+, #217 of 571 statewide, top 40%, 749 students, 64% FRL); Lely High School (math 40% / reading 39%, grade F, #304 of 667 statewide, top 47%, 1,504 students, 54% FRL).
- Zoned-school proficiency averages 46% at this address vs 58% district-wide (-12 pts) — the specific schools serving this property underperform the Collier average; the district grade overstates school quality for this exact location.
- Market conditions: Rents rising fast (+5.6%/yr); 599 active listings in the ZIP; 40 comparable units currently listed for rent nearby; rentals at typical pace (median 26d on market — plan ~3-4 weeks tenant-placement turnaround); solid renter incomes; 3,520 units permitted in Collier County in 2024 (959 in 5+ unit buildings).
Forward outlook
- Local home prices are declining (-3.0%/yr); year-one equity from $1k of loan paydown is wiped out by about $6k of value loss. Plan a longer hold.
- Collier County population projected at +30% by 2050 — long-run rental-demand tailwind backs the buy-and-hold thesis.
- At projected returns (-3.0% appreciation + 5.6% rent growth), your $59k cash investment doubles in ~5 years — after that, you're playing with house money.
Negotiation context
- It's been on market 99 days — a 9% lower offer ($191k) is reasonable based on typical stale-listing flexibility.
- 5 sale attempts since 19y ago with the ask held roughly flat each time — persistent listings suggest the price (not the market) is what's stuck; bring a comps-based counter.
- Current owner paid $74k; list at $210k implies a 182% gain — meaningful room to come down on a strong offer.
Risks & watch-outs
- Watch-outs: flood insurance adds $66/mo.
- Climate carrying-cost: severe flood risk; severe wind risk, 99% chance of damaging wind over 30y; extreme-heat days projected 7→29/yr by 2055 (HVAC capex compounding) — expect insurance premiums to compound above CPI over the hold.
Questions for the listing agent
- It's been on market 99 days. Have you received any prior offers? Is the seller open to a 9% concession, seller financing, or rate buy-down credit?
- What's the actual annual flood-insurance premium (NFIP or private), and is the property in a SFHA with mandatory coverage?
- What does the HOA fee cover, when was the last increase, and are there any pending special assessments or reserve-fund shortfalls?
- Any open or pending special assessments — roof, HVAC, plumbing, elevator, façade? What's the per-unit balance and payoff schedule, and is the seller paying it off at close or rolling it to the buyer?
- Why hasn't it sold? Are there any deal-killer items the seller is aware of (foundation, flood, title, zoning, code violations)?
- Is there a deadline driving the sale (1031 exchange, divorce, estate, relocation)? That informs how much negotiation room exists.
- Schools are D-rated, which usually means shorter tenancies and higher turnover. Who's the typical renter profile here, and what's been the actual vacancy rate?
- What's the average days-on-market for RENTAL listings here right now (not sales)? A rising rental-DOM trend means longer vacancies and softer asking-rent achievability than the comps imply.
- What's the recent tenant-quality profile in this submarket — average credit score on applications, eviction rate, late-payment / NSF rate, and stable-employment percentage? A property-management company in the area should have these aggregated.
- How much new apartment / multifamily construction is in the pipeline within 1–3 miles? Heavy new supply (>2% of stock underway) typically softens rents 12–24 months out; light construction supports rent growth.
Investment metrics
- 1% rule
- 1.79% ✓
- Cap rate
- 12.72%
- Cash-on-cash
- 22.96%
- DSCR
- 2.02
- GRM
- 4.6
CMA / ARV
No comps found within radius.
Projected returns pro-forma
-3.0% appreciation · 5.59% rent growth · sell at horizon
- IRR
- 17.7%
- Equity multiple
- 1.74×
- Total profit
- $43,792
- Equity at exit
- $31,312
- IRR
- 28.3%
- Equity multiple
- 3.89×
- Total profit
- $169,878
- Equity at exit
- $18,157
Cash invested: $58,800 (down + closing). Projections, not guarantees.
Landlord ↔ Tenant lean methodology
- Overall (STATE)
- 87 Strongly Landlord-Friendly
- State Florida
- 87 Strongly Landlord-Friendly · R+3
- County
- — inherits STATE
- City
- — inherits STATE
ZIP-level market 34113
- Rents YoY
- 5.6%
- Active inventory
- 599
- Price-to-rent
- 4.6×
Monthly cashflow live
- Estimated rent
- $3,764 high interval (Pro) →
- Mortgage (P&I)
- −$1,101
- Tax from tax record
- −$243 /mo · $2,916/yr
- Insurance
- −$88
- Flood insurance flood zone
- −$66 /mo · $798/yr
- HOA
- −$417
- Lot rent
- −$0
- Vacancy / Maint / Mgmt
- −$790
- Net cashflow
- $1,059
Break-even live
Sensitivity live
| Price | -10% $1,177 | -5% $1,118 | +0% $1,059 | +5% $999 | +10% $940 |
|---|---|---|---|---|---|
| Rent | -10% $761 | -5% $910 | +0% $1,059 | +5% $1,207 | +10% $1,356 |
| Rate | -1.0pp $1,164 | -0.5pp $1,112 | base $1,059 | +0.5pp $1,004 | +1.0pp $949 |
UW: 25.0% down · 7.5% · 30yr · 1.5% tax · 5.0% vac · 8.0% maint · 8.0% mgmt
Financing live
Cash to close
- Down payment
- $52,500
- Closing costs
- $6,300
- Reserves months
- —
- Total cash needed
- —
Loan-product check · same deal, 3 products live
Conventional
25% down · 7.5% · 30yr
- Down + closing
- —
- Monthly P&I
- —
- Monthly cashflow
- —
- DSCR
- —
- Eligible?
- —
Personal DTI + credit; lowest rate.
DSCR
20% down · 8.5% · 30yr
- Down + closing
- —
- Monthly P&I
- —
- Monthly cashflow
- —
- DSCR
- —
- Eligible?
- —
No personal income docs; deal must DSCR.
Hard money
10% down · 12.0% · 12mo
- Down + closing
- —
- Monthly P&I
- —
- Monthly cashflow
- —
- DSCR
- —
- Eligible?
- —
Short-term bridge; refi at stabilization.
Rent comps 40 comps
| Address | Beds | Baths | Sqft | Rent | $/sqft | DOM | Units | Dist |
|---|---|---|---|---|---|---|---|---|
| 240 Pebble Beach Blvd #702 Naples, FL | 2.0 | 2.0 | 1090 | $4,000 | $3.67 | 26d | 1 | 0.03mi |
| 213 Bay Meadows Dr Naples, FL | 3.0 | 2.0 | 1650 | $5,500 | $3.33 | 26d | 1 | 0.09mi |
| 190 Pebble Beach Blvd #301 Naples, FL | 2.0 | 2.0 | 954 | $1,700 | $1.78 | 26d | 1 | 0.11mi |
| 232 Pebble Beach Blvd #104 Naples, FL | 3.0 | 2.0 | 1298 | $1,975 | $1.52 | 26d | 1 | 0.12mi |
| 5419 Rattlesnake Hammock Rd Unit 307F Naples, FL | 2.0 | 2.0 | 1071 | $1,950 | $1.82 | 16d | 1 | 0.32mi |
| 5499 Rattlesnake Hammock Rd Naples, FL | 2.0 | 2.0 | 1071 | $1,775 | $1.66 | 16d | 2 | 0.34mi |
| 452 Bristle Cone Ln #27 Naples, FL | 2.0 | 2.0 | 1129 | $2,000 | $1.77 | 26d | 1 | 0.42mi |
| 5535 Rattlesnake Hammock Rd #302 Naples, FL | 2.0 | 2.0 | 1205 | $2,800 | $2.32 | 26d | 1 | 0.44mi |
| 332 Charlemagne Blvd Unit H101 Naples, FL | 2.0 | 2.0 | 1082 | $3,500 | $3.23 | 26d | 1 | 0.47mi |
| 332 Charlemagne Blvd Unit H103 Naples, FL | 2.0 | 2.0 | 1082 | $3,495 | $3.23 | 26d | 1 | 0.47mi |
| 255 Pine Valley Cir Naples, FL | 3.0 | 1.5 | 1574 | $3,500 | $2.22 | 26d | 1 | 0.47mi |
| 5595 Greenwood Cir #92 Naples, FL | 3.0 | 2.0 | 1450 | $5,000 | $3.45 | 26d | 1 | 0.48mi |
| 6875 Saona Ct Naples, FL | 2.0 | 2.0 | 1565 | $8,000 | $5.11 | 26d | 1 | 0.48mi |
| 5502 Greenwood Cir #1 Naples, FL | 3.0 | 2.0 | 1450 | $2,400 | $1.66 | 26d | 1 | 0.49mi |
| 5635 Rattlesnake Hammock Rd Apt 203D Naples, FL | 2.0 | 2.0 | 1054 | $1,700 | $1.61 | 23d | 1 | 0.51mi |
| 300 Valley Stream Dr Unit 3D Naples, FL | 2.0 | 2.0 | 979 | $1,795 | $1.83 | 26d | 1 | 0.52mi |
| 300 Valley Stream Dr Unit 3D Naples, FL | 2.0 | 2.0 | 979 | $1,795 | $1.83 | 23d | 1 | 0.52mi |
| 200 Valley Stream Dr Unit 8B Naples, FL | 2.0 | 2.0 | 979 | $1,750 | $1.79 | 26d | 1 | 0.52mi |
| 6984 Saona Ct Naples, FL | 2.0 | 2.0 | 1472 | $7,500 | $5.10 | 26d | 1 | 0.53mi |
| 5651 Rattlesnake Hammock Rd Unit C-108 Naples, FL | 2.0 | 2.0 | 1054 | $1,800 | $1.71 | 26d | 1 | 0.53mi |
| 315 Saint Andrews Blvd Unit A25 Naples, FL | 2.0 | 2.0 | 1126 | $1,530 | $1.36 | 26d | 1 | 0.57mi |
| 4977 Pepper Cir #205 Naples, FL | 2.0 | 2.0 | 1250 | $2,250 | $1.80 | 23d | 1 | 0.59mi |
| 360 Charlemagne Blvd Unit D105 Naples, FL | 2.0 | 2.0 | 1082 | $3,200 | $2.96 | 26d | 1 | 0.59mi |
| 7110 Cayo Coco Ln Naples, FL | 2.0 | 2.0 | 1387 | $9,250 | $6.67 | 26d | 1 | 0.60mi |
| 248 Pebble Beach Cir Unit G201 Naples, FL | 2.0 | 2.0 | 1163 | $2,300 | $1.98 | 26d | 1 | 0.61mi |
| 7142 Cayo Coco Ln Naples, FL | 2.0 | 2.0 | 1490 | $10,000 | $6.71 | 26d | 1 | 0.61mi |
| 520 Augusta Blvd Unit B204 Naples, FL | 3.0 | 2.0 | 1294 | $2,200 | $1.70 | 26d | 1 | 0.61mi |
| 4410 Chantelle Dr Unit H-205 Naples, FL | 2.0 | 2.0 | 1349 | $3,500 | $2.59 | 16d | 1 | 0.61mi |
| 7138 Cayo Coco Ln Naples, FL | 2.0 | 2.0 | 1205 | $6,500 | $5.39 | 26d | 1 | 0.62mi |
| 7124 Saona Ct Naples, FL | 2.0 | 2.0 | 1387 | $8,000 | $5.77 | 26d | 1 | 0.63mi |
| 7197 Saona Ct Unit 1545994P Naples, FL | 2.0 | 2.0 | 1291 | $4,152 | $3.22 | 16d | 1 | 0.63mi |
| 326 Bradstrom Cir Unit 103F Naples, FL | 2.0 | 2.0 | 1113 | $1,800 | $1.62 | 26d | 1 | 0.63mi |
| 326 Bradstrom Cir Unit 204F Naples, FL | 3.0 | 2.0 | 1200 | $3,500 | $2.92 | 26d | 1 | 0.63mi |
| 5778 Greenwood Cir Naples, FL | 3.0 | 2.0 | 1450 | $4,000 | $2.76 | 26d | 1 | 0.65mi |
| 413 Augusta Blvd #302 Naples, FL | 2.0 | 2.0 | 1390 | $5,500 | $3.96 | 23d | 1 | 0.65mi |
| 7213 Saona Ct Naples, FL | 2.0 | 2.0 | 1308 | $7,500 | $5.73 | 26d | 1 | 0.65mi |
| 7204 Cayo Coco Ln Naples, FL | 2.0 | 2.0 | 1308 | $7,500 | $5.73 | 26d | 1 | 0.65mi |
| 7289 Saona Ct Naples, FL | 2.0 | 2.0 | 1411 | $10,000 | $7.09 | 26d | 1 | 0.67mi |
| 7162 Saona Ct Naples, FL | 2.0 | 2.0 | 1482 | $9,000 | $6.07 | 26d | 1 | 0.67mi |
| 332 Bradstrom Cir #201 Naples, FL | 2.0 | 2.0 | 1257 | $2,200 | $1.75 | 26d | 1 | 0.67mi |
HOA detail condo
- Monthly dues
- $417 · $5,004/yr
- Likely covers
- pool
- Assessments
- None detected in remarks — confirm with the listing agent.
Listing history 18 events
-
2026-06-02status $210,000 Pending 99 DOM
-
2026-06-01days on market $210,000 Active 99 DOM
-
2026-05-31days on market $210,000 Active 98 DOM
-
2026-05-30status $210,000 Active 97 DOM
-
2026-05-22status Pending
-
2026-04-09status Active
-
2026-04-09price $210,000
-
2026-03-22status Pending
-
2026-01-27$220,000 Active
-
2025-12-22historical
-
2025-10-30price $249,999
-
2025-08-28$269,999 Active
-
2024-08-21historical $2,450
-
2024-07-06price $2,450
-
2024-06-03$2,750
-
2009-12-16historical
-
2007-01-17$279,000
-
1992-05-01soldstatus $74,400
ⓘ Source: listings_history table (triggers on properties + properties_extension) + one-shot
backfill from property_details.listing_events for pre-trigger history.
Tax reassessment forecast FL · Resets to sale price
- Current annual tax
- $2,916 · $243/mo
- Projected year-2 tax
- $2,916 · $243/mo
- Expected delta
- $0/yr ($0/mo · 0.0%)
ⓘ Screening estimate from a state-policy table — verify with the county assessor before closing.
Climate risk First Street
- Flood 9/10 Extreme FEMA zone X (shaded) · 99% chance over 30 yrs
- Wildfire 2/10 Low
- Heat 10/10 Extreme 7 d/yr ≥107°F today · 29 d/yr by 30 yrs out
- Wind 10/10 Extreme 99% chance of damaging wind over 30 yrs
- Air quality 2/10 Low 2 unhealthy d/yr today · 2 by 30 yrs out
Nearby sold comps map
Loading sold comps map…
Walkable amenities ~0.75 mi
Loading nearby amenities…
Taxation est. · year 1
- Rental income
- $45,171
- − Mortgage interest
- −$11,763
- − Property taxes
- −$2,916
- − Insurance
- −$1,847
- − Repairs & maintenance
- −$3,614
- − Management
- −$3,614
- − HOA
- −$5,004
- − Depreciation
- −$6,109
- Taxable income
- $10,303
- Est. tax owed @ 24.0%
- −$2,473
- After-tax cash flow
- $10,229/yr
For passive investors: Depreciation is non-cash, so a rental often shows a tax loss while cash-flowing — sheltering income. Rental losses are passive: they offset passive income freely, and up to $25,000/yr can offset ordinary (W-2) income if you actively participate and your MAGI is under $100k (phasing out to $0 by $150k); unused losses carry forward. On sale, claimed depreciation is recaptured at up to 25%, and gains may owe capital-gains tax (a 1031 exchange can defer both). Figures are a year-1 estimate at your 24.0% rate — not tax advice; consult a CPA.
Schools (NCES district)
- District
- Collier
- NCES district ID
- 1200330
- Math proficiency
- 60% ▼ -4.00%
- Reading proficiency
- 56% ▼ -2.00%
- Median HH income
- $58,275
- Composite
- 50.23/100
- National rank
- #1892
- State rank
- #16 of 73 in FL
Livability — Lely
- Score
- 66/100
- State rank
- #586
- US rank
- #11224
Category grades
Schools grade is shown separately in the Schools card above.
Census & demographics
- Census place
- Lely, FL
- County
- Collier County · 396,295 people
- Metro
- Naples-Marco Island, FL
- Population (ZIP)
- 26,056
- Household income
- $81,674
- Rent vs Own
- Severe rent burden
- 954.0
Population outlook (Collier County) Hauer SSP2
- Today (2025)
- 420,858 people
- By 2030
- 450,054 · +6.9%
- By 2040
- 502,232 · +19.3%
- By 2050
- 544,932 · +29.5%
- By 2075
- 627,203 · +49.0%
- By 2100
- 659,015 · +56.6%
Race, ethnicity, and origin ACS 2023
- Neighborhood character
- Diverse neighborhood (Simpson 0.59)
- Race & ethnicity
- White 56% Hispanic / Latino 28% Black 12% Two or more races 11% Asian 2%
- Hispanic origin (detail)
- Mexican 17% Puerto Rican 3% Cuban 2%
- Common ancestry
- Hispanic 10% Romanian 3% Lithuanian 2%
- Foreign-born
- 26% · Canada, Jamaica, Vietnam
- Languages at home
- 63% English-only · Spanish 24% French/Haitian/Cajun 9% Other Indo-European 2%
Political lean MEDSL · Collier
- 2024 margin
- Solid R (+33.1) · D 33.1% · R 66.2%
- 2008→2024 swing
- -10.6pp toward R · 2008: -22.5pp · 2024: -33.1pp
- All cycles
- 2024: R+33.1 2020: R+24.7 2016: R+26.0 2012: R+30.1 2008: R+22.5
Not yet ingested
- Civics
- —
Market trends
- HPI YoY
- ▼ -194.86%
- Current HPI
- 279.4232
- Rent YoY
- ▲ 5.59%
- Metro
- Naples-Marco Island, FL
- State GDP YoY
- ▲ 3.28%
- F500 in state
- 36
Industry mix (Fortune 500 HQ in FL)
| Industry | F500 HQs | Revenue |
|---|---|---|
| Industrial Technology | 2 | $29B |
|
||
| Insurance | 2 | $17B |
|
||
| Retail | 1 | $60B |
|
||
| Technology Distribution | 1 | $58B |
|
||
| Homebuilding | 1 | $35B |
|
||
| Technology Manufacturing | 1 | $35B |
|
||
Price history
+182.3% since first listed14 events — show timeline
- 2026-05-22 Pending — FORTMLS
- 2026-04-09 Relisted — FORTMLS
- 2026-04-09 Price Changed $210,000 FORTMLS
- 2026-03-22 Pending — FORTMLS
- 2026-01-27 Listed $220,000 FORTMLS
- 2025-12-22 Listing Removed — NAPLESMLS
- 2025-10-30 Price Changed $249,999 NAPLESMLS
- 2025-08-28 Listed $269,999 NAPLESMLS
- 2024-08-21 Rental Removed $2,450 NAPLESMLS
- 2024-07-06 Price Changed $2,450 NAPLESMLS
- 2024-06-03 Listed for Rent $2,750 NAPLESMLS
- 2009-12-16 Listing Removed — NAPLESMLS
- 2007-01-17 Listed $279,000 NAPLESMLS
- 1992-05-01 Sold (Public Records) $74,400 Public Records
Property tax history
+8.0%/yrLatest (2025): $2,916 · +9.5% YoY. Source: county tax records.
Cash-flow waterfall
monthlySold comps — $/sqft
last 12 mo · ≤1 miLoading sold comps…