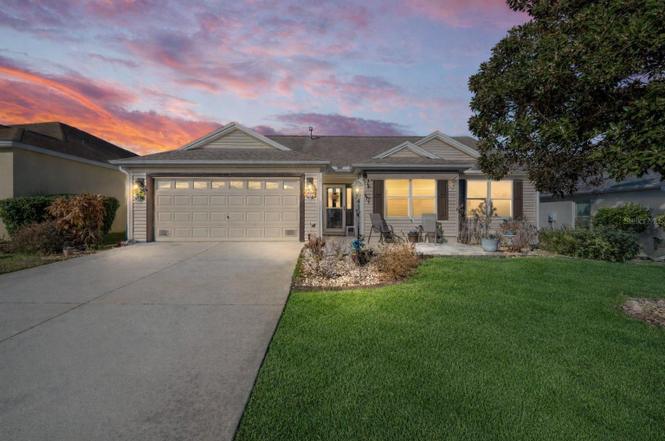
1504 Lynchburg Loop · The Villages, FL
Flood risk 1/10 · Minimal
- FEMA flood zone
- X (unshaded)
- Chance of flooding over 30 yrs
- 0.0%
- Est. flood insurance / yr
- $507 – $1,088
Fire risk 4/10 · Minor
- Est. fire insurance / yr
- $947 – $1,759
Heat risk 9/10 · Severe
- Hot days now (above 108°F)
- 7 days/yr
- Hot days in 30 yrs
- 23 days/yr
Wind risk 9/10 · Severe
- Chance of severe wind over 30 yrs
- 99.0%
Air-quality risk 3/10 · Minor
- Unhealthy air days now
- 2 days/yr
- Unhealthy air days in 30 yrs
- 3 days/yr
Risk factors via First Street. Map © Google.
Why this score? — see what drove the D grade
The composite is a weighted blend of 9 inputs, each scored 0–100. Each bar is that input's sub-score; the figure is the points it added to the 100-point composite (weight × sub-score).
- ARV discount +10.0/15.0
- Cash flow +9.9/30.0
- Schools +5.2/10.0
- Rent growth +3.5/5.0
- Livability +3.5/5.0
- 1% rule +3.3/10.0
- DSCR +2.8/10.0
- Condition / age +2.5/5.0
- Appreciation +0.0/10.0
$339,900
🖨 Deal sheet (PDF) 📄 Offer letter ✓ Due diligence
Listing remarks
TURNKEY Custom Whispering Pine | Bond Paid | Prime Location Near Lake Sumter Landing Welcome to this beautifully maintained Custom Whispering Pine featuring a spacious, open floor plan designed for comfortable Florida living. The heart of the home is the huge open kitchen with abundant cabinetry, generous counter space, and seamless flow into the main living and dining areas—perfect for entertaining. This thoughtfully designed home offers 2 bedrooms plus a den, 2 bathrooms, and a 2-car garage, providing flexibility for guests, hobbies, or a home office. Enjoy outdoor living with an enclosed lanai and a charming front paver patio, ideal for relaxing mornings or evening gatherings. M
Key facts
- Open floor plan
- Abundant cabinetry
- Front paver patio
Tags
Property features AI
Finance
- Other: Turnkey/furnished; No home warranty; No lease restrictions reported
- Financial info: Total monthly association fees reported; Total annual association fees reported
- HOA & community: Association amenities include fitness center, pool, golf, park, tennis and racquetball courts, shuffleboard, and owned recreation facilities; Deed-restricted, senior community; Pets allowed; Association fees billed monthly and annually
Exterior
- Parking: Attached 2-car garage (24 x 20)
- Security: Gated community; Smoke detectors
- Utilities: Public water; Public sewer; Electricity connected; Cable available and connected; BB/HS internet available; Fire hydrant on property
- Home design: Single family residence; One story; Model: Whispering Pine; Faces east; Residential zoning (R-1)
- Construction: Frame construction; Shingle roof; Slab foundation; Built as part of a development (CDD)
- Exterior features: Rain gutters; Paved roads; Near public transit; Property located in county
Interior
- Kitchen: Range; Microwave; Refrigerator; Disposal
- Bedrooms: 3 bedrooms
- Flooring: Carpet; Ceramic tile; Vinyl
- Bathrooms: 2 full bathrooms
- Heating & cooling: Central heating; Central air conditioning
- Interior features: Cathedral and vaulted ceilings; Ceiling fans; Eat-in kitchen; High ceilings; Walk-in closets; Blinds
- Laundry & utility: Washer and dryer included; Laundry located inside; Gas water heater
Neighborhood map
What this means for you Summary
Snapshot
- This is a 3-bed/2.0-bath single-family listed at $340k.
Deal economics
- At list price, monthly cash flow is $-211 ($-3k/yr) — negative.
- To cash-flow at today's rent, offer at most $303k (11.0% below list).
- To meet the 1% rule (rent ≥ 1% of price), the offer needs to be $281k (17.2% below list).
- Recommended offer: $281k (17.2% below list) — sets the bar for 1% rule.
Location & tenants
- Location reads 70/100 on livability (#431 in FL) — a middle-class / working-renter tenant base. Strengths: crime A+, housing A, employment B+; Watch: amenities F, commute F, health & safety F.
- Sumter (rural): math 61% / reading 61% proficiency, ranked #11 of 73 in FL (top 15%) — acceptable for families but not a draw, mixed tenant base, ~2y average lease.
- Zoned schools: Wildwood Elementary School (math 49% / reading 52%, grade D+, #1,055 of 2,144 statewide, top 50%, 940 students, 76% FRL); South Sumter Middle School (math 55% / reading 54%, grade B-, #183 of 571 statewide, top 34%, 897 students, 61% FRL) — zoned schools average 68% FRL vs 51% district-wide (18 pts higher); higher-poverty schools than district average — tighter screening recommended.
- Market conditions: Rents rising (+3.9%/yr); 553 active listings in the ZIP; 9 comparable units currently listed for rent nearby; rentals at typical pace (median 24d on market — plan ~3-4 weeks tenant-placement turnaround); 3,961 units permitted in Sumter County in 2024 (248 in 5+ unit buildings).
- At $2,814/mo this rent would consume 46% of the median local household income ($74k/yr) (locally 987% of renters already pay >50% of income on rent) — very limited rent-growth headroom before tenants either downsize or default.
Forward outlook
- Local home prices are declining (-3.0%/yr); year-one equity from $2k of loan paydown is wiped out by about $10k of value loss. Plan a longer hold.
- Sumter County population projected at +45% by 2050 — long-run rental-demand tailwind backs the buy-and-hold thesis.
Negotiation context
- It's been on market 131 days — a 12% lower offer ($299k) is reasonable based on typical stale-listing flexibility.
- 2 sale attempts since 19y ago; this cycle's ask has dropped $30k (8%) from the opening price — seller is motivated, your offer sets the floor, not the list.
Risks & watch-outs
- Climate carrying-cost: severe wind risk, 99% chance of damaging wind over 30y; extreme-heat days projected 7→23/yr by 2055 (HVAC capex compounding) — expect insurance premiums to compound above CPI over the hold.
Questions for the listing agent
- What do current leases actually rent for vs. the listed asking? Can we see a recent rent roll and the last 12 months of T-12 income?
- It's been on market 131 days. Have you received any prior offers? Is the seller open to a 17% concession, seller financing, or rate buy-down credit?
- What does the HOA fee cover, when was the last increase, and are there any pending special assessments or reserve-fund shortfalls?
- Why hasn't it sold? Are there any deal-killer items the seller is aware of (foundation, flood, title, zoning, code violations)?
- Is there a deadline driving the sale (1031 exchange, divorce, estate, relocation)? That informs how much negotiation room exists.
- Schools are A-rated — typically a magnet for longer-tenancy family renters. What's the average tenant stay here, and is there a school-zone premium baked into asking?
- The area grade is low — what's the realistic commute time and amenity access for the typical tenant pool here? Any planned neighborhood developments (good or bad) we should know about?
- What's the average days-on-market for RENTAL listings here right now (not sales)? A rising rental-DOM trend means longer vacancies and softer asking-rent achievability than the comps imply.
- What's the recent tenant-quality profile in this submarket — average credit score on applications, eviction rate, late-payment / NSF rate, and stable-employment percentage? A property-management company in the area should have these aggregated.
- How much new for-sale + rental construction is in the pipeline within 1–3 miles? Heavy new supply typically softens prices + rents 12–24 months out; constrained supply supports both.
Investment metrics
- 1% rule
- 0.83% ✗
- Cap rate
- 5.55%
- Cash-on-cash
- -2.66%
- DSCR
- 0.88
- GRM
- 10.1
CMA / ARV
- ARV (on-the-fly)
- $360,096
- Comps found
- 12
Show comp detail 12 sales within ~0.75 mi
| Address | Dist | Beds/Ba | Sqft | Sold | Price | $/sf | Match |
|---|---|---|---|---|---|---|---|
| 298 Society Hill Cir | 0.39mi | 3/2.0 | 1,488 (0%) | 2mo | $357,000 | $240 | 80 |
| 454 Bishopville Loop | 0.46mi | 3/2.0 | 1,488 (0%) | 1mo | $360,000 | $242 | 78 |
| 485 Mallory Hill Dr | 0.34mi | 3/2.0 | 1,530 (+3%) | 2mo | $365,000 | $239 | 78 |
| 1697 Jardin Ct | 0.52mi | 3/2.0 | 1,512 (+2%) | 1mo | $394,000 | $261 | 72 |
| 1258 Estill Ave | 0.51mi | 2/2.0 (-1) | 1,505 (+1%) | 2mo | $335,000 | $223 | 68 |
| 497 Little River Path | 0.48mi | 3/2.0 | 1,568 (+5%) | 1mo | $374,714 | $239 | 68 |
| 607 Reevesville Ln | 0.20mi | 3/2.0 | 1,685 (+13%) | 2mo | $400,000 | $237 | 67 |
| 1178 Mcbee Ave | 0.57mi | 3/2.0 | 1,397 (-6%) | 2mo | $399,000 | $286 | 62 |
| 978 Smyrna St | 0.63mi | 3/2.0 | 1,397 (-6%) | 2mo | $342,000 | $245 | 58 |
| 1116 Elizabeth Ct | 0.66mi | 3/2.0 | 1,602 (+8%) | 2mo | $575,000 | $359 | 55 |
| 952 Talapia Loop | 0.72mi | 3/2.0 | 1,711 (+15%) | 1mo | $355,000 | $207 | 40 |
| 1007 Rockville Pl | 0.66mi | 2/2.0 (-1) | 1,278 (-14%) | 2mo | $315,000 | $246 | 39 |
Match score weights: distance 35% · size 25% · config 20% · recency 20%. Top-matched comps best support the ARV.
Projected returns pro-forma
-3.0% appreciation · 3.92% rent growth · sell at horizon
- IRR
- -19.6%
- Equity multiple
- 0.31×
- Total profit
- $-65,817
- Equity at exit
- $50,680
- IRR
- -10.5%
- Equity multiple
- 0.34×
- Total profit
- $-63,272
- Equity at exit
- $29,388
Cash invested: $95,172 (down + closing). Projections, not guarantees.
Landlord ↔ Tenant lean methodology
- Overall (STATE)
- 87 Strongly Landlord-Friendly
- State Florida
- 87 Strongly Landlord-Friendly · R+3
- County
- — inherits STATE
- City
- — inherits STATE
ZIP-level market 32162
- Home prices YoY
- -6.9%
- Rents YoY
- 3.9%
- Active inventory
- 553
- Price-to-rent
- 10.1×
Monthly cashflow live
- Estimated rent
- $2,814 high interval (Pro) →
- Mortgage (P&I)
- −$1,782
- Tax from tax record
- −$311 /mo · $3,732/yr
- Insurance
- −$142
- HOA
- −$199
- Lot rent
- −$0
- Vacancy / Maint / Mgmt
- −$591
- Net cashflow
- $-211
Break-even live
Sensitivity live
| Price | -10% $-19 | -5% $-115 | +0% $-211 | +5% $-308 | +10% $-404 |
|---|---|---|---|---|---|
| Rent | -10% $-434 | -5% $-322 | +0% $-211 | +5% $-100 | +10% $11 |
| Rate | -1.0pp $-40 | -0.5pp $-125 | base $-211 | +0.5pp $-299 | +1.0pp $-389 |
UW: 25.0% down · 7.5% · 30yr · 1.5% tax · 5.0% vac · 8.0% maint · 8.0% mgmt
Financing live
Cash to close
- Down payment
- $84,975
- Closing costs
- $10,197
- Reserves months
- —
- Total cash needed
- —
Loan-product check · same deal, 3 products live
Conventional
25% down · 7.5% · 30yr
- Down + closing
- —
- Monthly P&I
- —
- Monthly cashflow
- —
- DSCR
- —
- Eligible?
- —
Personal DTI + credit; lowest rate.
DSCR
20% down · 8.5% · 30yr
- Down + closing
- —
- Monthly P&I
- —
- Monthly cashflow
- —
- DSCR
- —
- Eligible?
- —
No personal income docs; deal must DSCR.
Hard money
10% down · 12.0% · 12mo
- Down + closing
- —
- Monthly P&I
- —
- Monthly cashflow
- —
- DSCR
- —
- Eligible?
- —
Short-term bridge; refi at stabilization.
Rent comps 9 comps
| Address | Beds | Baths | Sqft | Rent | $/sqft | DOM | Units | Dist |
|---|---|---|---|---|---|---|---|---|
| 1009 Ridgeville Rd The Villages, FL | 2.0 | 2.0 | 1188 | $2,475 | $2.08 | 23d | 1 | 0.67mi |
| 1240 Pageland Way The Villages, FL | 2.0 | 2.0 | 1100 | $2,400 | $2.18 | 23d | 1 | 0.70mi |
| 1315 Fort Lawn Loop The Villages, FL | 2.0 | 2.0 | 1392 | $4,500 | $3.23 | 23d | 1 | 0.77mi |
| 445 Corbett Dr The Villages, FL | 2.0 | 2.0 | 1100 | $2,700 | $2.45 | 23d | 1 | 0.83mi |
| 470 Oboe Way The Villages, FL | 2.0 | 2.0 | 1240 | $2,200 | $1.77 | 23d | 1 | 0.95mi |
| 1220 Turtle Island Rd Lady Lake, FL | 3.0 | 2.0 | 1504 | $2,000 | $1.33 | 26d | 1 | 1.26mi |
| 731 Baisley Trl The Villages, FL | 2.0 | 2.0 | 1512 | $4,500 | $2.98 | 23d | 1 | 1.26mi |
| 10840 NE 89th Dr The Villages, FL | 1.0–3.0 | 1.0–2.0 | 919 | $1,924 | $2.09 | 23d | 21 | 1.27mi |
| 2014 Johnson Ct The Villages, FL | 2.0 | 2.0 | 1156 | $2,000 | $1.73 | 23d | 1 | 1.29mi |
HOA detail
- Monthly dues
- $199 · $2,388/yr
Listing history 25 events
-
2026-06-23days on market $339,900 Active 131 DOM
-
2026-06-22days on market $339,900 Active 130 DOM
-
2026-06-19days on market $339,900 Active 128 DOM
-
2026-06-18days on market $339,900 Active 127 DOM
-
2026-06-17days on market $339,900 Active 126 DOM
-
2026-06-16days on market $339,900 Active 125 DOM
-
2026-06-15days on market $339,900 Active 124 DOM
-
2026-06-14pricedays on market $339,900 Active 122 DOM
-
2026-06-13days on market $349,900 Active 121 DOM
-
2026-06-10days on market $349,900 Active 119 DOM
-
2026-06-09days on market $349,900 Active 118 DOM
-
2026-06-08days on market $349,900 Active 117 DOM
-
2026-06-07days on market $349,900 Active 116 DOM
-
2026-06-02days on market $349,900 Active 111 DOM
-
2026-06-01days on market $349,900 Active 110 DOM
-
2026-05-31days on market $349,900 Active 109 DOM
-
2026-05-30days on market $349,900 Active 108 DOM
-
2026-05-06price $349,900
-
2026-04-23price $354,900
-
2026-02-23price $359,900
-
2026-02-11$369,900 Active
-
2024-12-18soldstatus $380,000
-
2020-12-09soldstatus $289,900
-
2007-07-28historical
-
2007-07-08$269,900
ⓘ Source: listings_history table (triggers on properties + properties_extension) + one-shot
backfill from property_details.listing_events for pre-trigger history.
Tax reassessment forecast FL · Resets to sale price
- Current annual tax
- $3,732 · $311/mo
- Projected year-2 tax
- $3,732 · $311/mo
- Expected delta
- $0/yr ($0/mo · -0.0%)
ⓘ Screening estimate from a state-policy table — verify with the county assessor before closing.
Climate risk First Street
- Flood 1/10 Low FEMA zone X (unshaded) · 0% chance over 30 yrs
- Wildfire 4/10 Moderate
- Heat 9/10 Extreme 7 d/yr ≥108°F today · 23 d/yr by 30 yrs out
- Wind 9/10 Extreme 99% chance of damaging wind over 30 yrs
- Air quality 3/10 Moderate 2 unhealthy d/yr today · 3 by 30 yrs out
Nearby sold comps map
Loading sold comps map…
Walkable amenities ~0.75 mi
Loading nearby amenities…
Taxation est. · year 1
- Rental income
- $33,764
- − Mortgage interest
- −$19,040
- − Property taxes
- −$3,732
- − Insurance
- −$1,700
- − Repairs & maintenance
- −$2,701
- − Management
- −$2,701
- − HOA
- −$2,388
- − Depreciation
- −$9,888
- Taxable loss
- −$8,386
- Est. tax savings @ 24.0%
- +$2,013
- After-tax cash flow
- $-524/yr
For passive investors: Depreciation is non-cash, so a rental often shows a tax loss while cash-flowing — sheltering income. Rental losses are passive: they offset passive income freely, and up to $25,000/yr can offset ordinary (W-2) income if you actively participate and your MAGI is under $100k (phasing out to $0 by $150k); unused losses carry forward. On sale, claimed depreciation is recaptured at up to 25%, and gains may owe capital-gains tax (a 1031 exchange can defer both). Figures are a year-1 estimate at your 24.0% rate — not tax advice; consult a CPA.
Schools (NCES district)
- District
- Sumter
- NCES district ID
- 1201800
- Math proficiency
- 61% ▼ -4.00%
- Reading proficiency
- 61% ▼ -2.00%
- Median HH income
- $48,240
- Composite
- 51.74/100
- National rank
- #1682
- State rank
- #11 of 73 in FL
Livability — The Villages
- Score
- 70/100
- State rank
- #431
- US rank
- #7363
Category grades
Schools grade is shown separately in the Schools card above.
Census & demographics
- Census place
- The Villages, FL
- County
- Sumter County · 110,591 people
- City population
- 83,973
- Metro
- The Villages, FL
- Population (ZIP)
- 55,424
- Household income
- $74,119
- Rent vs Own
- Severe rent burden
- 987.0
Population outlook (Sumter County) Hauer SSP2
- Today (2025)
- 161,172 people
- By 2030
- 180,083 · +11.7%
- By 2040
- 209,892 · +30.2%
- By 2050
- 234,186 · +45.3%
- By 2075
- 284,602 · +76.6%
- By 2100
- 317,039 · +96.7%
Race, ethnicity, and origin ACS 2023
- Neighborhood character
- Predominantly White (95%)
- Race & ethnicity
- White 95% Two or more races 2% Hispanic / Latino 2% Asian 1% Black 1%
- Common ancestry
- Romanian 7% Slovak 4% Lithuanian 4%
- Foreign-born
- 5% · Canada
- Languages at home
- 96% English-only · Spanish 1% Tagalog/Filipino 1%
Political lean MEDSL · Sumter
- 2024 margin
- Solid R (+37.6) · D 30.9% · R 68.6%
- 2008→2024 swing
- -10.6pp toward R · 2008: -27.0pp · 2024: -37.6pp
- All cycles
- 2024: R+37.6 2020: R+36.1 2016: R+39.2 2012: R+34.9 2008: R+27.0
Not yet ingested
- Civics
- —
Market trends
- HPI YoY
- ▼ -16.16%
- Current HPI
- 218.1956
- Rent YoY
- ▲ 3.92%
- Metro
- The Villages, FL
- State GDP YoY
- ▲ 3.28%
- F500 in state
- 36
Industry mix (Fortune 500 HQ in FL)
| Industry | F500 HQs | Revenue |
|---|---|---|
| Industrial Technology | 2 | $29B |
|
||
| Insurance | 2 | $17B |
|
||
| Retail | 1 | $60B |
|
||
| Technology Distribution | 1 | $58B |
|
||
| Homebuilding | 1 | $35B |
|
||
| Technology Manufacturing | 1 | $35B |
|
||
Price history
+29.6% since first listed8 events — show timeline
- 2026-05-06 Price Changed $349,900 Stellar MLS as Distributed by MLS Grid
- 2026-04-23 Price Changed $354,900 Stellar MLS as Distributed by MLS Grid
- 2026-02-23 Price Changed $359,900 Stellar MLS as Distributed by MLS Grid
- 2026-02-11 Listed $369,900 Stellar MLS as Distributed by MLS Grid
- 2024-12-18 Sold (Public Records) $380,000 Public Records
- 2020-12-09 Sold (Public Records) $289,900 Public Records
- 2007-07-28 Listing Removed — Stellar MLS as Distributed by MLS Grid
- 2007-07-08 Listed $269,900 Stellar MLS as Distributed by MLS Grid
Property tax history
+1.5%/yrLatest (2025): $3,732 · +4.6% YoY. Source: county tax records.
Cash-flow waterfall
monthlySold comps — $/sqft
last 12 mo · ≤1 miLoading sold comps…