2500 Kalakaua Ave #201 · Urban Honolulu, HI
Flood risk 6/10 · Moderate
- FEMA flood zone
- X (unshaded)
- Chance of flooding over 30 yrs
- 0.73%
- Est. flood insurance / yr
- $507 – $1,088
Fire risk No data
- Est. fire insurance / yr
- —
Heat risk No data
- Hot days now (above threshold)
- —
- Hot days in 30 yrs
- —
Wind risk No data
- Chance of severe wind over 30 yrs
- —
Air-quality risk 1/10 · Minimal
- Unhealthy air days now
- —
- Unhealthy air days in 30 yrs
- —
Risk factors via First Street. Map © Google.
Why this score? — see what drove the D- grade
The composite is a weighted blend of 9 inputs, each scored 0–100. Each bar is that input's sub-score; the figure is the points it added to the 100-point composite (weight × sub-score).
- 1% rule +9.2/10.0
- ARV discount +7.5/15.0
- Appreciation +6.4/10.0
- Rent growth +4.0/5.0
- Schools +3.7/10.0
- Livability +2.5/5.0
- Condition / age +2.5/5.0
- Cash flow +0.0/30.0
- DSCR +0.0/10.0
$300,000
🖨 Deal sheet (PDF) 📄 Offer letter ✓ Due diligence
Listing remarks
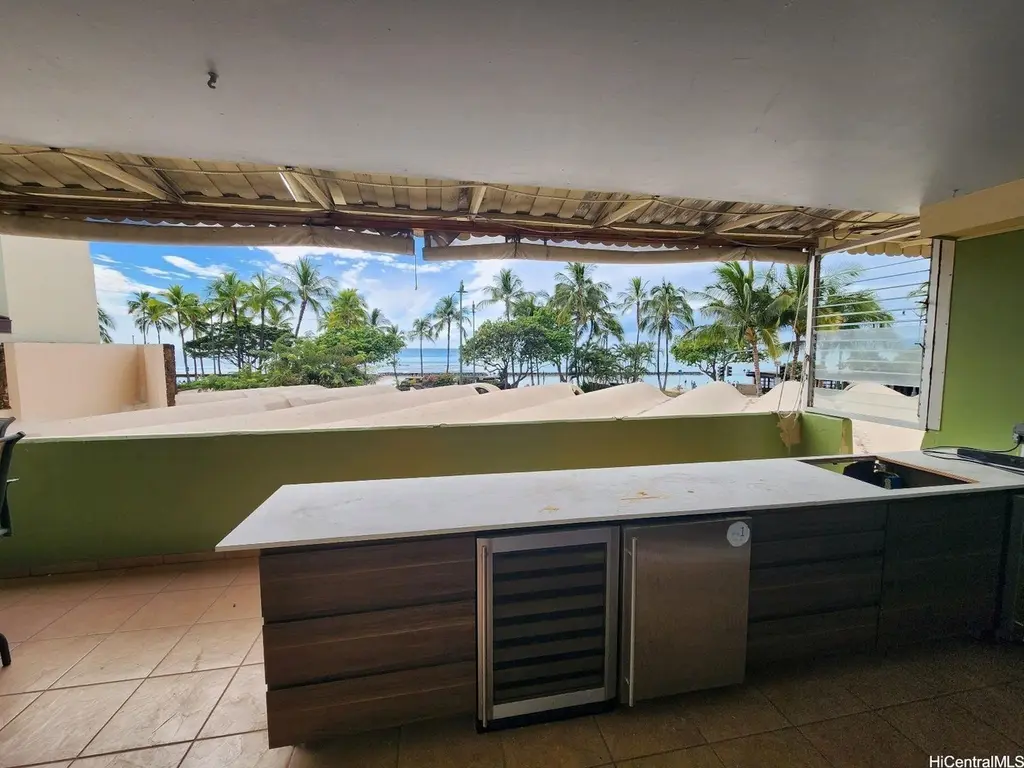
Enjoy the true Waikiki lifestyle experience! This prestigious building is located at the historic 2500 Kalakaua Avenue just steps from the beach. Foster Tower has been an iconic landmark as Waikiki's first condominium high-rise. This large 1,544 sq. ft. second floor corner unit features a large wrap-around patio overlooking the famous Waikiki Beach, new flooring in bedrooms and bathrooms, full kitchen, two full bathrooms, new AC units and ceiling fans. This is perfect for as your vacation or second home. You are walking distance from all of the popular attractions such as the beautiful Waikiki beaches, Diamond Head, Kapiolani Park, International Market Place and many other shops and eaterie
Key facts
- Full kitchen
- Wrap-around patio
- New flooring
Tags
Property features AI
Finance
- Other: Pets allowed — contact management for details
- Financial info: Monthly maintenance expense listed; Lease in place with stated lease amount and expiration
- HOA & community: Association covers common area maintenance, ground and structure maintenance, sewer, cable TV, and internet; On-site management; Community amenities include clubhouse, pool, fitness center, sauna, patio/deck, and trash chute
Exterior
- Parking: Assigned covered parking; Secured parking with guest stalls; One parking space assigned
- Security: Closed-circuit cameras; Secured elevator; Key card entry; Security guard
- Utilities: Sewer service covered by association; Cable and internet included in association
- Home design: Condominium unit in Foster Tower; Entry on level 2; Leasehold land tenure; Resort mixed-use zoning; Built/updated in 2022 (effective year)
- Construction: Concrete construction
- Exterior features: Heated pool; Clubhouse, fitness center, sauna, patio/deck, and pool in the community; Trash chute; Deck/porch
Interior
- Bedrooms: Bedroom located on the main level
- Flooring: Ceramic tile; Hardwood; Vinyl
- Bathrooms: 2 full bathrooms
- Interior features: Partially furnished; End unit with common wall on one side; Bedroom on main level; Full bathroom on main level; Updated/remodeled and in good condition; Has a view
Neighborhood map
What this means for you Summary
Snapshot
- This is a 2-bed/2.0-bath condo listed at $300k.
Deal economics
- At list price, monthly cash flow is $-3k ($-38k/yr) — negative.
- Rent doesn't cover operating costs at any purchase price — skip.
- Meets the 1% rule at list price ($4k rent vs $300k).
- Recommended offer: $291k (3.0% below list) — sets the bar for market timing.
- Cap rate -6.2% vs local median 1.5% in Urban Honolulu — below-typical yield; the buyer is paying a premium for something (appreciation thesis, condition, location) that the cap rate doesn't capture.
Location & tenants
- Location reads: area grade D — affects rentability + tenant quality, not the cash-flow math above.
- Hawaii Department Of Education (suburban): math 32% / reading 50% proficiency, ranked #1 of 1 in HI (top 100%) — families likely to look elsewhere, expect single-tenant / working-renter base with shorter leases.
- Zoned schools: President Thomas Jefferson Elementary School (math 42% / reading 47%, grade F, #73 of 183 statewide, top 41%, 340 students, 55% FRL); President George Washington Middle School (math 30% / reading 46%, grade F, #17 of 42 statewide, top 39%, 569 students, 61% FRL); Kaimuki High School (math 12% / reading 47%, grade F, #35 of 43 statewide, top 86%, 620 students, 60% FRL) — zoned schools average 59% FRL vs 39% district-wide (20 pts higher); higher-poverty schools than district average — tighter screening recommended.
- Market conditions: Rents rising fast (+6.0%/yr); 813 active listings in the ZIP; 40 comparable units currently listed for rent nearby; rentals at typical pace (median 22d on market — plan ~3-4 weeks tenant-placement turnaround); solid renter incomes; 1,638 units permitted in Honolulu County in 2024 (793 in 5+ unit buildings).
Forward outlook
- In year one you build about $10k of equity ($2k loan paydown + $8k appreciation (2.7% local appreciation)).
- Honolulu County population projected at +17% by 2050 — long-run rental-demand tailwind backs the buy-and-hold thesis.
- By year 4, paydown + projected appreciation supports a ~$35k cash-out refi (75% LTV) — recoverable capital for the next deal without selling this one.
Negotiation context
- It's been on market 43 days — a 3% lower offer ($291k) is reasonable based on typical stale-listing flexibility.
- 9 sale attempts since 29y ago with the ask held roughly flat each time — persistent listings suggest the price (not the market) is what's stuck; bring a comps-based counter.
- Current owner paid $199k; list at $300k implies a 51% gain — meaningful room to come down on a strong offer.
Risks & watch-outs
- Watch-outs: HOA is 102% of rent.
- Climate carrying-cost: major flood risk — expect insurance premiums to compound above CPI over the hold.
Questions for the listing agent
- What do current leases actually rent for vs. the listed asking? Can we see a recent rent roll and the last 12 months of T-12 income?
- It's been on market 43 days. Have you received any prior offers? Is the seller open to a 3% concession, seller financing, or rate buy-down credit?
- Built in 1962 — when were the roof, HVAC, electrical panel, plumbing, and water heater last replaced?
- What does the HOA fee cover, when was the last increase, and are there any pending special assessments or reserve-fund shortfalls?
- Any open or pending special assessments — roof, HVAC, plumbing, elevator, façade? What's the per-unit balance and payoff schedule, and is the seller paying it off at close or rolling it to the buyer?
- Is there a deadline driving the sale (1031 exchange, divorce, estate, relocation)? That informs how much negotiation room exists.
- The area grade is low — what's the realistic commute time and amenity access for the typical tenant pool here? Any planned neighborhood developments (good or bad) we should know about?
- What's the average days-on-market for RENTAL listings here right now (not sales)? A rising rental-DOM trend means longer vacancies and softer asking-rent achievability than the comps imply.
- What's the recent tenant-quality profile in this submarket — average credit score on applications, eviction rate, late-payment / NSF rate, and stable-employment percentage? A property-management company in the area should have these aggregated.
- How much new apartment / multifamily construction is in the pipeline within 1–3 miles? Heavy new supply (>2% of stock underway) typically softens rents 12–24 months out; light construction supports rent growth.
Investment metrics
- 1% rule
- 1.42% ✓
- Cap rate
- -6.23%
- Cash-on-cash
- -44.71%
- DSCR
- -0.99
- GRM
- 5.9
CMA / ARV
- ARV (median comp)
- $1,197,392
- List price
- $300,000
- Delta
- -74.95%
- Verdict
- UNDERPRICED
- Comps
- 20 within 1.0 mi
Projected returns pro-forma
2.74% appreciation · 6.0% rent growth · sell at horizon
- IRR
- -30.1%
- Equity multiple
- -0.80×
- Total profit
- $-151,229
- Equity at exit
- $130,571
- IRR
- -15.3%
- Equity multiple
- -1.71×
- Total profit
- $-227,788
- Equity at exit
- $197,927
Cash invested: $84,000 (down + closing). Projections, not guarantees.
Landlord ↔ Tenant lean methodology
- Overall (STATE)
- 37 Tenant-Leaning
- State Hawaii
- 37 Tenant-Leaning · D+13
- County
- — inherits STATE
- City
- — inherits STATE
ZIP-level market 96815
- Home prices YoY
- 0.9%
- Rents YoY
- 6.0%
- Active inventory
- 813
- Price-to-rent
- 5.9×
Monthly cashflow live
- Estimated rent
- $4,265 high interval (Pro) →
- Mortgage (P&I)
- −$1,573
- Tax from tax record
- −$460 /mo · $5,526/yr
- Insurance
- −$125
- HOA
- −$4,341
- Vacancy / Maint / Mgmt
- −$896
- Net cashflow
- $-3,130
Break-even live
Sensitivity live
| Price | -10% $-2,960 | -5% $-3,045 | +0% $-3,130 | +5% $-3,215 | +10% $-3,300 |
|---|---|---|---|---|---|
| Rent | -10% $-3,467 | -5% $-3,298 | +0% $-3,130 | +5% $-2,962 | +10% $-2,793 |
| Rate | -1.0pp $-2,979 | -0.5pp $-3,054 | base $-3,130 | +0.5pp $-3,208 | +1.0pp $-3,287 |
UW: 25.0% down · 7.5% · 30yr · 1.5% tax · 5.0% vac · 8.0% maint · 8.0% mgmt
Financing live
Cash to close
- Down payment
- $75,000
- Closing costs
- $9,000
- Reserves months
- —
- Total cash needed
- —
Loan-product check · same deal, 3 products live
Conventional
25% down · 7.5% · 30yr
- Down + closing
- —
- Monthly P&I
- —
- Monthly cashflow
- —
- DSCR
- —
- Eligible?
- —
Personal DTI + credit; lowest rate.
DSCR
20% down · 8.5% · 30yr
- Down + closing
- —
- Monthly P&I
- —
- Monthly cashflow
- —
- DSCR
- —
- Eligible?
- —
No personal income docs; deal must DSCR.
Hard money
10% down · 12.0% · 12mo
- Down + closing
- —
- Monthly P&I
- —
- Monthly cashflow
- —
- DSCR
- —
- Eligible?
- —
Short-term bridge; refi at stabilization.
Rent comps 40 comps
| Address | Beds | Baths | Sqft | Rent | $/sqft | DOM | Units | Dist |
|---|---|---|---|---|---|---|---|---|
| 250 Ohua Ave Honolulu, HI | 2.0 | 2.0 | 1067 | $4,200 | $3.94 | 45d | 1 | 0.24mi |
| 303 Liliuokalani Ave Honolulu, HI | 2.0 | 1.5–2.0 | 1096 | $2,995 | $2.73 | 45d | 2 | 0.26mi |
| 311 Ohua Ave Ph 4 Honolulu, HI | 3.0 | 2.5 | 1886 | $5,200 | $2.76 | 16d | 1 | 0.28mi |
| 2380 Kuhio Ave Honolulu, HI | 3.0 | 1.0–3.0 | 1212 | $10,275 | $8.47 | 3d | 51 | 0.29mi |
| 2215 Aloha Dr Unit DH1205 Honolulu, HI | 2.0 | 2.0 | 1128 | $3,500 | $3.10 | 45d | 1 | 0.58mi |
| 223 Saratoga Rd Honolulu, HI | 1.0–3.0 | 1.0–3.5 | 1417 | $8,200 | $5.78 | 45d | 4 | 0.64mi |
| 430 Kaiolu St #1101 Honolulu, HI | 2.0 | 2.0 | 1575 | $3,900 | $2.48 | 45d | 1 | 0.68mi |
| 3123 Esther St Honolulu, HI | 3.0 | 2.0 | 1500 | $3,850 | $2.57 | 25d | 1 | 0.68mi |
| 2121 Ala Wai Blvd Honolulu, HI | 2.0 | 1.0–3.0 | 1006 | $4,200 | $4.17 | 23d | 2 | 0.71mi |
| 2121 Ala Wai Blvd Honolulu, HI | 2.0 | 1.0–3.0 | 1006 | $4,150 | $4.12 | 5d | 2 | 0.71mi |
| 2121 Ala Wai Blvd Honolulu, HI | 2.0 | 1.0–3.0 | 1006 | $4,400 | $4.37 | 12d | 1 | 0.71mi |
| 2895 Kalakaua Ave Honolulu, HI | 1.0–2.0 | 1.0–2.0 | 852 | $13,000 | $15.25 | 4d | 4 | 0.82mi |
| 2895 Kalakaua Ave Honolulu, HI | 1.0–2.0 | 1.0–2.0 | 852 | $13,000 | $15.25 | 19d | 5 | 0.82mi |
| 3153 Kaunaoa St Honolulu, HI | 3.0 | 1.5 | 1156 | $4,000 | $3.46 | 45d | 1 | 0.84mi |
| 581 Kamoku St #2006 Honolulu, HI | 3.0 | 2.0 | 1187 | $4,100 | $3.45 | 45d | 1 | 0.85mi |
| 500 University Ave Honolulu, HI | 2.0 | 2.5 | 1120 | $3,150 | $2.81 | 12d | 2 | 0.90mi |
| 500 University Ave Honolulu, HI | 1.0–2.0 | 1.0–2.5 | 826 | $3,200 | $3.87 | 13d | 3 | 0.90mi |
| 2943 Kalakaua Ave Honolulu, HI | 2.0 | 2.0 | 1129 | $6,100 | $5.40 | 25d | 1 | 0.92mi |
| 2979 Kalakaua Ave Honolulu, HI | 1.0–2.0 | 1.0–2.0 | 1361 | $9,500 | $6.98 | 45d | 3 | 1.00mi |
| 1910 Ala Moana Blvd Honolulu, HI | 2.0 | 2.0 | 1238 | $4,975 | $4.02 | 5d | 2 | 1.07mi |
| 1860 Ala Moana Blvd #1809 Honolulu, HI | 2.0 | 2.0 | 1180 | $3,800 | $3.22 | 45d | 1 | 1.09mi |
| 1860 Ala Moana Blvd Unit 902B Honolulu, HI | 2.0 | 2.0 | 1171 | $3,100 | $2.65 | 25d | 1 | 1.09mi |
| 2724 Kahoaloha Ln Honolulu, HI | 2.0 | 2.0 | 939 | $2,998 | $3.19 | 25d | 2 | 1.11mi |
| 469 Ena Rd Honolulu, HI | 2.0–3.0 | 2.0–3.0 | 1098 | $2,990 | $2.72 | 5d | 4 | 1.11mi |
| 469 Ena Rd #1501 Honolulu, HI | 3.0 | 3.0 | 1249 | $4,000 | $3.20 | 45d | 1 | 1.11mi |
| 469 Ena Rd Honolulu, HI | 2.0–3.0 | 2.0–3.0 | 1098 | $3,000 | $2.73 | 19d | 3 | 1.11mi |
| 1888 Kalakaua Ave Honolulu, HI | 2.0–3.0 | 2.0–3.0 | 2176 | $6,500 | $2.99 | 5d | 2 | 1.12mi |
| 1837 Kalakaua Ave Honolulu, HI | 2.0 | 2.0 | 1004 | $4,850 | $4.83 | 5d | 3 | 1.14mi |
| 1837 Kalakaua Ave Unit 28032803 Honolulu, HI | 2.0 | 2.0 | 1145 | $5,500 | $4.80 | 25d | 1 | 1.14mi |
| 3065 Kalakaua Ave #8 Honolulu, HI | 2.0 | 2.0 | 1228 | $10,000 | $8.14 | 16d | 1 | 1.15mi |
| 3065 Kalakaua Ave Honolulu, HI | 2.0 | 2.0 | 1947 | $10,000 | $5.14 | 25d | 1 | 1.15mi |
| 3340 Kaimuki Ave Honolulu, HI | 3.0 | 1.0 | 1290 | $4,000 | $3.10 | 5d | 1 | 1.17mi |
| 343 Hobron Ln Honolulu, HI | 2.0 | 2.0–2.5 | 1365 | $4,800 | $3.52 | 16d | 2 | 1.20mi |
| 343 Hobron Ln Honolulu, HI | 2.0 | 2.0–2.5 | 1301 | $4,575 | $3.52 | 45d | 2 | 1.20mi |
| 343 Hobron Ln Honolulu, HI | 1.0–2.0 | 1.5–2.5 | 1220 | $5,750 | $4.71 | 25d | 4 | 1.20mi |
| 343 Hobron Ln Honolulu, HI | 1.0–2.0 | 1.5–2.5 | 1220 | $5,750 | $4.71 | 21d | 4 | 1.20mi |
| 343 Hobron Ln Honolulu, HI | 2.0 | 2.0–2.5 | 1282 | $4,825 | $3.76 | 18d | 2 | 1.20mi |
| 343 Hobron Ln #2604 Honolulu, HI | 2.0 | 2.5 | 1650 | $5,750 | $3.48 | 5d | 1 | 1.20mi |
| 1717 Ala Wai Blvd Honolulu, HI | 2.0–3.0 | 2.0 | 1026 | $2,750 | $2.68 | 5d | 2 | 1.21mi |
| 1104 4th Ave Unit A Honolulu, HI | 3.0 | 2.0 | 1692 | $4,500 | $2.66 | 19d | 1 | 1.27mi |
HOA detail condo
- Monthly dues
- $4,341 · $52,092/yr
- Assessments
- None detected in remarks — confirm with the listing agent.
Listing history 49 events
-
2026-06-21days on market $300,000 Active 43 DOM
-
2026-06-18days on market $300,000 Active 40 DOM
-
2026-06-17days on market $300,000 Active 39 DOM
-
2026-06-16days on market $300,000 Active 38 DOM
-
2026-06-15days on market $300,000 Active 37 DOM
-
2026-06-13days on market $300,000 Active 35 DOM
-
2026-06-13days on market $300,000 Active 34 DOM
-
2026-06-10days on market $300,000 Active 32 DOM
-
2026-06-09days on market $300,000 Active 31 DOM
-
2026-06-08days on market $300,000 Active 30 DOM
-
2026-06-07days on market $300,000 Active 29 DOM
-
2026-06-05days on market $300,000 Active 26 DOM
-
2026-06-03days on market $300,000 Active 25 DOM
-
2026-06-02days on market $300,000 Active 24 DOM
-
2026-06-01days on market $300,000 Active 23 DOM
-
2026-05-31days on market $300,000 Active 22 DOM
-
2026-05-09$300,000 Active 855-char remark
-
2026-05-04historical
-
2025-09-25price $350,000
-
2025-05-05$395,000 Active
-
2023-06-15historical
-
2023-04-13price $400,000
-
2023-03-30price $450,000
-
2023-03-06historical
-
2023-02-16price $550,000
-
2023-02-02$650,000 Active
-
2023-02-02$550,000 Active
-
2022-06-01$450,000 Active
-
2021-07-06soldstatus $199,000 Sold
-
2021-04-19status Pending
-
2021-01-20$199,000 Active
-
2021-01-19historical
-
2020-11-22price $259,000
-
2020-08-03price $299,000
-
2020-07-03price $339,000
-
2020-06-25price $375,000
-
2020-06-01$399,000 Active
-
2020-05-12historical
-
2020-02-26price $695,000
-
2020-02-08price $899,000
-
2019-07-05$949,000 Active
-
2002-09-04soldstatus $1,435,000
-
1997-12-31soldstatus $210,000
-
1997-12-31soldstatus $210,000
-
1997-12-09historical
-
1997-08-26$330,000
-
1989-08-01soldstatus $1,000,000
-
1981-04-01soldstatus $310,000
-
1981-03-01soldstatus $310,000
ⓘ Source: listings_history table (triggers on properties + properties_extension) + one-shot
backfill from property_details.listing_events for pre-trigger history.
Tax reassessment forecast HI · Partial reset (capped growth)
- Current annual tax
- $5,526 · $460/mo
- Projected year-2 tax
- $5,526 · $460/mo
- Expected delta
- $0/yr ($0/mo · 0.0%)
ⓘ Screening estimate from a state-policy table — verify with the county assessor before closing.
Climate risk First Street
- Flood 6/10 Major FEMA zone X (unshaded) · 73% chance over 30 yrs
- Air quality 1/10 Low
Nearby sold comps map
Loading sold comps map…
Walkable amenities ~0.75 mi
Loading nearby amenities…
Taxation est. · year 1
- Rental income
- $51,185
- − Mortgage interest
- −$16,805
- − Property taxes
- −$5,526
- − Insurance
- −$1,500
- − Repairs & maintenance
- −$4,095
- − Management
- −$4,095
- − HOA
- −$52,092
- − Depreciation
- −$8,727
- Taxable loss
- −$41,654
- Est. tax savings @ 24.0%
- +$9,997
- After-tax cash flow
- $-27,563/yr
For passive investors: Depreciation is non-cash, so a rental often shows a tax loss while cash-flowing — sheltering income. Rental losses are passive: they offset passive income freely, and up to $25,000/yr can offset ordinary (W-2) income if you actively participate and your MAGI is under $100k (phasing out to $0 by $150k); unused losses carry forward. On sale, claimed depreciation is recaptured at up to 25%, and gains may owe capital-gains tax (a 1031 exchange can defer both). Figures are a year-1 estimate at your 24.0% rate — not tax advice; consult a CPA.
Schools (NCES district)
- District
- Hawaii Department Of Education
- NCES district ID
- 1500030
- Math proficiency
- 32% ▼ -10.00%
- Reading proficiency
- 50% ▼ -3.00%
- Median HH income
- $69,005
- Composite
- 37.07/100
- National rank
- #4504
- State rank
- #1 of 1 in HI
Livability — Urban Honolulu
No livability data for this city. (Only ~50 U.S. cities are tracked.)
Census & demographics
- Census place
- Urban Honolulu, HI
- County
- Honolulu County · 963,448 people
- City population
- 309,956
- Metro
- Urban Honolulu, HI
- Population (ZIP)
- 27,530
- Household income
- $77,096
- Rent vs Own
- Severe rent burden
- 2422.0
Population outlook (Honolulu County) Hauer SSP2
- Today (2025)
- 1,072,641 people
- By 2030
- 1,110,460 · +3.5%
- By 2040
- 1,181,593 · +10.2%
- By 2050
- 1,257,584 · +17.2%
- By 2075
- 1,501,120 · +39.9%
- By 2100
- 1,764,430 · +64.5%
Race, ethnicity, and origin ACS 2023
- Neighborhood character
- Highly diverse neighborhood (Simpson 0.71)
- Race & ethnicity
- Asian 41% White 35% Two or more races 16% Hispanic / Latino 6% Pacific Islander 4% Black 2%
- Hispanic origin (detail)
- Mexican 3% Puerto Rican 1%
- Common ancestry
- Romanian 2% Lithuanian 2% Slovak 2%
- Foreign-born
- 30% · China, South Korea, Canada
- Languages at home
- 66% English-only · Other Asian/Pacific 15% Chinese 5% Korean 3%
Political lean MEDSL · Honolulu
- 2024 margin
- Strong D (+21.6) · D 59.9% · R 38.3% · Other 1.8%
- 2008→2024 swing
- -19.4pp toward R · 2008: 41.1pp · 2024: 21.6pp
- All cycles
- 2024: D+21.6 2020: D+26.9 2016: D+29.9 2012: D+39.1 2008: D+41.1
Not yet ingested
- Civics
- —
Market trends
- HPI YoY
- ▲ 2.74%
- Current HPI
- 291.9404
- Rent YoY
- ▲ 6.00%
- Metro
- Urban Honolulu, HI
- State GDP YoY
- —
- F500 in state
- 0
Price history
-3.2% since first listed33 events — show timeline
- 2026-05-09 Listed $300,000 HiCentral MLS
- 2026-05-04 Listing Removed — HiCentral MLS
- 2025-09-25 Price Changed $350,000 HiCentral MLS
- 2025-05-05 Listed $395,000 HiCentral MLS
- 2023-06-15 Listing Removed — HiCentral MLS
- 2023-04-13 Price Changed $400,000 HiCentral MLS
- 2023-03-30 Price Changed $450,000 HiCentral MLS
- 2023-03-06 Listing Removed — HiCentral MLS
- 2023-02-16 Price Changed $550,000 HiCentral MLS
- 2023-02-02 Listed $550,000 HiCentral MLS
- 2023-02-02 Listed $650,000 HiCentral MLS
- 2022-06-01 Listed $450,000 HiCentral MLS
- 2021-07-06 Sold (MLS) $199,000 HiCentral MLS
- 2021-04-19 Pending — HiCentral MLS
- 2021-01-20 Listed $199,000 HiCentral MLS
- 2021-01-19 Listing Removed — HiCentral MLS
- 2020-11-22 Price Changed $259,000 HiCentral MLS
- 2020-08-03 Price Changed $299,000 HiCentral MLS
- 2020-07-03 Price Changed $339,000 HiCentral MLS
- 2020-06-25 Price Changed $375,000 HiCentral MLS
- 2020-06-01 Listed $399,000 HiCentral MLS
- 2020-05-12 Listing Removed — HiCentral MLS
- 2020-02-26 Price Changed $695,000 HiCentral MLS
- 2020-02-08 Price Changed $899,000 HiCentral MLS
- 2019-07-05 Listed $949,000 HiCentral MLS
- 2002-09-04 Sold (Public Records) $1,435,000 Public Records
- 1997-12-31 Sold (Public Records) $210,000 Public Records
- 1997-12-31 Sold (MLS) $210,000 HiCentral MLS
- 1997-12-09 Listing Removed — HiCentral MLS
- 1997-08-26 Listed $330,000 HiCentral MLS
- 1989-08-01 Sold (Public Records) $1,000,000 Public Records
- 1981-04-01 Sold (Public Records) $310,000 Public Records
- 1981-03-01 Sold (Public Records) $310,000 Public Records
Property tax history
+7.0%/yrLatest (2022): $5,526 · -52.3% YoY. Source: county tax records.
Cash-flow waterfall
monthlySold comps — $/sqft
last 12 mo · ≤1 miLoading sold comps…