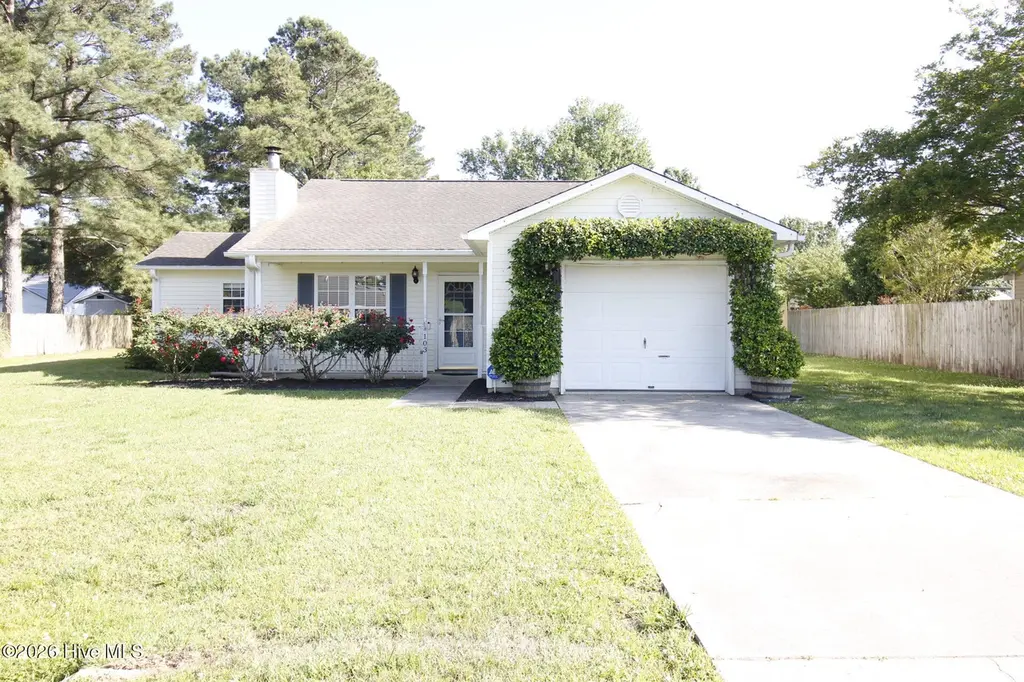
103 Quarterhorse Ln · Piney Green, NC
Flood risk 1/10 · Minimal
- FEMA flood zone
- X (unshaded)
- Chance of flooding over 30 yrs
- 0.0%
- Est. flood insurance / yr
- $507 – $1,088
Fire risk 5/10 · Moderate
- Est. fire insurance / yr
- $906 – $1,684
Heat risk 8/10 · Major
- Hot days now (above 106°F)
- 7 days/yr
- Hot days in 30 yrs
- 19 days/yr
Wind risk 8/10 · Major
- Chance of severe wind over 30 yrs
- 99.0%
Air-quality risk 2/10 · Minimal
- Unhealthy air days now
- 1 days/yr
- Unhealthy air days in 30 yrs
- 3 days/yr
Risk factors via First Street. Map © Google.
Why this score? — see what drove the D grade
The composite is a weighted blend of 9 inputs, each scored 0–100. Each bar is that input's sub-score; the figure is the points it added to the 100-point composite (weight × sub-score).
- Cash flow +12.2/30.0
- ARV discount +9.9/15.0
- Schools +3.9/10.0
- DSCR +3.6/10.0
- Rent growth +3.5/5.0
- Livability +3.0/5.0
- Condition / age +2.5/5.0
- 1% rule +2.4/10.0
- Appreciation +0.0/10.0
$260,000
🖨 Deal sheet (PDF) 📄 Offer letter ✓ Due diligence
Listing remarks MLS
This tranquil 4 bedroom, 2 full bath, 1 car garage home is a dream come true! The home features a large living room with a wood burning fireplace that would be perfect on cold winter nights. Home has a big storage shed out back for storage or a work shop. Step out back to a patio that would be perfect for grilling!
Key facts
- Spacious backyard
- Storage shed
- Fire pit
Tags
Property features AI
Exterior
- Parking: Attached garage (1-car); Paved parking; Total 1 parking space
- Utilities: Public water; Sewer connected; Water connected
- Home design: Single family residence; One-level / single-story; Entry level: 1st floor; Located in a cul-de-sac
- Construction: Vinyl siding with frame construction; Shingle roof; Slab foundation; Built on one level
- Exterior features: Covered front porch; Shed(s); Has a view
Interior
- Kitchen: Electric oven; Cooktop; Dishwasher
- Bedrooms: Total rooms: 8
- Flooring: Carpet
- Bathrooms: 2 full bathrooms
- Heating & cooling: Heat pump; Fireplace(s); Electric heating; Cooling via heat pump
- Interior features: Ceiling fans
- Laundry & utility: Washer hookup; Electric water heater
Neighborhood map
What this means for you Summary
Snapshot
- This is a 3-bed/2.0-bath single-family listed at $260k.
Deal economics
- At list price, monthly cash flow is $-53 ($-635/yr) — negative.
- To cash-flow at today's rent, offer at most $251k (3.6% below list).
- To meet the 1% rule (rent ≥ 1% of price), the offer needs to be $191k (26.4% below list).
- Recommended offer: $191k (26.4% below list) — sets the bar for 1% rule.
- Cap rate 6.0% vs local median 3.6% in Piney Green — top-decile yield for the area; either an underpriced asset or a hidden risk that comps aren't pricing in. Stress-test before assuming the spread holds.
Location & tenants
- Location reads 60/100 on livability (#524 in NC) — a middle-class / working-renter tenant base. Strengths: cost of living A+, housing A+; Watch: crime D+, employment D+, amenities F.
- Onslow County Schools (other): math 42% / reading 49% proficiency, ranked #84 of 178 in NC (top 47%) — families likely to look elsewhere, expect single-tenant / working-renter base with shorter leases.
- Zoned schools: Heritage Elementary School (math 45% / reading 47%, grade D-, #551 of 1,410 statewide, top 40%, 541 students, 53% FRL); Hunters Creek Middle (math 32% / reading 44%, grade F, #251 of 475 statewide, top 54%, 922 students, 55% FRL); White Oak High (math 57% / reading 54%, grade C, #265 of 535 statewide, top 50%, 1,207 students, 49% FRL) — zoned schools average 52% FRL vs 37% district-wide (15 pts higher); higher-poverty schools than district average — tighter screening recommended.
- Market conditions: Rents rising (+3.9%/yr); 612 active listings in the ZIP; 2 comparable units currently listed for rent nearby; 1,246 units permitted in Onslow County in 2024 (0 in 5+ unit buildings).
- This rent runs 36% of the median local income ($64k/yr) — at the standard rent-burdened threshold; future hikes will face affordability resistance.
Forward outlook
- Local home prices are declining (-3.0%/yr); year-one equity from $2k of loan paydown is wiped out by about $8k of value loss. Plan a longer hold.
Negotiation context
- It's been on market 43 days — a 3% lower offer ($252k) is reasonable based on typical stale-listing flexibility.
- 3 sale attempts since 7y ago with the ask held roughly flat each time — persistent listings suggest the price (not the market) is what's stuck; bring a comps-based counter.
- Current owner paid $197k; 32% above their basis — modest negotiation headroom, anchor on the comps not their cost.
Risks & watch-outs
- Climate carrying-cost: severe wind risk, 99% chance of damaging wind over 30y; moderate wildfire risk; extreme-heat days projected 7→19/yr by 2055 (HVAC capex compounding) — expect insurance premiums to compound above CPI over the hold.
Questions for the listing agent
- What do current leases actually rent for vs. the listed asking? Can we see a recent rent roll and the last 12 months of T-12 income?
- It's been on market 43 days. Have you received any prior offers? Is the seller open to a 26% concession, seller financing, or rate buy-down credit?
- Is there a deadline driving the sale (1031 exchange, divorce, estate, relocation)? That informs how much negotiation room exists.
- Schools are F-rated, which usually means shorter tenancies and higher turnover. Who's the typical renter profile here, and what's been the actual vacancy rate?
- Crime grade is D in this area — have there been break-ins, vandalism, or insurance claims at this property in the last 3 years? What carrier currently insures it and at what premium?
- The area grade is low — what's the realistic commute time and amenity access for the typical tenant pool here? Any planned neighborhood developments (good or bad) we should know about?
- What's the average days-on-market for RENTAL listings here right now (not sales)? A rising rental-DOM trend means longer vacancies and softer asking-rent achievability than the comps imply.
- What's the recent tenant-quality profile in this submarket — average credit score on applications, eviction rate, late-payment / NSF rate, and stable-employment percentage? A property-management company in the area should have these aggregated.
- How much new for-sale + rental construction is in the pipeline within 1–3 miles? Heavy new supply typically softens prices + rents 12–24 months out; constrained supply supports both.
Investment metrics
- 1% rule
- 0.74% ✗
- Cap rate
- 6.05%
- Cash-on-cash
- -0.87%
- DSCR
- 0.96
- GRM
- 11.3
CMA / ARV
- ARV (on-the-fly)
- $274,329
- Comps found
- 12
Show comp detail 12 sales within ~0.75 mi
| Address | Dist | Beds/Ba | Sqft | Sold | Price | $/sf | Match |
|---|---|---|---|---|---|---|---|
| 308 Running Rd | 0.21mi | 4/2.0 (+1) | 1,461 (-0%) | 1mo | $255,000 | $175 | 84 |
| 207 Chaparral Trl | 0.18mi | 4/2.0 (+1) | 1,426 (-3%) | 2mo | $220,000 | $154 | 81 |
| 342 Palamino Trl | 0.26mi | 4/2.0 (+1) | 1,538 (+5%) | 1mo | $269,900 | $175 | 74 |
| 300 Brookstone Way | 0.35mi | 4/2.0 (+1) | 1,416 (-4%) | 1mo | $245,000 | $173 | 72 |
| 103 Lariat Ln | 0.30mi | 4/2.0 (+1) | 1,538 (+5%) | 2mo | $265,000 | $172 | 71 |
| 413 Stones Throw Ct | 0.67mi | 3/2.0 | 1,463 (-0%) | 2mo | $296,000 | $202 | 66 |
| 113 Sparkling Brook Way | 0.33mi | 3/2.0 | 1,630 (+11%) | 1mo | $310,000 | $190 | 65 |
| 108 Stony Brook Way | 0.68mi | 3/2.0 | 1,514 (+3%) | 3mo | $299,000 | $197 | 60 |
| 295 Brookstone Way | 0.43mi | 4/2.0 (+1) | 1,582 (+8%) | 4mo | $296,000 | $187 | 59 |
| 106 S S. Sea St | 0.74mi | 3/2.0 | 1,555 (+6%) | 1mo | $305,000 | $196 | 55 |
| 106 Cobalt Stream Ct | 0.55mi | 4/2.0 (+1) | 1,600 (+9%) | 3mo | $281,500 | $176 | 52 |
| 117 Heavens Gate Dr | 0.74mi | 3/2.0 | 1,304 (-11%) | 2mo | $257,400 | $197 | 45 |
Match score weights: distance 35% · size 25% · config 20% · recency 20%. Top-matched comps best support the ARV.
Projected returns pro-forma
-3.0% appreciation · 3.86% rent growth · sell at horizon
- IRR
- -17.0%
- Equity multiple
- 0.40×
- Total profit
- $-43,943
- Equity at exit
- $38,767
- IRR
- -7.6%
- Equity multiple
- 0.50×
- Total profit
- $-36,089
- Equity at exit
- $22,480
Cash invested: $72,800 (down + closing). Projections, not guarantees.
Landlord ↔ Tenant lean methodology
- Overall (STATE)
- 85 Strongly Landlord-Friendly
- State North Carolina
- 85 Strongly Landlord-Friendly · R+3
- County
- — inherits STATE
- City
- — inherits STATE
ZIP-level market 28546
- Home prices YoY
- -19.3%
- Rents YoY
- 3.9%
- Active inventory
- 612
- Price-to-rent
- 11.3×
Monthly cashflow live
- Estimated rent
- $1,914 medium interval (Pro) →
- Mortgage (P&I)
- −$1,363
- Tax from tax record
- −$93 /mo · $1,117/yr
- Insurance
- −$108
- HOA
- −$0
- Vacancy / Maint / Mgmt
- −$402
- Net cashflow
- $-53
Break-even live
Sensitivity live
| Price | -10% $94 | -5% $21 | +0% $-53 | +5% $-126 | +10% $-200 |
|---|---|---|---|---|---|
| Rent | -10% $-204 | -5% $-128 | +0% $-53 | +5% $23 | +10% $98 |
| Rate | -1.0pp $78 | -0.5pp $13 | base $-53 | +0.5pp $-120 | +1.0pp $-189 |
UW: 25.0% down · 7.5% · 30yr · 1.5% tax · 5.0% vac · 8.0% maint · 8.0% mgmt
Financing live
Cash to close
- Down payment
- $65,000
- Closing costs
- $7,800
- Reserves months
- —
- Total cash needed
- —
Loan-product check · same deal, 3 products live
Conventional
25% down · 7.5% · 30yr
- Down + closing
- —
- Monthly P&I
- —
- Monthly cashflow
- —
- DSCR
- —
- Eligible?
- —
Personal DTI + credit; lowest rate.
DSCR
20% down · 8.5% · 30yr
- Down + closing
- —
- Monthly P&I
- —
- Monthly cashflow
- —
- DSCR
- —
- Eligible?
- —
No personal income docs; deal must DSCR.
Hard money
10% down · 12.0% · 12mo
- Down + closing
- —
- Monthly P&I
- —
- Monthly cashflow
- —
- DSCR
- —
- Eligible?
- —
Short-term bridge; refi at stabilization.
Rent comps 2 comps
| Address | Beds | Baths | Sqft | Rent | $/sqft | DOM | Units | Dist |
|---|---|---|---|---|---|---|---|---|
| 108 White Stone Ct Jacksonville, NC | 4.0 | 2.0 | 1460 | $2,150 | $1.47 | 23d | 1 | 0.73mi |
| 303 Elk Ct Jacksonville, NC | 3.0 | 2.5 | 1716 | $2,000 | $1.17 | 15d | 1 | 1.41mi |
Listing history 15 events
-
2026-06-07statusdays on market $260,000 Pending 43 DOM
-
2026-06-03days on market $260,000 Active 40 DOM
-
2026-06-02days on market $260,000 Active 39 DOM
-
2026-06-01days on market $260,000 Active 38 DOM
-
2026-05-31days on market $260,000 Active 37 DOM
-
2026-05-30days on market $260,000 Active 36 DOM
-
2026-04-24$260,000 Active
-
2022-04-07soldstatus $197,000 Closed 316-char remark
Show marketing remark (316 chars)
This tranquil 4 bedroom, 2 full bath, 1 car garage home is a dream come true! The home features a large living room with a wood burning fireplace that would be perfect on cold winter nights. Home has a big storage shed out back for storage or a work shop. Step out back to a patio that would be perfect for grilling!
-
2022-04-07soldstatus $197,000
Show marketing remark (316 chars)
This tranquil 4 bedroom, 2 full bath, 1 car garage home is a dream come true! The home features a large living room with a wood burning fireplace that would be perfect on cold winter nights. Home has a big storage shed out back for storage or a work shop. Step out back to a patio that would be perfect for grilling!
-
2022-01-20historical 316-char remark
Show marketing remark (316 chars)
This tranquil 4 bedroom, 2 full bath, 1 car garage home is a dream come true! The home features a large living room with a wood burning fireplace that would be perfect on cold winter nights. Home has a big storage shed out back for storage or a work shop. Step out back to a patio that would be perfect for grilling!
-
2022-01-19$197,000 316-char remark
Show marketing remark (316 chars)
This tranquil 4 bedroom, 2 full bath, 1 car garage home is a dream come true! The home features a large living room with a wood burning fireplace that would be perfect on cold winter nights. Home has a big storage shed out back for storage or a work shop. Step out back to a patio that would be perfect for grilling!
-
2019-09-19historical
-
2019-06-25$160,948
-
2010-04-30soldstatus $159,000
-
2005-03-11soldstatus $107,000
ⓘ Source: listings_history table (triggers on properties + properties_extension) + one-shot
backfill from property_details.listing_events for pre-trigger history.
Tax reassessment forecast NC · Resets to sale price
- Current annual tax
- $1,117 · $93/mo
- Projected year-2 tax
- $2,132 · $178/mo
- Expected delta
- +$1,015/yr (+$85/mo · 90.9%)
ⓘ Screening estimate from a state-policy table — verify with the county assessor before closing.
Climate risk First Street
- Flood 1/10 Low FEMA zone X (unshaded) · 0% chance over 30 yrs
- Wildfire 5/10 Major
- Heat 8/10 Severe 7 d/yr ≥106°F today · 19 d/yr by 30 yrs out
- Wind 8/10 Severe 99% chance of damaging wind over 30 yrs
- Air quality 2/10 Low 1 unhealthy d/yr today · 3 by 30 yrs out
Nearby sold comps map
Loading sold comps map…
Walkable amenities ~0.75 mi
Loading nearby amenities…
Taxation est. · year 1
- Rental income
- $22,967
- − Mortgage interest
- −$14,564
- − Property taxes
- −$1,117
- − Insurance
- −$1,300
- − Repairs & maintenance
- −$1,837
- − Management
- −$1,837
- − Depreciation
- −$7,564
- Taxable loss
- −$5,252
- Est. tax savings @ 24.0%
- +$1,261
- After-tax cash flow
- $626/yr
For passive investors: Depreciation is non-cash, so a rental often shows a tax loss while cash-flowing — sheltering income. Rental losses are passive: they offset passive income freely, and up to $25,000/yr can offset ordinary (W-2) income if you actively participate and your MAGI is under $100k (phasing out to $0 by $150k); unused losses carry forward. On sale, claimed depreciation is recaptured at up to 25%, and gains may owe capital-gains tax (a 1031 exchange can defer both). Figures are a year-1 estimate at your 24.0% rate — not tax advice; consult a CPA.
Schools (NCES district)
- District
- Onslow County Schools
- NCES district ID
- 3703450
- Math proficiency
- 42% ▲ 6.00%
- Reading proficiency
- 49% ▲ 5.00%
- Median HH income
- $46,076
- Composite
- 38.66/100
- National rank
- #4148
- State rank
- #84 of 178 in NC
Livability — Piney Green
- Score
- 60/100
- State rank
- #524
- US rank
- #19401
Category grades
Schools grade is shown separately in the Schools card above.
Census & demographics
- Census place
- Piney Green, NC
- County
- Onslow County · 164,453 people
- Metro
- Jacksonville, NC
- Population (ZIP)
- 47,256
- Household income
- $63,561
- Rent vs Own
- Severe rent burden
- 1830.0
Population outlook (Onslow County) Hauer SSP2
- Today (2025)
- 189,789 people
- By 2030
- 194,463 · +2.5%
- By 2040
- 193,629 · +2.0%
- By 2050
- 193,248 · +1.8%
- By 2075
- 196,995 · +3.8%
- By 2100
- 201,513 · +6.2%
Race, ethnicity, and origin ACS 2023
- Neighborhood character
- Diverse neighborhood (Simpson 0.62)
- Race & ethnicity
- White 57% Black 18% Hispanic / Latino 16% Two or more races 13% Asian 2%
- Hispanic origin (detail)
- Mexican 5% Puerto Rican 5% Dominican 1%
- Common ancestry
- Romanian 1% Serbian 1% Slovak 1%
- Foreign-born
- 5% · Canada, South Korea
- Languages at home
- 89% English-only · Spanish 8% German/W. Germanic 1% Tagalog/Filipino 1%
Political lean MEDSL · Onslow
- 2024 margin
- Solid R (+35.9) · D 31.5% · R 67.5% · Other 1.0%
- 2008→2024 swing
- -14.5pp toward R · 2008: -21.5pp · 2024: -35.9pp
- All cycles
- 2024: R+35.9 2020: R+30.2 2016: R+34.6 2012: R+27.0 2008: R+21.5
Not yet ingested
- Civics
- —
Market trends
- HPI YoY
- ▼ -50.75%
- Current HPI
- 211.9993
- Rent YoY
- ▲ 3.86%
- Metro
- Jacksonville, NC
- State GDP YoY
- ▲ 3.28%
- F500 in state
- 26
Industry mix (Fortune 500 HQ in NC)
| Industry | F500 HQs | Revenue |
|---|---|---|
| Financial Services | 2 | $213B |
|
||
| Retail | 2 | $95B |
|
||
| Industrial Conglomerate | 1 | $38B |
|
||
| Metals / Steel | 1 | $35B |
|
||
| Utilities | 1 | $30B |
|
||
| Industrial Machinery | 1 | $19B |
|
||
Price history
+143.0% since first listed9 events — show timeline
- 2026-04-24 Listed $260,000 Hive MLS
- 2022-04-07 Sold (Public Records) $197,000 Public Records
- 2022-04-07 Sold (MLS) $197,000 Hive MLS
- 2022-01-20 Listing Removed — Hive MLS
- 2022-01-19 Listed $197,000 Hive MLS
- 2019-09-19 Listing Removed — Hive MLS
- 2019-06-25 Listed $160,948 Hive MLS
- 2010-04-30 Sold (Public Records) $159,000 Public Records
- 2005-03-11 Sold (Public Records) $107,000 Public Records
Property tax history
+1.7%/yrLatest (2025): $1,117 · +0.0% YoY. Source: county tax records.
Cash-flow waterfall
monthlySold comps — $/sqft
last 12 mo · ≤1 miLoading sold comps…