 🏷️ Likely Rental
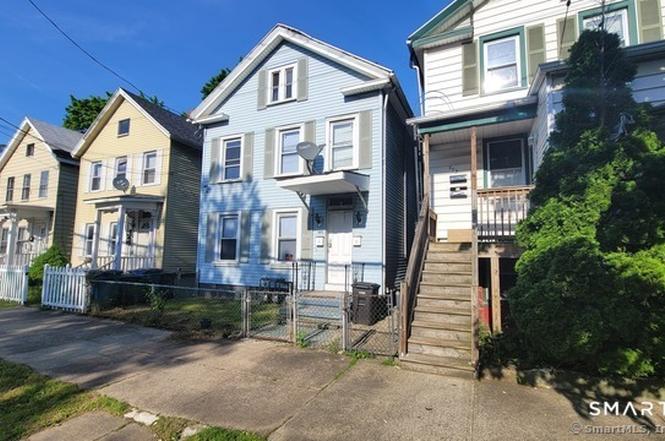
495 East St · New Haven, CT
Flood risk 1/10 · Minimal
- FEMA flood zone
- X (unshaded)
- Chance of flooding over 30 yrs
- 0.0%
- Est. flood insurance / yr
- $473 – $860
Fire risk 1/10 · Minimal
- Est. fire insurance / yr
- $829 – $1,539
Heat risk 7/10 · Major
- Hot days now (above 99°F)
- 7 days/yr
- Hot days in 30 yrs
- 16 days/yr
Wind risk 6/10 · Moderate
- Chance of severe wind over 30 yrs
- 61.0%
Air-quality risk 5/10 · Moderate
- Unhealthy air days now
- 6 days/yr
- Unhealthy air days in 30 yrs
- 8 days/yr
Risk factors via First Street. Map © Google.
Why this score? — see what drove the D grade
The composite is a weighted blend of 9 inputs, each scored 0–100. Each bar is that input's sub-score; the figure is the points it added to the 100-point composite (weight × sub-score).
- Cash flow +15.0/30.0
- ARV discount +7.5/15.0
- 1% rule +5.0/10.0
- DSCR +5.0/10.0
- Livability +4.0/5.0
- Rent growth +3.2/5.0
- Condition / age +2.5/5.0
- Schools +1.5/10.0
- Appreciation +0.0/10.0
$1,800
🖨 Deal sheet 📄 Offer letter ✓ Due diligence
Multi-family units
County records classify this as Multi-Family (2-4 Unit). Listing-text estimate: 1 unit. estimate disagrees with records
Listing remarks MLS
Situated in the Mill River Neighborhood directly across from Jocelyn Square Park - 2 Family consisting of 1512 sq ft [ 2 - 2 bedroom 1 bath Apartments = 756 sq ft each] ; 2nd Floor - Electric Service Upgrade in 2018 - Rent Range w/in 1/2 mile $1,400 - $1,800 for similar sized units - Good upside potential Property offered in As Is Condition - Inspections are for information purposes only.
Key facts
- New tile flooring
- Jocelyn square park
- Gas oven stove
Tags
Property features AI
Exterior
- Utilities: Public water connected; Public sewer connected; Natural gas domestic hot water
- Home design: Multi-family (2-family); Multi-family for sale
- Construction: Frame construction; Block foundation; Asphalt shingle roof
- Exterior features: Level lot; Vinyl siding
Interior
- Bedrooms: 2 bedrooms
- Bathrooms: 1 full bathroom
- Heating & cooling: Hot air heating; Natural gas heat
- Interior features: Full basement; 4 total rooms
Neighborhood map
What this means for you Summary
Snapshot
- This is a 4-bed/2.0-bath multifamily listed at $2k.
Deal economics
- At list price, monthly cash flow is $3k ($31k/yr) — positive.
- The deal already cash-flows at list — no discount required.
- Meets the 1% rule at list price ($3k rent vs $2k).
- Cap rate 1724.7% vs local median 4.8% in New Haven — top-decile yield for the area; either an underpriced asset or a hidden risk that comps aren't pricing in. Stress-test before assuming the spread holds.
Location & tenants
- Location reads 79/100 on livability (#31 in CT, #2,190 nationally) — a middle-class / working-renter tenant base. Strengths: amenities A+, commute A+, health & safety A+; Watch: schools D+, employment D, crime F.
- New Haven School District (urban): math 12% / reading 25% proficiency, ranked #147 of 153 in CT (top 96%) — low school quality limits family demand, transient renter base, plan for 1-2y turnover; 66% free/reduced lunch — lower-income household profile, screen leases tightly.
- Market conditions: Rents rising (+2.6%/yr); 137 active listings in the ZIP; 40 comparable units currently listed for rent nearby; rentals lingering (median 44d on market — plan ~5-8 weeks vacancy on turnover, expect pricing pressure); 50% of comp listings sitting > 30 days — soft ceiling on asking rent; 1,059 units permitted in South Central Connecticut Planning Region in 2024 (779 in 5+ unit buildings).
- At $3,279/mo this rent would consume 66% of the median local household income ($60k/yr) (locally 4999% of renters already pay >50% of income on rent) — very limited rent-growth headroom before tenants either downsize or default.
Forward outlook
- Local home prices are declining (-3.0%/yr); year-one equity from $12 of loan paydown is wiped out by about $54 of value loss. Plan a longer hold.
- At projected returns (-3.0% appreciation + 2.6% rent growth), your $504 cash investment doubles in ~1 year — after that, you're playing with house money.
Negotiation context
- Only 2 days on market — expect competitive offers; lowballing is unlikely to land.
- 6 sale attempts since 19y ago with the ask held roughly flat each time — persistent listings suggest the price (not the market) is what's stuck; bring a comps-based counter.
Risks & watch-outs
- Watch-outs: built in 1900 — expect roof / HVAC / electrical / plumbing capex.
- Climate carrying-cost: major wind risk, 61% chance of damaging wind over 30y; extreme-heat days projected 7→16/yr by 2055 (HVAC capex compounding) — expect insurance premiums to compound above CPI over the hold.
Questions for the listing agent
- Built in 1900 — when were the roof, HVAC, electrical panel, plumbing, and water heater last replaced?
- Is there a deadline driving the sale (1031 exchange, divorce, estate, relocation)? That informs how much negotiation room exists.
- Schools are D-rated, which usually means shorter tenancies and higher turnover. Who's the typical renter profile here, and what's been the actual vacancy rate?
- Crime grade is F in this area — have there been break-ins, vandalism, or insurance claims at this property in the last 3 years? What carrier currently insures it and at what premium?
- The area grade is low — what's the realistic commute time and amenity access for the typical tenant pool here? Any planned neighborhood developments (good or bad) we should know about?
- What's the average days-on-market for RENTAL listings here right now (not sales)? A rising rental-DOM trend means longer vacancies and softer asking-rent achievability than the comps imply.
- What's the recent tenant-quality profile in this submarket — average credit score on applications, eviction rate, late-payment / NSF rate, and stable-employment percentage? A property-management company in the area should have these aggregated.
- How much new apartment / multifamily construction is in the pipeline within 1–3 miles? Heavy new supply (>2% of stock underway) typically softens rents 12–24 months out; light construction supports rent growth.
Investment metrics
- 1% rule
- 182.14% ✓
- Cap rate
- 1724.69%
- Cash-on-cash
- 6137.14%
- DSCR
- 274.07
- GRM
- 0.0
CMA / ARV
- ARV (on-the-fly)
- $281,232
- Comps found
- 9
Show comp detail 9 sales within ~0.75 mi
| Address | Dist | Beds/Ba | Sqft | Sold | Price | $/sf | Match |
|---|---|---|---|---|---|---|---|
| 159 Humphrey St | 0.06mi | 4/2.0 | 1,568 (+4%) | 13mo | $200,000 | $128 | 80 |
| 38 Walnut St | 0.07mi | 4/2.0 | 1,330 (-12%) | 2mo | $345,000 | $259 | 75 |
| 387 Blatchley Ave | 0.47mi | 4/2.0 | 1,516 (+0%) | 4mo | $300,000 | $198 | 74 |
| 249 Wallace St | 0.10mi | 5/2.0 (+1) | 1,515 (+0%) | 19mo | $300,000 | $198 | 74 |
| 354 Blatchley Ave | 0.46mi | 4/2.0 | 1,536 (+2%) | 5mo | $280,000 | $182 | 72 |
| 17 Walnut St | 0.03mi | 4/2.5 | 1,628 (+8%) | 20mo | $270,000 | $166 | 67 |
| 263 James St | 0.37mi | 5/2.0 (+1) | 1,560 (+3%) | 22mo | $290,000 | $186 | 55 |
| 308 Poplar St | 0.62mi | 4/2.0 | 1,386 (-8%) | 4mo | $310,000 | $224 | 54 |
| 187 Saltonstall Ave | 0.67mi | 3/2.0 (-1) | 1,596 (+6%) | 4mo | $285,000 | $179 | 51 |
Match score weights: distance 35% · size 25% · config 20% · recency 20%. Top-matched comps best support the ARV.
Projected returns pro-forma
-3.0% appreciation · 2.6% rent growth · sell at horizon
- IRR
- —
- Equity multiple
- 323.64×
- Total profit
- $162,612
- Equity at exit
- $268
- IRR
- —
- Equity multiple
- 691.17×
- Total profit
- $347,844
- Equity at exit
- $156
Cash invested: $504 (down + closing). Projections, not guarantees.
Landlord ↔ Tenant lean methodology
- Overall (STATE)
- 27 Tenant-Leaning
- State Connecticut
- 27 Tenant-Leaning · D+7
- County
- — inherits STATE
- City
- — inherits STATE
ZIP-level market 06511
- Home prices YoY
- -20.8%
- Rents YoY
- 2.6%
- Active inventory
- 137
Monthly cashflow live
- Estimated rent
- $3,279 high interval (Pro) →
- Mortgage (P&I)
- −$9
- Tax est. 1.5%
- −$2 /mo · $27/yr
- Insurance
- −$1
- HOA
- −$0
- Vacancy / Maint / Mgmt
- −$688
- Net cashflow
- $2,578
Break-even live
UW: 25.0% down · 7.5% · 30yr · 1.5% tax · 5.0% vac · 8.0% maint · 8.0% mgmt
Financing live
Cash to close
- Down payment
- $450
- Closing costs
- $54
- Reserves months
- —
- Total cash needed
- —
Loan-product check · same deal, 3 products live
Conventional
25% down · 7.5% · 30yr
- Down + closing
- —
- Monthly P&I
- —
- Monthly cashflow
- —
- DSCR
- —
- Eligible?
- —
Personal DTI + credit; lowest rate.
DSCR
20% down · 8.5% · 30yr
- Down + closing
- —
- Monthly P&I
- —
- Monthly cashflow
- —
- DSCR
- —
- Eligible?
- —
No personal income docs; deal must DSCR.
Hard money
10% down · 12.0% · 12mo
- Down + closing
- —
- Monthly P&I
- —
- Monthly cashflow
- —
- DSCR
- —
- Eligible?
- —
Short-term bridge; refi at stabilization.
Rent comps 40 comps
| Address | Beds | Baths | Sqft | Rent | $/sqft | DOM | Units | Dist |
|---|---|---|---|---|---|---|---|---|
| 902 State St #2 New Haven, CT | 3.0 | 2.5 | 1950 | $3,750 | $1.92 | 23d | 1 | 0.18mi |
| 28 Edwards St Unit 2 New Haven, CT | 4.0 | 2.0 | 1800 | $3,850 | $2.14 | 14d | 1 | 0.23mi |
| 47 Edwards St Unit 2 New Haven, CT | 3.0 | 1.0 | 1170 | $2,200 | $1.88 | 43d | 1 | 0.27mi |
| 31 Clark St New Haven, CT | 4.0 | 2.0 | 1694 | $4,200 | $2.48 | 3d | 1 | 0.27mi |
| 1050 State St New Haven, CT | 3.0 | 1.0–2.0 | 919 | $4,854 | $5.28 | 2d | 21 | 0.28mi |
| 59 Clark St New Haven, CT | 4.0 | 1.0 | 1541 | $3,250 | $2.11 | 23d | 1 | 0.33mi |
| 86 Edwards St Unit 1 New Haven, CT | 4.0 | 2.0 | 1080 | $4,500 | $4.17 | 43d | 1 | 0.33mi |
| 54 Mechanic St Unit 2nd floor New Haven, CT | 4.0 | 2.0 | 1412 | $3,600 | $2.55 | 43d | 1 | 0.33mi |
| 60 Mechanic St Unit 2 New Haven, CT | 4.0 | 2.0 | 1050 | $3,195 | $3.04 | 43d | 1 | 0.34mi |
| 74 Mechanic St Unit 1L New Haven, CT | 3.0 | 1.0 | 1100 | $2,095 | $1.90 | 14d | 1 | 0.37mi |
| 106 Lawrence St Unit 1 New Haven, CT | 3.0 | 1.0 | 1200 | $3,295 | $2.75 | 43d | 1 | 0.39mi |
| 28 Eld St New Haven, CT | 3.0 | 1.0 | 1100 | $3,500 | $3.18 | 3d | 1 | 0.41mi |
| 20 Maltby Pl New Haven, CT | 3.0 | 1.0 | 1100 | $1,900 | $1.73 | 3d | 1 | 0.43mi |
| 262 Lloyd St Unit 1 New Haven, CT | 3.0 | 2.0 | 1460 | $2,400 | $1.64 | 3d | 1 | 0.47mi |
| 506 Orange St Unit 2 New Haven, CT | 3.0 | 1.5 | 1553 | $3,600 | $2.32 | 43d | 1 | 0.48mi |
| 48 Lyon St Unit 1 New Haven, CT | 3.0 | 1.0 | 1402 | $2,950 | $2.10 | 19d | 1 | 0.50mi |
| 426 Poplar St New Haven, CT | 3.0 | 1.0 | 1658 | $1,800 | $1.09 | 43d | 1 | 0.55mi |
| 426 Poplar St Unit 2 New Haven, CT | 4.0 | 2.0 | 1405 | $1,800 | $1.28 | 2d | 1 | 0.55mi |
| 342 Exchange St Unit 2 New Haven, CT | 3.0 | 2.0 | 1200 | $2,300 | $1.92 | 43d | 1 | 0.55mi |
| 399 Orange St New Haven, CT | 4.0 | 1.5 | 1650 | $3,200 | $1.94 | 11d | 1 | 0.56mi |
| 239 Bradley St Unit 2 New Haven, CT | 3.0 | 1.0 | 1384 | $3,500 | $2.53 | 43d | 1 | 0.56mi |
| 239 Bradley St Unit 1 New Haven, CT | 3.0 | 1.0 | 1982 | $3,650 | $1.84 | 43d | 1 | 0.56mi |
| 751 Orange St Unit 1ST New Haven, CT | 3.0 | 1.0 | 1344 | $3,200 | $2.38 | 43d | 1 | 0.56mi |
| 751 Orange St Unit 2nd floor New Haven, CT | 3.0 | 1.0 | 1090 | $3,000 | $2.75 | 43d | 1 | 0.56mi |
| 395 Orange St Unit 2 New Haven, CT | 4.0 | 1.5 | 1650 | $3,000 | $1.82 | 43d | 1 | 0.56mi |
| 239 Saint John St Unit 2 New Haven, CT | 3.0 | 2.0 | 1350 | $3,295 | $2.44 | 43d | 1 | 0.58mi |
| 367 Orange St New Haven, CT | 3.0 | 1.0–2.0 | 1075 | $4,973 | $4.63 | 2d | 43 | 0.59mi |
| 302 Exchange St Unit 2 New Haven, CT | 5.0 | 2.0 | 1800 | $2,500 | $1.39 | 43d | 1 | 0.60mi |
| 54 Trumbull St Unit 54-1 New Haven, CT | 5.0 | 2.5 | 2250 | $6,695 | $2.98 | 14d | 1 | 0.61mi |
| 245 Edwards St New Haven, CT | 3.0 | 1.0 | 1300 | $2,200 | $1.69 | 43d | 1 | 0.63mi |
| 67 Trumbull St New Haven, CT | 4.0 | 1.0 | 1400 | $3,200 | $2.29 | 11d | 1 | 0.64mi |
| 251 Edwards St Unit 2 New Haven, CT | 4.0 | 1.5 | 1522 | $3,900 | $2.56 | 3d | 1 | 0.64mi |
| 441 Chapel St Unit 2A1 (shared) New Haven, CT | 4.0 | 4.0 | 2151 | $3,600 | $1.67 | 2d | 1 | 0.65mi |
| 250 Willow St #3 New Haven, CT | 4.0 | 2.0 | 1234 | $3,600 | $2.92 | 3d | 1 | 0.66mi |
| 483 Ferry St #1 New Haven, CT | 4.0 | 1.0 | 1100 | $2,310 | $2.10 | 43d | 1 | 0.66mi |
| 253 Lawrence St Unit 3 New Haven, CT | 3.0 | 2.0 | 1300 | $3,000 | $2.31 | 43d | 1 | 0.68mi |
| 641 Ferry St New Haven, CT | 4.0 | 1.0 | 1200 | $2,100 | $1.75 | 43d | 1 | 0.68mi |
| 18 Woolsey St New Haven, CT | 5.0 | 2.0 | 1446 | $2,900 | $2.01 | 11d | 1 | 0.68mi |
| 68 Anderson St Unit A New Haven, CT | 3.0 | 2.5 | 1693 | $4,500 | $2.66 | 43d | 1 | 0.72mi |
| 114 Canner St Unit 1 New Haven, CT | 3.0 | 1.5 | 1382 | $3,750 | $2.71 | 23d | 1 | 0.72mi |
Listing history 3 events
-
2026-06-18days on market $1,800 Active 2 DOM
-
2026-06-17remarks 367-char remark
-
2026-06-17$1,800 Active 1 DOM
ⓘ Source: listings_history table (triggers on properties + properties_extension) + one-shot
backfill from property_details.listing_events for pre-trigger history.
Climate risk First Street
- Flood 1/10 Low FEMA zone X (unshaded) · 0% chance over 30 yrs
- Wildfire 1/10 Low
- Heat 7/10 Severe 7 d/yr ≥99°F today · 16 d/yr by 30 yrs out
- Wind 6/10 Major 61% chance of damaging wind over 30 yrs
- Air quality 5/10 Major 6 unhealthy d/yr today · 8 by 30 yrs out
Nearby sold comps map
Loading sold comps map…
Walkable amenities ~0.75 mi
Loading nearby amenities…
Taxation est. · year 1
- Rental income
- $39,342
- − Mortgage interest
- −$101
- − Property taxes
- −$27
- − Insurance
- −$9
- − Repairs & maintenance
- −$3,147
- − Management
- −$3,147
- − Depreciation
- −$52
- Taxable income
- $32,858
- Est. tax owed @ 24.0%
- −$7,886
- After-tax cash flow
- $23,045/yr
For passive investors: Depreciation is non-cash, so a rental often shows a tax loss while cash-flowing — sheltering income. Rental losses are passive: they offset passive income freely, and up to $25,000/yr can offset ordinary (W-2) income if you actively participate and your MAGI is under $100k (phasing out to $0 by $150k); unused losses carry forward. On sale, claimed depreciation is recaptured at up to 25%, and gains may owe capital-gains tax (a 1031 exchange can defer both). Figures are a year-1 estimate at your 24.0% rate — not tax advice; consult a CPA.
Schools (NCES district)
- District
- New Haven School District
- NCES district ID
- 0902790
- Math proficiency
- 12% ▼ -10.00%
- Reading proficiency
- 25% ▼ -10.00%
- Median HH income
- $38,058
- Composite
- 15.48/100
- National rank
- #9308
- State rank
- #147 of 153 in CT
Livability — New Haven
- Score
- 79/100
- State rank
- #31
- US rank
- #2190
Category grades
Schools grade is shown separately in the Schools card above.
Census & demographics
- Census place
- New Haven, CT
- County
- New Haven County · 688,236 people
- City population
- 132,813
- Metro
- New Haven-Milford, CT
- Population (ZIP)
- 54,730
- Household income
- $59,969
- Rent vs Own
- Severe rent burden
- 4999.0
Population outlook (South Central Connecticut County) Hauer SSP2
- By 2040
- 608,362
Race, ethnicity, and origin ACS 2023
- Neighborhood character
- Highly diverse neighborhood (Simpson 0.73)
- Race & ethnicity
- Black 34% White 32% Hispanic / Latino 21% Two or more races 8% Asian 7%
- Hispanic origin (detail)
- Mexican 4% Puerto Rican 10% Dominican 2%
- Common ancestry
- Romanian 2% Lithuanian 1% Russian 1%
- Foreign-born
- 17% · Canada, China, South Korea
- Languages at home
- 74% English-only · Spanish 15% Chinese 3% Other Indo-European 2%
Political lean MEDSL · South Central Connecticut
- 2024 margin
- Strong D (+20.1) · D 59.0% · R 38.9% · Other 2.1%
- All cycles
- 2024: D+20.1
Not yet ingested
- Civics
- —
Market trends
- HPI YoY
- ▼ -86.05%
- Current HPI
- 328.1353
- Rent YoY
- ▲ 2.60%
- Metro
- New Haven-Milford, CT
- State GDP YoY
- ▲ 1.06%
- F500 in state
- 38
Industry mix (Fortune 500 HQ in CT)
| Industry | F500 HQs | Revenue |
|---|---|---|
| Industrial Machinery | 4 | $38B |
|
||
| Insurance | 3 | $71B |
|
||
| Financial Services | 2 | $25B |
|
||
| Transportation / Logistics | 2 | $18B |
|
||
| Healthcare | 1 | $247B |
|
||
| Telecommunications | 1 | $55B |
|
||
Price history
-91.4% since first listed13 events — show timeline
- 2026-06-16 Listed $1,800 Smart MLS
- 2024-03-15 Sold (MLS) $282,000 Smart MLS
- 2024-01-22 Pending — Smart MLS
- 2023-11-18 Relisted — Smart MLS
- 2023-09-07 Contingent — Smart MLS
- 2023-07-10 Relisted — Smart MLS
- 2023-06-29 Contingent — Smart MLS
- 2023-05-22 Listed $280,000 Smart MLS
- 2014-12-08 Sold (MLS) $92,000 Smart MLS
- 2014-04-04 Listed $69,900 Smart MLS
- 2008-03-31 Listing Removed — Smart MLS
- 2007-12-19 Listed $185,900 Smart MLS
- 1997-09-16 Sold (Public Records) $21,000 Public Records
Property tax history
+6.2%/yrLatest (2023): $4,364 · -6.4% YoY. Source: county tax records.
Cash-flow waterfall
monthlySold comps — $/sqft
last 12 mo · ≤1 miLoading sold comps…