 6-Plex
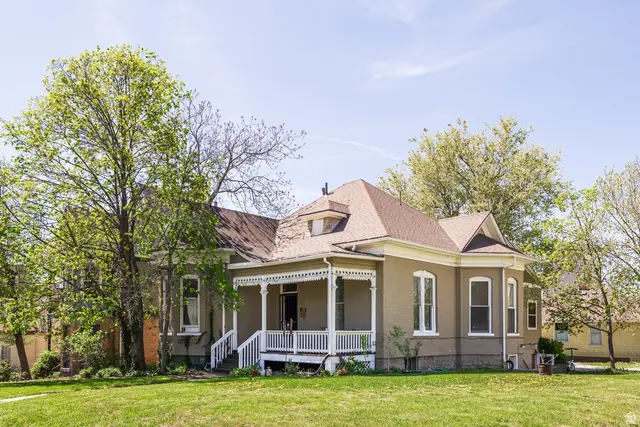
135 B St · Salt Lake City, UT
Flood risk 1/10 · Minimal
- FEMA flood zone
- X (unshaded)
- Chance of flooding over 30 yrs
- 0.0%
- Est. flood insurance / yr
- $507 – $1,088
Fire risk 6/10 · Moderate
- Est. fire insurance / yr
- $453 – $841
Heat risk 4/10 · Minor
- Hot days now (above 94°F)
- 7 days/yr
- Hot days in 30 yrs
- 18 days/yr
Wind risk 1/10 · Minimal
- Chance of severe wind over 30 yrs
- —
Air-quality risk 4/10 · Minor
- Unhealthy air days now
- 5 days/yr
- Unhealthy air days in 30 yrs
- 7 days/yr
Risk factors via First Street. Map © Google.
Why this score? — see what drove the B- grade
The composite is a weighted blend of 9 inputs, each scored 0–100. Each bar is that input's sub-score; the figure is the points it added to the 100-point composite (weight × sub-score).
- Cash flow +30.0/30.0
- 1% rule +10.0/10.0
- DSCR +10.0/10.0
- ARV discount +7.5/15.0
- Livability +3.8/5.0
- Rent growth +2.9/5.0
- Schools +2.9/10.0
- Condition / age +2.5/5.0
- Appreciation +0.0/10.0
$865,000
🖨 Deal sheet (PDF) 📄 Offer letter ✓ Due diligence
Multi-family units
County records classify this as Multi-Family (5+ Unit). Listing-text estimate: 6 units. confirmed
5+ unit building — per-unit beds/baths from public records are typically unavailable; the breakdown below (if shown) is an estimate from the listing text.
Listing remarks
This sixplex multi-family property is located in Salt Lake's highly desirable Avenues neighborhood, positioned on a prominent corner lot with convenient access to downtown, the University of Utah, area parks, dining, and the region's extensive trail systems. The property is currently configured as six different conforming units within a single structure, consisting primarily of studio and one-bedroom layouts. The asset offers immediate income with continued demand driven by its exceptional location. The structure itself is in original condition and will require significant updating, presenting a clear opportunity for a future owner to renovate, reposition, or evaluate alternative long-term
Key facts
- Avenues neighborhood
- Mature landscaping
- Corner lot
Tags
Property features AI
Finance
- Other: Zoned RMF-35 (Multi-Family)
- Financial info: Six total units; Unit-level rents: $800, $800, $550, $950, $650, $1,000 (individual unit sizes vary)
- HOA & community: Located in the AVENUES subdivision
Exterior
- Parking: Uncovered open parking
- Utilities: Natural gas connected; Electricity connected; Public sewer connected; Water (culinary) connected
- Home design: Single-story building; Multi-family property; Residential use; View: Mountain
- Construction: Built in 1989; Brick construction; Asphalt roof; Property built and standing
- Exterior features: Open porch; Open patio; Corner lot; Curb and gutter; Paved road; Sidewalks; Automatic full sprinklers; Mountain view; Partial landscaping; Mature trees; Flat terrain
Interior
- Kitchen: Range; Built-in dishwasher
- Bedrooms: Multiple 1-bedroom units (individual unit counts listed under Units)
- Flooring: Carpet; Tile; Vinyl
- Bathrooms: Multiple 1-bath units (individual unit counts listed under Units)
- Heating & cooling: Forced air heating
- Interior features: Basement apartment; Range with countertop; Free-standing range/oven; Built-in dishwasher; Blinds; Window coverings
- Laundry & utility: Electric dryer hookup
Neighborhood map
What this means for you Summary
Snapshot
- This is a 6 × 3-bed/4.0-bath units multifamily listed at $865k.
Deal economics
- At list price, monthly cash flow is $6k ($75k/yr) — positive. Per door: $1k/mo.
- The deal already cash-flows at list — no discount required.
- Meets the 1% rule at list price ($14k rent vs $865k).
- Recommended offer: $813k (6.0% below list) — sets the bar for market timing.
Location & tenants
- Location reads 75/100 on livability (#64 in UT, #3,994 nationally) — a middle-class / working-renter tenant base. Strengths: amenities A+, commute A+, housing A; Watch: cost of living D+, crime F.
- Salt Lake District (urban): math 30% / reading 37% proficiency, ranked #65 of 80 in UT (top 81%) — families likely to look elsewhere, expect single-tenant / working-renter base with shorter leases.
- Zoned schools: Washington School (math 22% / reading 32%, grade F, #454 of 585 statewide, top 79%, 267 students, 48% FRL); Salt Lake Center For Science Education Bryant (math 14% / reading 29%, grade F, #125 of 138 statewide, top 91%, 407 students, 64% FRL); West High (math 33% / reading 60%, grade D-, #38 of 171 statewide, top 24%, 2,600 students, 51% FRL) — zoned schools at 54% FRL track the district average.
- Market conditions: Rents rising (+1.6%/yr); 207 active listings in the ZIP; solid renter incomes; 4,970 units permitted in Salt Lake County in 2024 (1,963 in 5+ unit buildings).
- At $14,472/mo this rent would consume 207% of the median local household income ($84k/yr) (locally 1273% of renters already pay >50% of income on rent) — very limited rent-growth headroom before tenants either downsize or default.
Forward outlook
- Local home prices are declining (-3.0%/yr); year-one equity from $6k of loan paydown is wiped out by about $26k of value loss. Plan a longer hold.
- Salt Lake County population projected at +37% by 2050 — long-run rental-demand tailwind backs the buy-and-hold thesis.
- At projected returns (-3.0% appreciation + 1.6% rent growth), your $242k cash investment doubles in ~5 years — after that, you're playing with house money.
Negotiation context
- It's been on market 73 days — a 6% lower offer ($813k) is reasonable based on typical stale-listing flexibility.
Risks & watch-outs
- Watch-outs: built in 1899 — expect roof / HVAC / electrical / plumbing capex.
- Climate carrying-cost: major wildfire risk — expect insurance premiums to compound above CPI over the hold.
Questions for the listing agent
- It's been on market 73 days. Have you received any prior offers? Is the seller open to a 6% concession, seller financing, or rate buy-down credit?
- Can we see the unit-by-unit rent roll, current vacancy, and any below-market leases? What's the average tenancy length?
- What capital expenditures (roof, boiler, parking lot, exteriors) have been made in the last 5 years, and what's planned in the next 2?
- Built in 1899 — when were the roof, HVAC, electrical panel, plumbing, and water heater last replaced?
- Why hasn't it sold? Are there any deal-killer items the seller is aware of (foundation, flood, title, zoning, code violations)?
- Is there a deadline driving the sale (1031 exchange, divorce, estate, relocation)? That informs how much negotiation room exists.
- Crime grade is F in this area — have there been break-ins, vandalism, or insurance claims at this property in the last 3 years? What carrier currently insures it and at what premium?
- What's the average days-on-market for RENTAL listings here right now (not sales)? A rising rental-DOM trend means longer vacancies and softer asking-rent achievability than the comps imply.
- What's the recent tenant-quality profile in this submarket — average credit score on applications, eviction rate, late-payment / NSF rate, and stable-employment percentage? A property-management company in the area should have these aggregated.
- How much new apartment / multifamily construction is in the pipeline within 1–3 miles? Heavy new supply (>2% of stock underway) typically softens rents 12–24 months out; light construction supports rent growth.
Investment metrics
- 1% rule
- 1.67% ✓
- Cap rate
- 14.91%
- Cash-on-cash
- 30.76%
- DSCR
- 2.37
- GRM
- 5.0
CMA / ARV
No comps found within radius.
Projected returns pro-forma
-3.0% appreciation · 1.57% rent growth · sell at horizon
- IRR
- 23.9%
- Equity multiple
- 1.97×
- Total profit
- $234,478
- Equity at exit
- $128,974
- IRR
- 30.9%
- Equity multiple
- 3.60×
- Total profit
- $630,495
- Equity at exit
- $74,789
Cash invested: $242,200 (down + closing). Projections, not guarantees.
Landlord ↔ Tenant lean methodology
- Overall (STATE)
- 86 Strongly Landlord-Friendly
- State Utah
- 86 Strongly Landlord-Friendly · R+15
- County
- — inherits STATE
- City
- — inherits STATE
ZIP-level market 84103
- Rents YoY
- 1.6%
- Active inventory
- 207
- Price-to-rent
- 29.9×
Monthly cashflow live
- Estimated rent
- $14,472 high interval (Pro) →
- Mortgage (P&I)
- −$4,536
- Tax from tax record
- −$328 /mo · $3,934/yr
- Insurance
- −$360
- HOA
- −$0
- Vacancy / Maint / Mgmt
- −$3,039
- Net cashflow
- $6,208
Break-even live
Sensitivity live
| Price | -10% $6,698 | -5% $6,453 | +0% $6,208 | +5% $5,964 | +10% $5,719 |
|---|---|---|---|---|---|
| Rent | -10% $5,065 | -5% $5,637 | +0% $6,208 | +5% $6,780 | +10% $7,352 |
| Rate | -1.0pp $6,644 | -0.5pp $6,428 | base $6,208 | +0.5pp $5,984 | +1.0pp $5,756 |
6-unit breakdown (identical units grouped — click to expand)
| Units | Beds | Baths | Est. rent |
|---|---|---|---|
| 6× units | 3 | 4 | $14,472 |
| #1 | 3 | 4 | $2,412 |
| #2 | 3 | 4 | $2,412 |
| #3 | 3 | 4 | $2,412 |
| #4 | 3 | 4 | $2,412 |
| #5 | 3 | 4 | $2,412 |
| #6 | 3 | 4 | $2,412 |
| Total (6 units) | $14,472 | ||
UW: 25.0% down · 7.5% · 30yr · 1.5% tax · 5.0% vac · 8.0% maint · 8.0% mgmt
Financing live
Cash to close
- Down payment
- $216,250
- Closing costs
- $25,950
- Reserves months
- —
- Total cash needed
- —
Loan-product check · same deal, 3 products live
Conventional
25% down · 7.5% · 30yr
- Down + closing
- —
- Monthly P&I
- —
- Monthly cashflow
- —
- DSCR
- —
- Eligible?
- —
Personal DTI + credit; lowest rate.
DSCR
20% down · 8.5% · 30yr
- Down + closing
- —
- Monthly P&I
- —
- Monthly cashflow
- —
- DSCR
- —
- Eligible?
- —
No personal income docs; deal must DSCR.
Hard money
10% down · 12.0% · 12mo
- Down + closing
- —
- Monthly P&I
- —
- Monthly cashflow
- —
- DSCR
- —
- Eligible?
- —
Short-term bridge; refi at stabilization.
Listing history 18 events
-
2026-06-21days on market $865,000 Active 73 DOM
-
2026-06-18days on market $865,000 Active 70 DOM
-
2026-06-17days on market $865,000 Active 69 DOM
-
2026-06-16days on market $865,000 Active 68 DOM
-
2026-06-15days on market $865,000 Active 67 DOM
-
2026-06-13days on market $865,000 Active 65 DOM
-
2026-06-13days on market $865,000 Active 64 DOM
-
2026-06-09days on market $865,000 Active 61 DOM
-
2026-06-08days on market $865,000 Active 60 DOM
-
2026-06-07days on market $865,000 Active 59 DOM
-
2026-06-05days on market $865,000 Active 56 DOM
-
2026-06-03days on market $865,000 Active 55 DOM
-
2026-06-02days on market $865,000 Active 54 DOM
-
2026-06-01days on market $865,000 Active 53 DOM
-
2026-05-31days on market $865,000 Active 52 DOM
-
2026-05-23price $865,000
-
2026-04-28price $985,000
-
2026-04-09$1,065,000 Active
ⓘ Source: listings_history table (triggers on properties + properties_extension) + one-shot
backfill from property_details.listing_events for pre-trigger history.
Tax reassessment forecast UT · Resets to sale price
- Current annual tax
- $3,934 · $328/mo
- Projected year-2 tax
- $5,709 · $476/mo
- Expected delta
- +$1,775/yr (+$148/mo · 45.1%)
ⓘ Screening estimate from a state-policy table — verify with the county assessor before closing.
Climate risk First Street
- Flood 1/10 Low FEMA zone X (unshaded) · 0% chance over 30 yrs
- Wildfire 6/10 Major
- Heat 4/10 Moderate 7 d/yr ≥94°F today · 18 d/yr by 30 yrs out
- Wind 1/10 Low
- Air quality 4/10 Moderate 5 unhealthy d/yr today · 7 by 30 yrs out
Nearby sold comps map
Loading sold comps map…
Walkable amenities ~0.75 mi
Loading nearby amenities…
Taxation est. · year 1
- Rental income
- $173,664
- − Mortgage interest
- −$48,453
- − Property taxes
- −$3,934
- − Insurance
- −$4,325
- − Repairs & maintenance
- −$13,893
- − Management
- −$13,893
- − Depreciation
- −$25,164
- Taxable income
- $64,002
- Est. tax owed @ 24.0%
- −$15,360
- After-tax cash flow
- $59,141/yr
For passive investors: Depreciation is non-cash, so a rental often shows a tax loss while cash-flowing — sheltering income. Rental losses are passive: they offset passive income freely, and up to $25,000/yr can offset ordinary (W-2) income if you actively participate and your MAGI is under $100k (phasing out to $0 by $150k); unused losses carry forward. On sale, claimed depreciation is recaptured at up to 25%, and gains may owe capital-gains tax (a 1031 exchange can defer both). Figures are a year-1 estimate at your 24.0% rate — not tax advice; consult a CPA.
Schools (NCES district)
- District
- Salt Lake District
- NCES district ID
- 4900870
- Math proficiency
- 30% ▼ -13.00%
- Reading proficiency
- 37% ▼ -6.00%
- Median HH income
- $47,550
- Composite
- 28.85/100
- National rank
- #6645
- State rank
- #65 of 80 in UT
Livability — Salt Lake City
- Score
- 75/100
- State rank
- #64
- US rank
- #3994
Category grades
Schools grade is shown separately in the Schools card above.
Census & demographics
- Census place
- Salt Lake City, UT
- County
- Salt Lake County · 1,195,750 people
- City population
- 172,615
- Metro
- Salt Lake City, UT
- Population (ZIP)
- 23,749
- Household income
- $83,916
- Rent vs Own
- Severe rent burden
- 1273.0
Population outlook (Salt Lake County) Hauer SSP2
- Today (2025)
- 1,305,860 people
- By 2030
- 1,402,611 · +7.4%
- By 2040
- 1,594,533 · +22.1%
- By 2050
- 1,787,244 · +36.9%
- By 2075
- 2,224,138 · +70.3%
- By 2100
- 2,551,390 · +95.4%
Race, ethnicity, and origin ACS 2023
- Neighborhood character
- Predominantly White (79%)
- Race & ethnicity
- White 79% Hispanic / Latino 10% Two or more races 9% Asian 3% Black 2%
- Hispanic origin (detail)
- Mexican 5%
- Common ancestry
- Slovak 5% Italian 3% Portuguese 3%
- Foreign-born
- 11% · Canada, China, Jamaica
- Languages at home
- 88% English-only · Spanish 5% Other Indo-European 3% Other Asian/Pacific 1%
Political lean MEDSL · Salt Lake
- 2024 margin
- D (+10.2) · D 53.7% · R 43.5% · Other 2.8%
- 2008→2024 swing
- +10.1pp toward D · 2008: 0.1pp · 2024: 10.2pp
- All cycles
- 2024: D+10.2 2020: D+11.0 2016: D+10.2 2012: R+19.3 2008: D+0.1
Not yet ingested
- Civics
- —
Market trends
- HPI YoY
- ▼ -623.62%
- Current HPI
- 276.3149
- Rent YoY
- ▲ 1.57%
- Metro
- Salt Lake City, UT
- State GDP YoY
- ▲ 3.54%
- F500 in state
- 2
Industry mix (Fortune 500 HQ in UT)
| Industry | F500 HQs | Revenue |
|---|---|---|
| Financial Services | 1 | $3B |
|
||
Price history
-18.8% since first listed3 events — show timeline
- 2026-05-23 Price Changed $865,000 WFRMLS
- 2026-04-28 Price Changed $985,000 WFRMLS
- 2026-04-09 Listed $1,065,000 WFRMLS
Property tax history
+3.6%/yrLatest (2025): $3,934 · -6.8% YoY. Source: county tax records.
Cash-flow waterfall
monthlySold comps — $/sqft
last 12 mo · ≤1 miLoading sold comps…