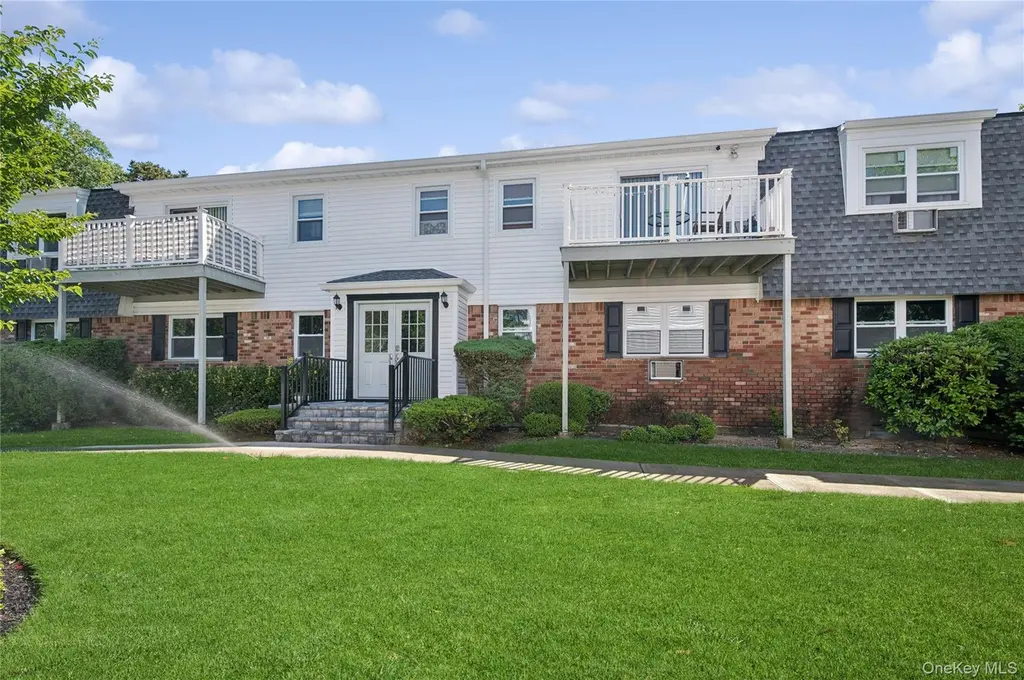
260 Waverly Ave #49 · Patchogue, NY
Flood risk 4/10 · Minor
- FEMA flood zone
- X (unshaded)
- Chance of flooding over 30 yrs
- 0.22%
- Est. flood insurance / yr
- $507 – $1,088
Fire risk 1/10 · Minimal
- Est. fire insurance / yr
- $691 – $1,283
Heat risk 5/10 · Moderate
- Hot days now (above 93°F)
- 7 days/yr
- Hot days in 30 yrs
- 18 days/yr
Wind risk 6/10 · Moderate
- Chance of severe wind over 30 yrs
- 77.0%
Air-quality risk 3/10 · Minor
- Unhealthy air days now
- 3 days/yr
- Unhealthy air days in 30 yrs
- 4 days/yr
Risk factors via First Street. Map © Google.
Why this score? — see what drove the D+ grade
The composite is a weighted blend of 9 inputs, each scored 0–100. Each bar is that input's sub-score; the figure is the points it added to the 100-point composite (weight × sub-score).
- Cash flow +11.1/30.0
- ARV discount +7.5/15.0
- Schools +6.7/10.0
- 1% rule +6.3/10.0
- Livability +4.0/5.0
- Rent growth +3.8/5.0
- DSCR +3.2/10.0
- Condition / age +2.5/5.0
- Appreciation +0.0/10.0
$240,000
🖨 Deal sheet 📄 Offer letter ✓ Due diligence
Listing remarks
Welcome to this beautifully updated & move-in ready first floor end unit, 1 bedroom, 1 bath, co-op. Ideally located in the heart of Patchogue Village & complimented by tasteful updates throughout, makes it a standout opportunity for buyers seeking convenience & comfort. Recent improvements include new flooring in the bedroom & new carpeting in the living area, creating a fresh, modern feel that’s ready for you to enjoy from day one. Enjoy the unbeatable location, just minutes from the LIRR for an easy commute & close to the Fire Island ferries, providing quick access to Long Island’s renowned beaches & waterfront destinations. You’ll als
Key facts
- Updated
- New carpeting
- First floor end unit
Tags
Property features AI
Finance
- HOA & community: Association: Greenview Properties; Association fees include exterior maintenance, gas, heat, sewer, snow removal, trash, and water
Exterior
- Parking: Parking lot (no carport)
- Utilities: Public sewer; Natural gas connected
- Home design: Stock cooperative; Entry on level 1; Unit occupies one level
- Construction: Brick and frame construction
- Exterior features: Brick and frame construction; Not waterfront
Interior
- Kitchen: Dishwasher; Microwave; Refrigerator; Stainless steel appliances
- Bedrooms: Bedroom located on the first floor
- Bathrooms: One full bathroom
- Heating & cooling: Baseboard heating; Natural gas heating; Wall/window air conditioning units
- Interior features: First-floor bedroom; First-floor full bathroom; No basement; Total of four rooms; Two stories in the building; unit on one level with entry at level 1; Pets allowed (call for details)
- Laundry & utility: Common area laundry
Neighborhood map
What this means for you Summary
Snapshot
- This is a 1-bed/1.0-bath condo listed at $240k.
Deal economics
- At list price, monthly cash flow is $-95 ($-1k/yr) — negative.
- The deal already cash-flows at list — no discount required.
- Meets the 1% rule at list price ($3k rent vs $240k).
- Cap rate 5.8% vs local median 3.4% in Patchogue — top-decile yield for the area; either an underpriced asset or a hidden risk that comps aren't pricing in. Stress-test before assuming the spread holds.
Location & tenants
- Location reads 80/100 on livability (#108 in NY, #1,800 nationally) — a professional / high-income tenant draw. Strengths: employment A+, housing A+, health & safety A+; Watch: amenities D-, cost of living F.
- Patchogue-Medford Union Free School District (suburban): math 83% / reading 69% proficiency, ranked #73 of 590 in NY (top 12%) — strong family-tenant draw, lease renewals of 3-5y typical.
- Zoned schools: River Elementary School (math 75%, 300 students, 47% FRL); South Ocean Middle School (math 75%, 599 students, 57% FRL); Patchogue-Medford High School (math 89% / reading 67%, grade A-, #577 of 1,100 statewide, top 52%, 2,443 students, 53% FRL) — zoned schools average 52% FRL vs 35% district-wide (18 pts higher); higher-poverty schools than district average — tighter screening recommended.
- Market conditions: Rents rising fast (+5.1%/yr); 216 active listings in the ZIP; 20 comparable units currently listed for rent nearby; rentals at typical pace (median 23d on market — plan ~3-4 weeks tenant-placement turnaround); 40% of comp listings sitting > 30 days — soft ceiling on asking rent; solid renter incomes; 1,366 units permitted in Suffolk County in 2024 (216 in 5+ unit buildings).
- This rent runs 31% of the median local income ($105k/yr) — at the standard rent-burdened threshold; future hikes will face affordability resistance.
Forward outlook
- Local home prices are declining (-3.0%/yr); year-one equity from $2k of loan paydown is wiped out by about $7k of value loss. Plan a longer hold.
- Suffolk County population projected to shrink 5% by 2050 — rents likely to lag national; underwrite the cash flow, not the appreciation.
Negotiation context
- Only 5 days on market — expect competitive offers; lowballing is unlikely to land.
- 3 sale attempts since 14y ago with the ask held roughly flat each time — persistent listings suggest the price (not the market) is what's stuck; bring a comps-based counter.
Risks & watch-outs
- Watch-outs: HOA is 22% of rent.
- Climate carrying-cost: major wind risk, 77% chance of damaging wind over 30y; extreme-heat days projected 7→18/yr by 2055 (HVAC capex compounding) — expect insurance premiums to compound above CPI over the hold.
Questions for the listing agent
- What do current leases actually rent for vs. the listed asking? Can we see a recent rent roll and the last 12 months of T-12 income?
- Built in 1975 — when were the roof, HVAC, electrical panel, plumbing, and water heater last replaced?
- What does the HOA fee cover, when was the last increase, and are there any pending special assessments or reserve-fund shortfalls?
- Any open or pending special assessments — roof, HVAC, plumbing, elevator, façade? What's the per-unit balance and payoff schedule, and is the seller paying it off at close or rolling it to the buyer?
- Is there a deadline driving the sale (1031 exchange, divorce, estate, relocation)? That informs how much negotiation room exists.
- Schools are F-rated, which usually means shorter tenancies and higher turnover. Who's the typical renter profile here, and what's been the actual vacancy rate?
- The area grade is low — what's the realistic commute time and amenity access for the typical tenant pool here? Any planned neighborhood developments (good or bad) we should know about?
- What's the average days-on-market for RENTAL listings here right now (not sales)? A rising rental-DOM trend means longer vacancies and softer asking-rent achievability than the comps imply.
- What's the recent tenant-quality profile in this submarket — average credit score on applications, eviction rate, late-payment / NSF rate, and stable-employment percentage? A property-management company in the area should have these aggregated.
- How much new apartment / multifamily construction is in the pipeline within 1–3 miles? Heavy new supply (>2% of stock underway) typically softens rents 12–24 months out; light construction supports rent growth.
Investment metrics
- 1% rule
- 1.13% ✓
- Cap rate
- 5.82%
- Cash-on-cash
- -1.70%
- DSCR
- 0.92
- GRM
- 7.3
CMA / ARV
No comps found within radius.
Projected returns pro-forma
-3.0% appreciation · 5.07% rent growth · sell at horizon
- IRR
- -15.8%
- Equity multiple
- 0.42×
- Total profit
- $-38,763
- Equity at exit
- $35,785
- IRR
- -3.0%
- Equity multiple
- 0.77×
- Total profit
- $-15,146
- Equity at exit
- $20,751
Cash invested: $67,200 (down + closing). Projections, not guarantees.
Landlord ↔ Tenant lean methodology
- Overall (STATE)
- 15 Strongly Tenant-Friendly
- State New York
- 15 Strongly Tenant-Friendly · D+10
- County
- — inherits STATE
- City
- — inherits STATE
ZIP-level market 11772
- Rents YoY
- 5.1%
- Active inventory
- 216
- Price-to-rent
- 7.3×
Monthly cashflow live
- Estimated rent
- $2,723 high interval (Pro) →
- Mortgage (P&I)
- −$1,259
- Tax est. 1.5%
- −$300 /mo · $3,600/yr
- Insurance
- −$100
- HOA est. from 2 same-building comps
- −$588
- Vacancy / Maint / Mgmt
- −$572
- Net cashflow
- $-95
Break-even live
UW: 25.0% down · 7.5% · 30yr · 1.5% tax · 5.0% vac · 8.0% maint · 8.0% mgmt
Financing live
Cash to close
- Down payment
- $60,000
- Closing costs
- $7,200
- Reserves months
- —
- Total cash needed
- —
Loan-product check · same deal, 3 products live
Conventional
25% down · 7.5% · 30yr
- Down + closing
- —
- Monthly P&I
- —
- Monthly cashflow
- —
- DSCR
- —
- Eligible?
- —
Personal DTI + credit; lowest rate.
DSCR
20% down · 8.5% · 30yr
- Down + closing
- —
- Monthly P&I
- —
- Monthly cashflow
- —
- DSCR
- —
- Eligible?
- —
No personal income docs; deal must DSCR.
Hard money
10% down · 12.0% · 12mo
- Down + closing
- —
- Monthly P&I
- —
- Monthly cashflow
- —
- DSCR
- —
- Eligible?
- —
Short-term bridge; refi at stabilization.
Rent comps 20 comps
| Address | Beds | Baths | Sqft | Rent | $/sqft | DOM | Units | Dist |
|---|---|---|---|---|---|---|---|---|
| 177 Waverly Ave Unit Second Floor Patchogue, NY | 2.0 | 1.0 | 835 | $2,995 | $3.59 | 6d | 1 | 0.24mi |
| 116 Waverly Ave Unit 8 Patchogue, NY | 1.0 | 1.0 | 730 | $2,895 | $3.97 | 44d | 1 | 0.40mi |
| 116 Waverly Ave Unit 7 Patchogue, NY | 1.0 | 1.0 | 722 | $2,795 | $3.87 | 44d | 1 | 0.40mi |
| 99 Waverly Ave Patchogue, NY | 1.0–2.0 | 1.0–2.0 | 928 | $2,381 | $2.57 | 1d | 9 | 0.46mi |
| 34 Union Ave Patchogue, NY | 2.0 | 1.0 | 1000 | $3,000 | $3.00 | 5d | 1 | 0.69mi |
| 20 Spruce Dr Holbrook, NY | 1.0–2.0 | 1.0–2.0 | 864 | $2,500 | $2.89 | 1d | 23 | 0.76mi |
| 22 Jennings Ave Unit B Patchogue, NY | 2.0 | 1.0 | 919 | $3,000 | $3.26 | 1d | 1 | 0.76mi |
| 1 Village Green Way Patchogue, NY | 1.0–2.0 | 1.0–2.0 | 947 | $2,877 | $3.04 | 1d | 7 | 0.82mi |
| 90 E Main St Unit 2 Patchogue, NY | 1.0 | 1.0 | 750 | $2,300 | $3.07 | 44d | 1 | 1.03mi |
| 80 Division St Unit 2B Patchogue, NY | 2.0 | 2.0 | 1100 | $3,500 | $3.18 | 44d | 1 | 1.10mi |
| 80 Division St Unit 1C Patchogue, NY | 1.0 | 1.0 | 860 | $2,800 | $3.26 | 20d | 1 | 1.10mi |
| 80 Division St Patchogue, NY | 1.0 | 1.0 | 860 | $3,200 | $3.72 | 1d | 1 | 1.10mi |
| 80 Division St Patchogue, NY | 2.0 | 1.0 | 1000 | $3,100 | $3.10 | 25d | 1 | 1.10mi |
| 80 Division St Unit 2c Patchogue, NY | 1.0 | 1.0 | 860 | $3,200 | $3.72 | 44d | 1 | 1.10mi |
| 80 Division St Unit 204 Patchogue, NY | 1.0 | 1.0 | 860 | $2,800 | $3.26 | 44d | 1 | 1.10mi |
| 80 Division St Unit 3d Patchogue, NY | 1.0 | 1.0 | 860 | $3,600 | $4.19 | 44d | 1 | 1.10mi |
| 234 River Ave Patchogue, NY | 2.0 | 1.0 | 687 | $2,390 | $3.48 | 1d | 1 | 1.26mi |
| 68 Winges Ave Patchogue, NY | 1.0 | 1.0 | 800 | $2,000 | $2.50 | 44d | 1 | 1.30mi |
| 830 Terrace Rd Unit I8-830 Bayport, NY | 1.0 | 1.0 | 715 | $2,465 | $3.45 | 22d | 1 | 1.41mi |
| 512 Terrace Rd Unit T13-512 Bayport, NY | 1.0 | 1.0 | 775 | $2,500 | $3.23 | 22d | 1 | 1.50mi |
HOA detail condo
- Monthly dues
- $0 · $0/yr
- Likely covers
- water
- Assessments
- None detected in remarks — confirm with the listing agent.
Listing history 4 events
-
2026-06-15days on market $240,000 Active 5 DOM
-
2026-06-13days on market $240,000 Active 3 DOM
-
2026-06-13remarks 657-char remark
-
2026-06-13$240,000 Active 2 DOM
ⓘ Source: listings_history table (triggers on properties + properties_extension) + one-shot
backfill from property_details.listing_events for pre-trigger history.
Climate risk First Street
- Flood 4/10 Moderate FEMA zone X (unshaded) · 22% chance over 30 yrs
- Wildfire 1/10 Low
- Heat 5/10 Major 7 d/yr ≥93°F today · 18 d/yr by 30 yrs out
- Wind 6/10 Major 77% chance of damaging wind over 30 yrs
- Air quality 3/10 Moderate 3 unhealthy d/yr today · 4 by 30 yrs out
Nearby sold comps map
Loading sold comps map…
Walkable amenities ~0.75 mi
Loading nearby amenities…
Taxation est. · year 1
- Rental income
- $32,679
- − Mortgage interest
- −$13,444
- − Property taxes
- −$3,600
- − Insurance
- −$1,200
- − Repairs & maintenance
- −$2,614
- − Management
- −$2,614
- − HOA
- −$7,056
- − Depreciation
- −$6,982
- Taxable loss
- −$4,831
- Est. tax savings @ 24.0%
- +$1,159
- After-tax cash flow
- $17/yr
For passive investors: Depreciation is non-cash, so a rental often shows a tax loss while cash-flowing — sheltering income. Rental losses are passive: they offset passive income freely, and up to $25,000/yr can offset ordinary (W-2) income if you actively participate and your MAGI is under $100k (phasing out to $0 by $150k); unused losses carry forward. On sale, claimed depreciation is recaptured at up to 25%, and gains may owe capital-gains tax (a 1031 exchange can defer both). Figures are a year-1 estimate at your 24.0% rate — not tax advice; consult a CPA.
Schools (NCES district)
- District
- Patchogue-Medford Union Free School District
- NCES district ID
- 3622470
- Math proficiency
- 83% ▲ 27.00%
- Reading proficiency
- 69% ▲ 15.00%
- Median HH income
- $75,120
- Composite
- 66.81/100
- National rank
- #405
- State rank
- #73 of 590 in NY
Livability — Patchogue
- Score
- 80/100
- State rank
- #108
- US rank
- #1800
Category grades
Schools grade is shown separately in the Schools card above.
Census & demographics
- Census place
- Patchogue, NY
- County
- Suffolk County · 679,920 people
- City population
- 45,023
- Metro
- New York-Newark-Jersey City, NY-NJ-PA
- Population (ZIP)
- 45,023
- Household income
- $105,245
- Rent vs Own
- Severe rent burden
- 1595.0
Population outlook (Suffolk County) Hauer SSP2
- Today (2025)
- 1,505,262 people
- By 2030
- 1,498,318 · -0.5%
- By 2040
- 1,471,101 · -2.3%
- By 2050
- 1,424,848 · -5.3%
- By 2075
- 1,337,157 · -11.2%
- By 2100
- 1,217,720 · -19.1%
Race, ethnicity, and origin ACS 2023
- Neighborhood character
- Predominantly White (66%)
- Race & ethnicity
- White 66% Hispanic / Latino 24% Two or more races 8% Black 4% Asian 3%
- Hispanic origin (detail)
- Mexican 1% Puerto Rican 5% Dominican 2%
- Common ancestry
- Romanian 4% Lithuanian 2% Scotch-Irish 2%
- Foreign-born
- 15% · Canada, Jamaica, China
- Languages at home
- 78% English-only · Spanish 15% Other Asian/Pacific 2% Other Indo-European 1%
Political lean MEDSL · Suffolk
- 2024 margin
- Lean R (+10.0) · D 45.0% · R 55.0%
- 2008→2024 swing
- -16.0pp toward R · 2008: 6.0pp · 2024: -10.0pp
- All cycles
- 2024: R+10.0 2020: R+0.0 2016: R+8.2 2012: D+2.9 2008: D+6.0
Not yet ingested
- Civics
- —
Market trends
- HPI YoY
- ▼ -578.02%
- Current HPI
- 375.1174
- Rent YoY
- ▲ 5.07%
- Metro
- New York-Newark-Jersey City, NY-NJ-PA
- State GDP YoY
- ▲ 2.60%
- F500 in state
- 92
Industry mix (Fortune 500 HQ in NY)
| Industry | F500 HQs | Revenue |
|---|---|---|
| Financial Services | 10 | $950B |
|
||
| Consumer Goods | 9 | $162B |
|
||
| Insurance | 4 | $225B |
|
||
| Telecommunications | 2 | $144B |
|
||
| Pharmaceuticals | 2 | $112B |
|
||
| Media / Entertainment | 2 | $69B |
|
||
Price history
+140.0% since first listed7 events — show timeline
- 2026-06-09 Listed $240,000 OneKey® MLS as Distributed by MLS Grid
- 2015-09-21 Listing Removed — OneKey® MLS as Distributed by MLS Grid
- 2015-08-20 Price Changed $70,000 OneKey® MLS as Distributed by MLS Grid
- 2015-08-11 Price Changed $90,000 OneKey® MLS as Distributed by MLS Grid
- 2015-07-09 Listed $80,000 OneKey® MLS as Distributed by MLS Grid
- 2012-12-31 Listing Removed — OneKey® MLS as Distributed by MLS Grid
- 2012-08-14 Listed $99,990 OneKey® MLS as Distributed by MLS Grid
Cash-flow waterfall
monthlySold comps — $/sqft
last 12 mo · ≤1 miLoading sold comps…