 Multi-family
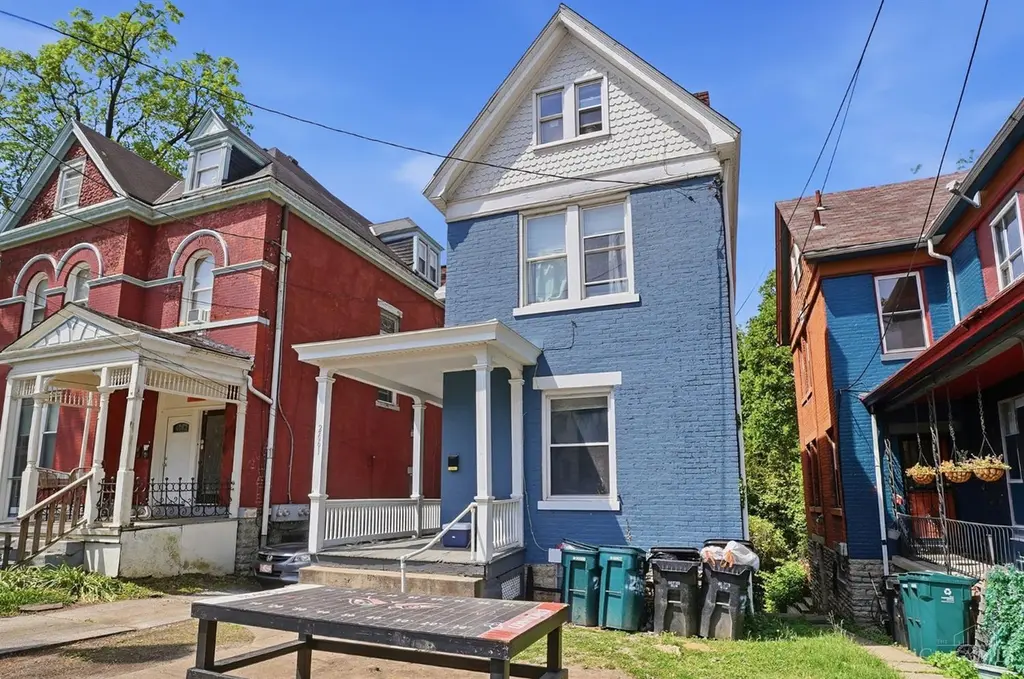
2661 Bellevue Ave · Cincinnati, OH
Flood risk 1/10 · Minimal
- FEMA flood zone
- X (unshaded)
- Chance of flooding over 30 yrs
- 0.0%
- Est. flood insurance / yr
- $473 – $860
Fire risk 1/10 · Minimal
- Est. fire insurance / yr
- $713 – $1,323
Heat risk 4/10 · Minor
- Hot days now (above 103°F)
- 7 days/yr
- Hot days in 30 yrs
- 18 days/yr
Wind risk 2/10 · Minimal
- Chance of severe wind over 30 yrs
- 1.0%
Air-quality risk 3/10 · Minor
- Unhealthy air days now
- 2 days/yr
- Unhealthy air days in 30 yrs
- 3 days/yr
Risk factors via First Street. Map © Google.
Why this score? — see what drove the D grade
The composite is a weighted blend of 9 inputs, each scored 0–100. Each bar is that input's sub-score; the figure is the points it added to the 100-point composite (weight × sub-score).
- Cash flow +15.5/30.0
- ARV discount +7.5/15.0
- DSCR +4.8/10.0
- Livability +4.0/5.0
- 1% rule +3.7/10.0
- Rent growth +3.0/5.0
- Schools +2.5/10.0
- Condition / age +2.5/5.0
- Appreciation +0.0/10.0
$424,900
🖨 Deal sheet (PDF) 📄 Offer letter ✓ Due diligence
Multi-family units
County records classify this as Multi-Family (2-4 Unit). Listing-text estimate: 1 unit. estimate disagrees with records
Listing remarks
Currently generating $3,750/month with tenants paying all utilities, this well maintained brick property offers a solid rental history and strong income potential. The layout includes a full bath on the first floor, three bedrooms and another full bath on the second, plus two additional bedrooms on the third for flexible living or rental use. Off street parking and a full unfinished basement provide added function and future potential. Major updates including roof, water heater, furnace, and HVAC have already been handled. Out back, the yard has a surprisingly private, park like feel that stands out for the area. A great option for investors, with flexibility for an owner occupant looking f
Key facts
- 6,055 sq ft lot
- Built 1897
- Listed 52 days
Property features AI
Finance
- Other: Lease not considered
- HOA & community: No HOA
Exterior
- Parking: Driveway
- Utilities: Public water; Public sewer; Natural gas service
- Home design: Traditional single-family home; Three-plus levels; Second floor area reported
- Construction: Brick construction; Poured foundation; Shingle roof
- Exterior features: Two fireplaces (currently inoperable); Double-hung vinyl windows; Lot approximately 0.139 acres
Interior
- Kitchen: Kitchen approximately 14 x 9
- Bedrooms: Five bedrooms total; Primary bedroom on level 2 (15 x 13); Bedroom 2 on level 2 (14 x 10); Bedroom 3 on level 2 (14 x 10); Bedroom 4 on level 3 (20 x 15); Bedroom 5 on level 3 (15 x 10)
- Bathrooms: Two full bathrooms; One full bathroom on level 1; One full bathroom on level 2; Primary bathroom: Other
- Heating & cooling: Forced air heating (gas); Central air conditioning; Gas water heating
- Interior features: Eight total rooms; Full unfinished basement
- Laundry & utility: Basement utility area (unfinished)
Neighborhood map
What this means for you Summary
Snapshot
- This is a 4-bed/2.0-bath multifamily listed at $425k.
Deal economics
- At list price, monthly cash flow is $173 ($2k/yr) — positive.
- The deal already cash-flows at list — no discount required.
- To meet the 1% rule (rent ≥ 1% of price), the offer needs to be $369k (13.1% below list).
- Recommended offer: $369k (13.1% below list) — sets the bar for 1% rule.
- Cap rate 6.8% vs local median 3.9% in Cincinnati — top-decile yield for the area; either an underpriced asset or a hidden risk that comps aren't pricing in. Stress-test before assuming the spread holds.
Location & tenants
- Location reads 80/100 on livability (#130 in OH, #1,856 nationally) — a professional / high-income tenant draw. Strengths: amenities A+, commute A+, cost of living A+; Watch: employment D, crime F.
- Cincinnati Public Schools (urban): math 25% / reading 36% proficiency, ranked #581 of 656 in OH (top 89%) — families likely to look elsewhere, expect single-tenant / working-renter base with shorter leases; 70% free/reduced lunch — lower-income household profile, screen leases tightly.
- Zoned schools: Sands Montessori School (math 70% / reading 77%, grade A, #311 of 1,584 statewide, top 20%, 683 students, 22% FRL); Hartwell School (math 17% / reading 31%, grade F, #593 of 654 statewide, top 91%, 447 students, 0% FRL); Walnut Hills High School (math 79% / reading 89%, grade A, #17 of 781 statewide, top 2%, 2,582 students, 14% FRL) — zoned schools average 12% FRL vs 70% district-wide (59 pts lower); this property's tenant base skews higher-income than the district average.
- Zoned-school proficiency averages 60% at this address vs 30% district-wide (+30 pts) — the actual schools serving this property are materially stronger than the Cincinnati Public Schools average implies; a family-tenant draw the district grade alone would hide.
- Market conditions: Rents rising (+2.1%/yr); 70 active listings in the ZIP; 40 comparable units currently listed for rent nearby; rentals at typical pace (median 22d on market — plan ~3-4 weeks tenant-placement turnaround); lower-income renter base — watch delinquency; 801 units permitted in Hamilton County in 2024 (190 in 5+ unit buildings).
- At $3,694/mo this rent would consume 124% of the median local household income ($36k/yr) (locally 2461% of renters already pay >50% of income on rent) — very limited rent-growth headroom before tenants either downsize or default.
Forward outlook
- Local home prices are declining (-3.0%/yr); year-one equity from $3k of loan paydown is wiped out by about $13k of value loss. Plan a longer hold.
Negotiation context
- It's been on market 52 days — a 3% lower offer ($412k) is reasonable based on typical stale-listing flexibility.
- 3 sale attempts; this cycle's ask is 12040% above the opening price — seller raised mid-cycle; expect resistance to lowballs.
- Current owner paid $44k; list at $425k implies a 866% gain — meaningful room to come down on a strong offer.
Risks & watch-outs
- Watch-outs: built in 1897 — expect roof / HVAC / electrical / plumbing capex.
Questions for the listing agent
- It's been on market 52 days. Have you received any prior offers? Is the seller open to a 13% concession, seller financing, or rate buy-down credit?
- Built in 1897 — when were the roof, HVAC, electrical panel, plumbing, and water heater last replaced?
- Is there a deadline driving the sale (1031 exchange, divorce, estate, relocation)? That informs how much negotiation room exists.
- Schools are B-rated — typically a magnet for longer-tenancy family renters. What's the average tenant stay here, and is there a school-zone premium baked into asking?
- Crime grade is F in this area — have there been break-ins, vandalism, or insurance claims at this property in the last 3 years? What carrier currently insures it and at what premium?
- The area grade is low — what's the realistic commute time and amenity access for the typical tenant pool here? Any planned neighborhood developments (good or bad) we should know about?
- What's the average days-on-market for RENTAL listings here right now (not sales)? A rising rental-DOM trend means longer vacancies and softer asking-rent achievability than the comps imply.
- What's the recent tenant-quality profile in this submarket — average credit score on applications, eviction rate, late-payment / NSF rate, and stable-employment percentage? A property-management company in the area should have these aggregated.
- How much new apartment / multifamily construction is in the pipeline within 1–3 miles? Heavy new supply (>2% of stock underway) typically softens rents 12–24 months out; light construction supports rent growth.
Investment metrics
- 1% rule
- 0.87% ✗
- Cap rate
- 6.78%
- Cash-on-cash
- 1.75%
- DSCR
- 1.08
- GRM
- 9.6
CMA / ARV
- ARV (on-the-fly)
- $277,772
- Comps found
- 6
Show comp detail 6 sales within ~0.75 mi
| Address | Dist | Beds/Ba | Sqft | Sold | Price | $/sf | Match |
|---|---|---|---|---|---|---|---|
| 3016 Euclid Ave | 0.31mi | 4/2.0 | 2,567 (+9%) | 12mo | $418,500 | $163 | 60 |
| 311 Hilton Pl | 0.20mi | 4/3.0 | 2,681 (+14%) | 5mo | $190,000 | $71 | 59 |
| 2322 Maplewood Ave | 0.47mi | 5/3.0 (+1) | 2,455 (+4%) | 10mo | $290,000 | $118 | 54 |
| 260 Earnshaw Ave | 0.65mi | 5/2.0 (+1) | 2,446 (+4%) | 14mo | $89,000 | $36 | 47 |
| 3243 Vine St | 0.67mi | 5/3.0 (+1) | 2,297 (-2%) | 19mo | $310,000 | $135 | 40 |
| 2228 Reading Rd | 0.60mi | 5/3.0 (+1) | 2,640 (+12%) | 8mo | $274,000 | $104 | 36 |
Match score weights: distance 35% · size 25% · config 20% · recency 20%. Top-matched comps best support the ARV.
Projected returns pro-forma
-3.0% appreciation · 2.07% rent growth · sell at horizon
- IRR
- -14.5%
- Equity multiple
- 0.48×
- Total profit
- $-61,296
- Equity at exit
- $63,354
- IRR
- -7.3%
- Equity multiple
- 0.55×
- Total profit
- $-53,200
- Equity at exit
- $36,738
Cash invested: $118,972 (down + closing). Projections, not guarantees.
Landlord ↔ Tenant lean methodology
- Overall (STATE)
- 73 Landlord-Friendly
- State Ohio
- 73 Landlord-Friendly · R+6
- County
- — inherits STATE
- City
- — inherits STATE
ZIP-level market 45219
- Home prices YoY
- -28.3%
- Rents YoY
- 2.1%
- Active inventory
- 70
- Price-to-rent
- 9.6×
Monthly cashflow live
- Estimated rent
- $3,694 high interval (Pro) →
- Mortgage (P&I)
- −$2,228
- Tax from tax record
- −$339 /mo · $4,071/yr
- Insurance
- −$177
- HOA
- −$0
- Vacancy / Maint / Mgmt
- −$776
- Net cashflow
- $173
Break-even live
Sensitivity live
| Price | -10% $414 | -5% $294 | +0% $173 | +5% $53 | +10% $-67 |
|---|---|---|---|---|---|
| Rent | -10% $-118 | -5% $27 | +0% $173 | +5% $319 | +10% $465 |
| Rate | -1.0pp $387 | -0.5pp $281 | base $173 | +0.5pp $63 | +1.0pp $-49 |
UW: 25.0% down · 7.5% · 30yr · 1.5% tax · 5.0% vac · 8.0% maint · 8.0% mgmt
Financing live
Cash to close
- Down payment
- $106,225
- Closing costs
- $12,747
- Reserves months
- —
- Total cash needed
- —
Loan-product check · same deal, 3 products live
Conventional
25% down · 7.5% · 30yr
- Down + closing
- —
- Monthly P&I
- —
- Monthly cashflow
- —
- DSCR
- —
- Eligible?
- —
Personal DTI + credit; lowest rate.
DSCR
20% down · 8.5% · 30yr
- Down + closing
- —
- Monthly P&I
- —
- Monthly cashflow
- —
- DSCR
- —
- Eligible?
- —
No personal income docs; deal must DSCR.
Hard money
10% down · 12.0% · 12mo
- Down + closing
- —
- Monthly P&I
- —
- Monthly cashflow
- —
- DSCR
- —
- Eligible?
- —
Short-term bridge; refi at stabilization.
Rent comps 40 comps
| Address | Beds | Baths | Sqft | Rent | $/sqft | DOM | Units | Dist |
|---|---|---|---|---|---|---|---|---|
| 2813 Gerard St Unit 1540075P Cincinnati, OH | 4.0 | 3.0 | 2152 | $6,281 | $2.92 | 22d | 1 | 0.05mi |
| 241 E University Ave Cincinnati, OH | 5.0 | 2.0 | 1836 | $4,000 | $2.18 | 25d | 1 | 0.12mi |
| 242 Stetson St Unit NA Cincinnati, OH | 3.0 | 2.5 | 2300 | $3,500 | $1.52 | 23d | 1 | 0.27mi |
| 2800 Jefferson Ave Cincinnati, OH | 4.0 | 2.0 | 2500 | $625 | $0.25 | 21d | 1 | 0.32mi |
| 7 W Hollister St Cincinnati, OH | 5.0 | 2.0 | 1585 | $2,750 | $1.74 | 16d | 1 | 0.54mi |
| 2601 May St Cincinnati, OH | 2.0–3.0 | 2.5–3.5 | 1737 | $3,325 | $1.91 | 3d | 12 | 0.58mi |
| 2517 May St Cincinnati, OH | 3.0 | 3.5 | 2014 | $3,420 | $1.70 | 23d | 1 | 0.58mi |
| 236 Gilman Ave Cincinnati, OH | 3.0 | 2.5 | 1699 | $2,200 | $1.29 | 14d | 1 | 0.63mi |
| 216 Gilman Ave Unit 1363975P Cincinnati, OH | 3.0 | 1.0 | 1776 | $3,474 | $1.96 | 4d | 1 | 0.64mi |
| 2271 Vine St Cincinnati, OH | 4.0 | 2.0 | 2268 | $1,525 | $0.67 | 6d | 1 | 0.77mi |
| 2105 Burnet Ave Unit 1056017P Cincinnati, OH | 4.0 | 2.0 | 2960 | $7,384 | $2.49 | 3d | 1 | 0.81mi |
| 2388 Wheeler St Cincinnati, OH | 4.0 | 2.0 | 1740 | $2,700 | $1.55 | 25d | 1 | 0.85mi |
| 2386 Wheeler St Cincinnati, OH | 4.0 | 1.0 | 1740 | $2,700 | $1.55 | 25d | 1 | 0.85mi |
| 850 Lincoln Ave Unit 2 Cincinnati, OH | 3.0 | 2.5 | 2465 | $2,400 | $0.97 | 25d | 1 | 0.86mi |
| 918 Windsor St Cincinnati, OH | 3.0 | 1.0 | 2583 | $1,675 | $0.65 | 25d | 1 | 0.93mi |
| 923 Rogers Pl Cincinnati, OH | 3.0 | 1.0 | 2061 | $1,600 | $0.78 | 25d | 1 | 0.95mi |
| 2332 Chickasaw St Unit 1 Cincinnati, OH | 3.0 | 1.0 | 2000 | $1,800 | $0.90 | 25d | 1 | 0.97mi |
| 2317 Chickasaw St Cincinnati, OH | 5.0 | 2.0 | 2826 | $2,750 | $0.97 | 16d | 1 | 1.01mi |
| 55 Mulberry St Cincinnati, OH | 3.0 | 3.0 | 2500 | $3,500 | $1.40 | 25d | 1 | 1.06mi |
| 107 E Clifton Ave Unit 1234537P Cincinnati, OH | 2.0–3.0 | 1.0–2.0 | 2260 | $6,619 | $2.93 | 16d | 2 | 1.10mi |
| 3028 Gilbert Ave Cincinnati, OH | 5.0 | 1.5 | 1936 | $1,700 | $0.88 | 22d | 1 | 1.11mi |
| 2331 Park Ave Unit 1 Cincinnati, OH | 3.0 | 2.5 | 2200 | $2,350 | $1.07 | 3d | 1 | 1.11mi |
| 2235 Victor St Cincinnati, OH | 4.0 | 2.0 | 2043 | $2,250 | $1.10 | 25d | 1 | 1.13mi |
| 328 Mulberry St Cincinnati, OH | 3.0 | 3.5 | 2640 | $5,500 | $2.08 | 25d | 1 | 1.13mi |
| 328 Mulberry St Cincinnati, OH | 3.0 | 3.5 | 2640 | $5,500 | $2.08 | 16d | 1 | 1.13mi |
| 2231 Flora St Cincinnati, OH | 4.0 | 2.0 | 1728 | $1,500 | $0.87 | 25d | 1 | 1.19mi |
| 623 Riddle Rd Cincinnati, OH | 3.0 | 2.0 | 2028 | $1,800 | $0.89 | 25d | 1 | 1.25mi |
| 3564 Estes Pl Unit 2 Cincinnati, OH | 3.0 | 1.0 | 1662 | $1,500 | $0.90 | 3d | 1 | 1.28mi |
| 3139 Gaff Ave Cincinnati, OH | 3.0 | 2.0 | 1711 | $1,795 | $1.05 | 18d | 1 | 1.28mi |
| 2421 Fairview Ave Cincinnati, OH | 5.0 | 2.0 | 2400 | $3,300 | $1.38 | 25d | 1 | 1.30mi |
| 1354 Broadway Unit 1056136P Cincinnati, OH | 4.0 | 3.0 | 2529 | $7,307 | $2.89 | 4d | 1 | 1.30mi |
| 111 W Elder St Unit 1056044P Cincinnati, OH | 1.0–4.0 | 1.0–4.0 | 1835 | $7,140 | $3.89 | 12d | 2 | 1.32mi |
| 870 Rockdale Ave Cincinnati, OH | 4.0 | 2.0 | 1749 | $1,800 | $1.03 | 25d | 1 | 1.34mi |
| 2704 W McMicken Ave Unit 2 Cincinnati, OH | 3.0 | 1.0 | 1760 | $1,500 | $0.85 | 25d | 1 | 1.36mi |
| 1287 Ida St Cincinnati, OH | 3.0 | 2.5 | 2494 | $4,700 | $1.88 | 18d | 1 | 1.37mi |
| 595 Martin Luther King Dr W Cincinnati, OH | 3.0 | 2.0 | 2048 | $1,650 | $0.81 | 12d | 1 | 1.38mi |
| 1610 Pleasant St Unit 1056041P Cincinnati, OH | 3.0–4.0 | 2.0–3.0 | 2960 | $7,037 | $2.38 | 12d | 2 | 1.41mi |
| 21 E 15th St Unit 1512946P Cincinnati, OH | 3.0 | 2.0 | 2852 | $12,830 | $4.50 | 25d | 1 | 1.41mi |
| 1304 Broadway Unit 1056130P Cincinnati, OH | 1.0–5.0 | 1.0–4.0 | 2072 | $7,152 | $3.45 | 12d | 2 | 1.42mi |
| 1537 Republic St Unit 1058850P Cincinnati, OH | 4.0 | 3.0 | 2421 | $10,677 | $4.41 | 23d | 1 | 1.42mi |
Listing history 19 events
-
2026-06-21days on market $424,900 Active 52 DOM
-
2026-06-18days on market $424,900 Active 49 DOM
-
2026-06-17days on market $424,900 Active 48 DOM
-
2026-06-16days on market $424,900 Active 47 DOM
-
2026-06-15days on market $424,900 Active 46 DOM
-
2026-06-13days on market $424,900 Active 44 DOM
-
2026-06-13days on market $424,900 Active 43 DOM
-
2026-06-09days on market $424,900 Active 40 DOM
-
2026-06-08days on market $424,900 Active 39 DOM
-
2026-06-07days on market $424,900 Active 38 DOM
-
2026-06-03days on market $424,900 Active 34 DOM
-
2026-06-02days on market $424,900 Active 33 DOM
-
2026-06-01days on market $424,900 Active 32 DOM
-
2026-05-31days on market $424,900 Active 31 DOM
-
2026-04-30$3,500
-
2026-04-30$424,900 Active
-
2026-04-06historical $3,500
-
2026-03-11$3,500
-
1991-12-19soldstatus $44,000
ⓘ Source: listings_history table (triggers on properties + properties_extension) + one-shot
backfill from property_details.listing_events for pre-trigger history.
Tax reassessment forecast OH · Partial reset (capped growth)
- Current annual tax
- $4,071 · $339/mo
- Projected year-2 tax
- $5,350 · $446/mo
- Expected delta
- +$1,279/yr (+$107/mo · 31.4%)
ⓘ Screening estimate from a state-policy table — verify with the county assessor before closing.
Climate risk First Street
- Flood 1/10 Low FEMA zone X (unshaded) · 0% chance over 30 yrs
- Wildfire 1/10 Low
- Heat 4/10 Moderate 7 d/yr ≥103°F today · 18 d/yr by 30 yrs out
- Wind 2/10 Low 100% chance of damaging wind over 30 yrs
- Air quality 3/10 Moderate 2 unhealthy d/yr today · 3 by 30 yrs out
Nearby sold comps map
Loading sold comps map…
Walkable amenities ~0.75 mi
Loading nearby amenities…
Taxation est. · year 1
- Rental income
- $44,322
- − Mortgage interest
- −$23,801
- − Property taxes
- −$4,071
- − Insurance
- −$2,124
- − Repairs & maintenance
- −$3,546
- − Management
- −$3,546
- − Depreciation
- −$12,361
- Taxable loss
- −$5,126
- Est. tax savings @ 24.0%
- +$1,230
- After-tax cash flow
- $3,311/yr
For passive investors: Depreciation is non-cash, so a rental often shows a tax loss while cash-flowing — sheltering income. Rental losses are passive: they offset passive income freely, and up to $25,000/yr can offset ordinary (W-2) income if you actively participate and your MAGI is under $100k (phasing out to $0 by $150k); unused losses carry forward. On sale, claimed depreciation is recaptured at up to 25%, and gains may owe capital-gains tax (a 1031 exchange can defer both). Figures are a year-1 estimate at your 24.0% rate — not tax advice; consult a CPA.
Schools (NCES district)
- District
- Cincinnati Public Schools
- NCES district ID
- 3904375
- Math proficiency
- 25% ▼ -19.00%
- Reading proficiency
- 36% ▼ -14.00%
- Median HH income
- $35,743
- Composite
- 25.21/100
- National rank
- #7508
- State rank
- #581 of 656 in OH
Livability — Cincinnati
- Score
- 80/100
- State rank
- #130
- US rank
- #1856
Category grades
Schools grade is shown separately in the Schools card above.
Census & demographics
- Census place
- Cincinnati, OH
- County
- Hamilton County · 701,295 people
- City population
- 505,555
- Metro
- Cincinnati, OH-KY-IN
- Population (ZIP)
- 20,012
- Household income
- $35,657
- Rent vs Own
- Severe rent burden
- 2461.0
Population outlook (Hamilton County) Hauer SSP2
- Today (2025)
- 826,054 people
- By 2030
- 830,947 · +0.6%
- By 2040
- 832,319 · +0.8%
- By 2050
- 822,428 · -0.4%
- By 2075
- 788,688 · -4.5%
- By 2100
- 710,674 · -14.0%
Race, ethnicity, and origin ACS 2023
- Neighborhood character
- Predominantly White (67%)
- Race & ethnicity
- White 67% Black 16% Asian 7% Two or more races 6% Hispanic / Latino 4%
- Common ancestry
- Romanian 3% Italian 2% Slovak 1%
- Foreign-born
- 10% · China, Canada
- Languages at home
- 88% English-only · Chinese 3% Spanish 2% Other Indo-European 2%
Political lean MEDSL · Hamilton
- 2024 margin
- D (+14.9) · D 57.0% · R 42.1%
- 2008→2024 swing
- +7.9pp toward D · 2008: 7.0pp · 2024: 14.9pp
- All cycles
- 2024: D+14.9 2020: D+15.9 2016: D+9.5 2012: D+4.9 2008: D+7.0
Not yet ingested
- Civics
- —
Market trends
- HPI YoY
- ▼ -134.46%
- Current HPI
- 340.1262
- Rent YoY
- ▲ 2.07%
- Metro
- Cincinnati, OH-KY-IN
- State GDP YoY
- ▲ 1.98%
- F500 in state
- 48
Industry mix (Fortune 500 HQ in OH)
| Industry | F500 HQs | Revenue |
|---|---|---|
| Insurance | 3 | $145B |
|
||
| Industrial Machinery | 3 | $49B |
|
||
| Financial Services | 3 | $24B |
|
||
| Consumer Goods | 2 | $93B |
|
||
| Aerospace / Defense | 2 | $47B |
|
||
| Utilities | 2 | $33B |
|
||
Price history
-92.0% since first listed5 events — show timeline
- 2026-04-30 Listed for Rent $3,500 APPFOLIO
- 2026-04-30 Listed $424,900 Cincy MLS
- 2026-04-06 Rental Removed $3,500 APPFOLIO
- 2026-03-11 Listed for Rent $3,500 APPFOLIO
- 1991-12-19 Sold (Public Records) $44,000 Public Records
Property tax history
+5.1%/yrLatest (2025): $4,071 · +0.1% YoY. Source: county tax records.
Cash-flow waterfall
monthlySold comps — $/sqft
last 12 mo · ≤1 miLoading sold comps…