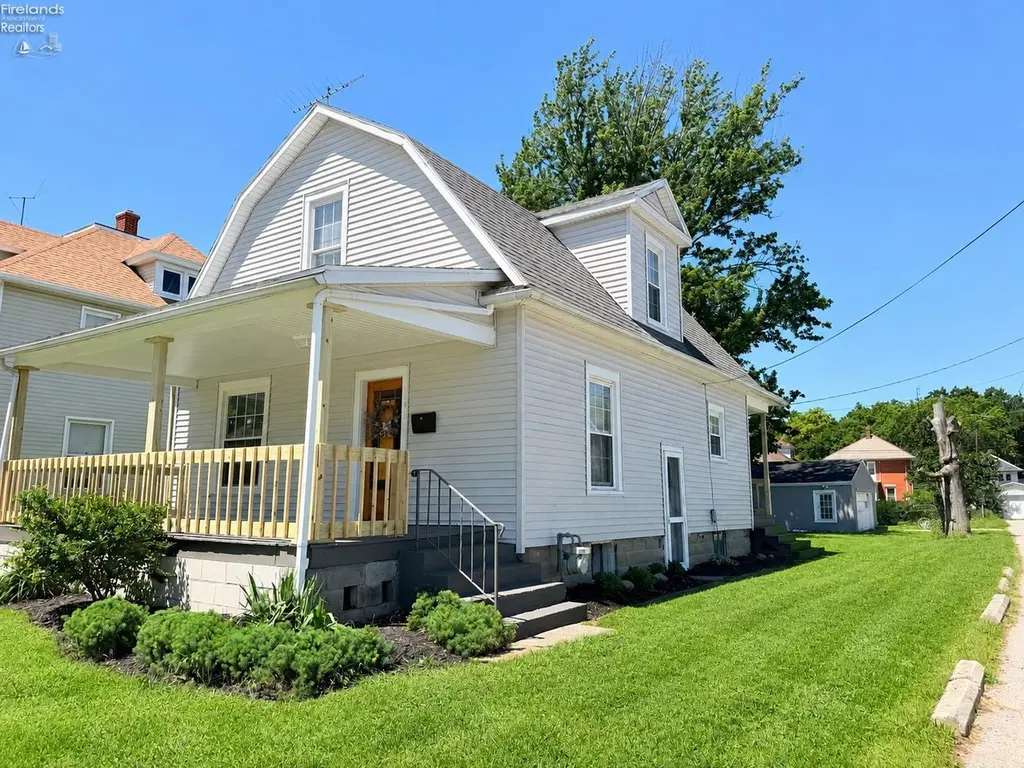
116 S Buchanan St · Fremont, OH
Flood risk 3/10 · Minor
- FEMA flood zone
- X (unshaded)
- Chance of flooding over 30 yrs
- 0.2%
- Est. flood insurance / yr
- $473 – $860
Fire risk 1/10 · Minimal
- Est. fire insurance / yr
- $713 – $1,323
Heat risk 3/10 · Minor
- Hot days now (above 99°F)
- 7 days/yr
- Hot days in 30 yrs
- 17 days/yr
Wind risk 2/10 · Minimal
- Chance of severe wind over 30 yrs
- —
Air-quality risk 2/10 · Minimal
- Unhealthy air days now
- 1 days/yr
- Unhealthy air days in 30 yrs
- 1 days/yr
Risk factors via First Street. Map © Google.
Why this score? — see what drove the C- grade
The composite is a weighted blend of 9 inputs, each scored 0–100. Each bar is that input's sub-score; the figure is the points it added to the 100-point composite (weight × sub-score).
- Cash flow +21.0/30.0
- ARV discount +7.5/15.0
- DSCR +6.7/10.0
- 1% rule +4.3/10.0
- Livability +3.7/5.0
- Schools +3.3/10.0
- Rent growth +2.5/5.0
- Condition / age +2.5/5.0
- Appreciation +0.0/10.0
$167,500
🖨 Deal sheet 📄 Offer letter ✓ Due diligence
Listing remarks
One of a kind, smack dab in town, awesome half Acre L shape yard, all appliances stay, large front porch with new railings, updates throughout including: for plumbing, some electrical updates, light fixtures, new vanity, new toilet, new tub, carpet, vinyl flooring, new shades, whole yard makeover, new garage door, nice flow to the house, new kitchen cabinets, new countertops, new kitchen sink and faucet. Such a cute home, with a great yard, don't miss your chance to view this place.
Key facts
- New vanity
- Large front porch
- Updates throughout
Tags
Property features AI
Exterior
- Parking: Detached off-street garage; 2 garage spaces
- Utilities: Public water; Public sewer
- Home design: Single-family residence; Residential property
- Construction: Vinyl siding
- Exterior features: Asphalt roof
Interior
- Kitchen: Includes microwave, range, refrigerator
- Bedrooms: 5 total rooms (bedrooms and living areas combined)
- Bathrooms: 1 full bathroom
- Heating & cooling: Natural gas heating; Forced air heating
- Interior features: Microwave; Range; Refrigerator
- Laundry & utility: Laundry located in the basement
Neighborhood map
What this means for you Summary
Snapshot
- This is a 3-bed/1.0-bath single-family listed at $168k.
Deal economics
- At list price, monthly cash flow is $237 ($3k/yr) — positive.
- The deal already cash-flows at list — no discount required.
- To meet the 1% rule (rent ≥ 1% of price), the offer needs to be $155k (7.3% below list).
- Recommended offer: $155k (7.3% below list) — sets the bar for 1% rule.
- Cap rate 8.0% vs local median 5.3% in Fremont — top-decile yield for the area; either an underpriced asset or a hidden risk that comps aren't pricing in. Stress-test before assuming the spread holds.
Location & tenants
- Location reads 74/100 on livability (#283 in OH, #4,637 nationally) — a middle-class / working-renter tenant base. Strengths: cost of living A+, housing A+, health & safety A+; Watch: amenities F, commute F, employment F.
- Fremont City (town): math 35% / reading 44% proficiency, ranked #543 of 656 in OH (top 83%) — families likely to look elsewhere, expect single-tenant / working-renter base with shorter leases.
- Market conditions: 88 active listings in the ZIP; 2 comparable units currently listed for rent nearby; 23 units permitted in Sandusky County in 2024 (0 in 5+ unit buildings).
Forward outlook
- Local home prices are declining (-3.0%/yr); year-one equity from $1k of loan paydown is wiped out by about $5k of value loss. Plan a longer hold.
- Sandusky County population projected at -17% by 2050 — secular population decline; favor cash flow + early exit over multi-decade hold.
Negotiation context
- Only 6 days on market — expect competitive offers; lowballing is unlikely to land.
- Current owner paid $70k; list at $168k implies a 139% gain — meaningful room to come down on a strong offer.
Risks & watch-outs
- Watch-outs: built in 1900 — expect roof / HVAC / electrical / plumbing capex.
Questions for the listing agent
- Built in 1900 — when were the roof, HVAC, electrical panel, plumbing, and water heater last replaced?
- Is there a deadline driving the sale (1031 exchange, divorce, estate, relocation)? That informs how much negotiation room exists.
- Schools are B-rated — typically a magnet for longer-tenancy family renters. What's the average tenant stay here, and is there a school-zone premium baked into asking?
- What's the average days-on-market for RENTAL listings here right now (not sales)? A rising rental-DOM trend means longer vacancies and softer asking-rent achievability than the comps imply.
- What's the recent tenant-quality profile in this submarket — average credit score on applications, eviction rate, late-payment / NSF rate, and stable-employment percentage? A property-management company in the area should have these aggregated.
- How much new for-sale + rental construction is in the pipeline within 1–3 miles? Heavy new supply typically softens prices + rents 12–24 months out; constrained supply supports both.
Investment metrics
- 1% rule
- 0.93% ✗
- Cap rate
- 7.99%
- Cash-on-cash
- 6.06%
- DSCR
- 1.27
- GRM
- 9.0
CMA / ARV
- ARV (on-the-fly)
- $167,464
- Comps found
- 12
Show comp detail 12 sales within ~0.75 mi
| Address | Dist | Beds/Ba | Sqft | Sold | Price | $/sf | Match |
|---|---|---|---|---|---|---|---|
| 230 N Pennsylvania Ave | 0.29mi | 3/1.0 | 1,380 (-0%) | 7mo | $166,500 | $121 | 80 |
| 925 Woodland Blvd | 0.39mi | 3/1.0 | 1,342 (-3%) | 3mo | $197,000 | $147 | 74 |
| 921 Linden Blvd | 0.11mi | 3/1.5 | 1,496 (+8%) | 9mo | $165,000 | $110 | 72 |
| 402 Morrison St | 0.27mi | 2/1.0 (-1) | 1,442 (+4%) | 9mo | $157,000 | $109 | 68 |
| 314 N Ohio Ave | 0.43mi | 3/1.0 | 1,284 (-7%) | 3mo | $95,000 | $74 | 66 |
| 309 S Collinwood Blvd | 0.23mi | 3/2.0 | 1,248 (-10%) | 8mo | $166,000 | $133 | 62 |
| 314 N Buchanan St | 0.27mi | 3/1.0 | 1,186 (-14%) | 3mo | $95,000 | $80 | 62 |
| 442 N Ohio Ave Ave | 0.52mi | 4/1.0 (+1) | 1,414 (+2%) | 9mo | $95,000 | $67 | 60 |
| 717 Thompson St | 0.24mi | 2/2.0 (-1) | 1,248 (-10%) | 9mo | $165,000 | $132 | 56 |
| 634 4th St | 0.65mi | 3/1.5 | 1,288 (-7%) | 10mo | $127,000 | $99 | 48 |
| 1533 Greenfield Ct | 0.72mi | 3/2.0 | 1,512 (+9%) | 3mo | $240,975 | $159 | 44 |
| 800 Lawndale Dr | 0.65mi | 2/1.5 (-1) | 1,492 (+8%) | 7mo | $200,000 | $134 | 44 |
Match score weights: distance 35% · size 25% · config 20% · recency 20%. Top-matched comps best support the ARV.
Projected returns pro-forma
-3.0% appreciation · 3.0% rent growth · sell at horizon
- IRR
- -7.0%
- Equity multiple
- 0.74×
- Total profit
- $-12,146
- Equity at exit
- $24,975
- IRR
- 2.5%
- Equity multiple
- 1.18×
- Total profit
- $8,511
- Equity at exit
- $14,482
Cash invested: $46,900 (down + closing). Projections, not guarantees.
Landlord ↔ Tenant lean methodology
- Overall (STATE)
- 73 Landlord-Friendly
- State Ohio
- 73 Landlord-Friendly · R+6
- County
- — inherits STATE
- City
- — inherits STATE
ZIP-level market 43420
- Home prices YoY
- -32.4%
- Active inventory
- 88
- Price-to-rent
- 9.0×
Monthly cashflow live
- Estimated rent
- $1,552 medium interval (Pro) →
- Mortgage (P&I)
- −$878
- Tax from tax record
- −$41 /mo · $497/yr
- Insurance
- −$70
- HOA
- −$0
- Vacancy / Maint / Mgmt
- −$326
- Net cashflow
- $237
Break-even live
UW: 25.0% down · 7.5% · 30yr · 1.5% tax · 5.0% vac · 8.0% maint · 8.0% mgmt
Financing live
Cash to close
- Down payment
- $41,875
- Closing costs
- $5,025
- Reserves months
- —
- Total cash needed
- —
Loan-product check · same deal, 3 products live
Conventional
25% down · 7.5% · 30yr
- Down + closing
- —
- Monthly P&I
- —
- Monthly cashflow
- —
- DSCR
- —
- Eligible?
- —
Personal DTI + credit; lowest rate.
DSCR
20% down · 8.5% · 30yr
- Down + closing
- —
- Monthly P&I
- —
- Monthly cashflow
- —
- DSCR
- —
- Eligible?
- —
No personal income docs; deal must DSCR.
Hard money
10% down · 12.0% · 12mo
- Down + closing
- —
- Monthly P&I
- —
- Monthly cashflow
- —
- DSCR
- —
- Eligible?
- —
Short-term bridge; refi at stabilization.
Rent comps 2 comps
| Address | Beds | Baths | Sqft | Rent | $/sqft | DOM | Units | Dist |
|---|---|---|---|---|---|---|---|---|
| 1526 Sunrise Blvd Fremont, OH | 3.0 | 1.5 | 1592 | $1,750 | $1.10 | 43d | 1 | 0.59mi |
| 1335 Mosser Dr Fremont, OH | 2.0 | 1.0 | 900 | $904 | $1.00 | 12d | 1 | 1.44mi |
Listing history 6 events
-
2026-06-18days on market $167,500 Coming Soon 6 DOM
-
2026-06-17days on market $167,500 Coming Soon 5 DOM
-
2026-06-16days on market $167,500 Coming Soon 4 DOM
-
2026-06-15days on market $167,500 Coming Soon 3 DOM
-
2026-06-12remarks 488-char remark
-
2026-06-12$167,500 Coming Soon 1 DOM
ⓘ Source: listings_history table (triggers on properties + properties_extension) + one-shot
backfill from property_details.listing_events for pre-trigger history.
Tax reassessment forecast OH · Partial reset (capped growth)
- Current annual tax
- $497 · $41/mo
- Projected year-2 tax
- $1,555 · $130/mo
- Expected delta
- +$1,058/yr (+$88/mo · 213.1%)
ⓘ Screening estimate from a state-policy table — verify with the county assessor before closing.
Climate risk First Street
- Flood 3/10 Moderate FEMA zone X (unshaded) · 20% chance over 30 yrs
- Wildfire 1/10 Low
- Heat 3/10 Moderate 7 d/yr ≥99°F today · 17 d/yr by 30 yrs out
- Wind 2/10 Low
- Air quality 2/10 Low 1 unhealthy d/yr today · 1 by 30 yrs out
Nearby sold comps map
Loading sold comps map…
Walkable amenities ~0.75 mi
Loading nearby amenities…
Taxation est. · year 1
- Rental income
- $18,627
- − Mortgage interest
- −$9,383
- − Property taxes
- −$497
- − Insurance
- −$838
- − Repairs & maintenance
- −$1,490
- − Management
- −$1,490
- − Depreciation
- −$4,873
- Taxable income
- $57
- Est. tax owed @ 24.0%
- −$14
- After-tax cash flow
- $2,827/yr
For passive investors: Depreciation is non-cash, so a rental often shows a tax loss while cash-flowing — sheltering income. Rental losses are passive: they offset passive income freely, and up to $25,000/yr can offset ordinary (W-2) income if you actively participate and your MAGI is under $100k (phasing out to $0 by $150k); unused losses carry forward. On sale, claimed depreciation is recaptured at up to 25%, and gains may owe capital-gains tax (a 1031 exchange can defer both). Figures are a year-1 estimate at your 24.0% rate — not tax advice; consult a CPA.
Schools (NCES district)
- District
- Fremont City
- NCES district ID
- 3904401
- Math proficiency
- 35% ▼ -27.00%
- Reading proficiency
- 44% ▼ -13.00%
- Median HH income
- $44,046
- Composite
- 33.48/100
- National rank
- #5449
- State rank
- #543 of 656 in OH
Livability — Fremont
- Score
- 74/100
- State rank
- #283
- US rank
- #4637
Category grades
Schools grade is shown separately in the Schools card above.
Census & demographics
- Census place
- Fremont, OH
- County
- Sandusky · 51,886 people
- City population
- 29,400
- Population (ZIP)
- 29,400
- Household income
- $62,802
- Rent vs Own
- Severe rent burden
- 10.4
Population outlook (Sandusky County) Hauer SSP2
- Today (2025)
- 57,409 people
- By 2030
- 55,791 · -2.8%
- By 2040
- 51,837 · -9.7%
- By 2050
- 47,712 · -16.9%
- By 2075
- 39,908 · -30.5%
- By 2100
- 33,171 · -42.2%
Race, ethnicity, and origin ACS 2023
- Neighborhood character
- Predominantly White (76%)
- Race & ethnicity
- White 76% Hispanic / Latino 14% Two or more races 9% Black 5%
- Hispanic origin (detail)
- Mexican 12%
- Common ancestry
- Romanian 3% Lithuanian 2% Slovak 1%
- Foreign-born
- 2% · Canada
- Languages at home
- 94% English-only · Spanish 5%
Political lean MEDSL · Sandusky
- 2024 margin
- Solid R (+30.9) · D 34.1% · R 65.0%
- 2008→2024 swing
- -35.5pp toward R · 2008: 4.6pp · 2024: -30.9pp
- All cycles
- 2024: R+30.9 2020: R+27.6 2016: R+23.0 2012: D+1.9 2008: D+4.6
Not yet ingested
- Civics
- —
Market trends
- HPI YoY
- ▼ -90.51%
- Current HPI
- 188.5274
- Rent YoY
- —
- Metro
- —
- State GDP YoY
- ▲ 1.98%
- F500 in state
- 48
Industry mix (Fortune 500 HQ in OH)
| Industry | F500 HQs | Revenue |
|---|---|---|
| Insurance | 3 | $145B |
|
||
| Industrial Machinery | 3 | $49B |
|
||
| Financial Services | 3 | $24B |
|
||
| Consumer Goods | 2 | $93B |
|
||
| Aerospace / Defense | 2 | $47B |
|
||
| Utilities | 2 | $33B |
|
||
Price history
+139.3% since first listed2 events — show timeline
- 2026-06-12 Coming Soon $167,500 FAOR
- 2026-03-20 Sold (Public Records) $70,000 Public Records
Property tax history
-1.9%/yrLatest (2025): $497 · +484.3% YoY. Source: county tax records.
Cash-flow waterfall
monthlySold comps — $/sqft
last 12 mo · ≤1 miLoading sold comps…