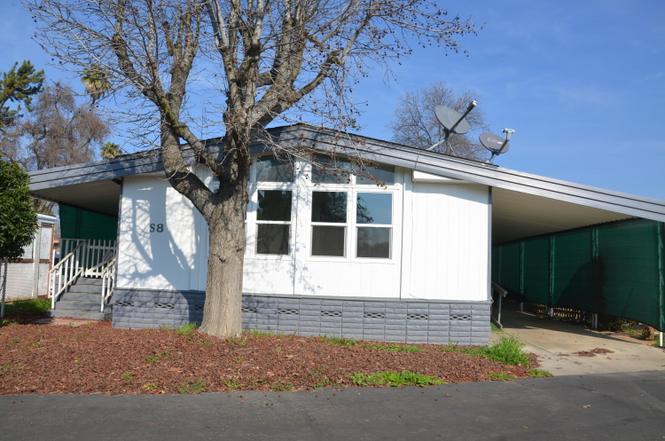
2400 W Midvalley Ave Unit S8 · Visalia, CA
Flood risk 4/10 · Minor
- FEMA flood zone
- X (shaded)
- Chance of flooding over 30 yrs
- 0.21%
- Est. flood insurance / yr
- $507 – $1,088
Fire risk 6/10 · Moderate
- Est. fire insurance / yr
- $659 – $1,223
Heat risk 8/10 · Major
- Hot days now (above 105°F)
- 7 days/yr
- Hot days in 30 yrs
- 17 days/yr
Wind risk 1/10 · Minimal
- Chance of severe wind over 30 yrs
- —
Air-quality risk 10/10 · Severe
- Unhealthy air days now
- 40 days/yr
- Unhealthy air days in 30 yrs
- 43 days/yr
Risk factors via First Street. Map © Google.
Why this score? — see what drove the B- grade
The composite is a weighted blend of 9 inputs, each scored 0–100. Each bar is that input's sub-score; the figure is the points it added to the 100-point composite (weight × sub-score).
- Cash flow +30.0/30.0
- 1% rule +10.0/10.0
- DSCR +10.0/10.0
- ARV discount +7.5/15.0
- Livability +3.6/5.0
- Rent growth +3.3/5.0
- Schools +3.0/10.0
- Condition / age +2.5/5.0
- Appreciation +0.0/10.0
$99,900
🖨 Deal sheet (PDF) 📄 Offer letter ✓ Due diligence
Listing remarks
How about the first 6 months of Space rent paid in advance?? Also, the seller may consider seller financing. Welcome to this beautifully remodeled 2-bedroom, 2-bath manufactured home located in a desirable adult community in Westlake Village. Enjoy a peaceful lifestyle surrounded by scenic lakes and ponds throughout the park, along with resort-style amenities including a clubhouse and sparkling swimming pool. This move-in-ready home features spacious living and family rooms, perfect for relaxing or entertaining. Freshly painted inside and out, the interior showcases new carpet and stylish laminate flooring throughout. The upgraded kitchen offers granite countertops, new appliances, and mode
Key facts
- Remodeled
- Clubhouse
- Swimming pool
Tags
Property features AI
Finance
- HOA & community: Community pool (private, gunite, fenced)
Exterior
- Parking: Attached covered carport
- Security: Smoke detectors; Carbon monoxide detectors
- Utilities: Natural gas available and connected; Electricity connected; 220V in laundry; Water connected (public/private/well indicated); Public sewer
- Home design: Manufactured in park (double wide manufactured home); Updated/remodeled condition; Single-story; Faces south; Vacant residential use; No common walls; Raised foundation with pillar/post/pier
- Construction: Wood siding; Composition roof; Model: Barrington; Skirt: Wood; Mobile home dimensions: 24' x 60'
- Exterior features: Awnings; Storage; Covered patio/porch; Close to clubhouse; City street frontage; Paved road; Public maintained road; Has a view; Accessible entrance with ramp
Interior
- Kitchen: Built-in gas range; Dishwasher; Garbage disposal; Gas water heater
- Flooring: Carpet; Laminate
- Bathrooms: 1 full bathroom; 1 three-quarter bathroom
- Heating & cooling: Central heating (forced air); Central air conditioning; Ceiling fans; Electric cooling
- Interior features: Ceiling fans; Granite counters; Pantry; Vaulted ceilings; Walk-in closets
- Laundry & utility: Laundry room; Washer hookup; Electric dryer hookup; Gas dryer hookup
Neighborhood map
What this means for you Summary
Snapshot
- This is a 2-bed/2.0-bath land listed at $100k.
Deal economics
- At list price, monthly cash flow is $867 ($10k/yr) — positive.
- The deal already cash-flows at list — no discount required.
- Meets the 1% rule at list price ($2k rent vs $100k).
- Recommended offer: $88k (12.0% below list) — sets the bar for market timing.
- Cap rate 16.7% vs local median 3.3% in Visalia — top-decile yield for the area; either an underpriced asset or a hidden risk that comps aren't pricing in. Stress-test before assuming the spread holds.
Location & tenants
- Location reads 72/100 on livability (#196 in CA) — a middle-class / working-renter tenant base. Strengths: commute A+, housing A+, employment B; Watch: amenities D, crime D-, cost of living F.
- Tulare Joint Union High (suburban): math 18% / reading 52% proficiency, ranked #280 of 517 in CA (top 54%) — families likely to look elsewhere, expect single-tenant / working-renter base with shorter leases.
- Market conditions: Rents rising (+3.3%/yr); 233 active listings in the ZIP; 13 comparable units currently listed for rent nearby; rentals lingering (median 45d on market — plan ~5-8 weeks vacancy on turnover, expect pricing pressure); 62% of comp listings sitting > 30 days — soft ceiling on asking rent; solid renter incomes; 1,447 units permitted in Tulare County in 2024 (307 in 5+ unit buildings).
Forward outlook
- Local home prices are declining (-3.0%/yr); year-one equity from $691 of loan paydown is wiped out by about $3k of value loss. Plan a longer hold.
- Tulare County population projected at +10% by 2050 — modest demand growth; plan on rents tracking national, not racing it.
- At projected returns (-3.0% appreciation + 3.3% rent growth), your $28k cash investment doubles in ~4 years — after that, you're playing with house money.
Negotiation context
- It's been on market 155 days — a 12% lower offer ($88k) is reasonable based on typical stale-listing flexibility.
- 4 sale attempts with the ask held roughly flat each time — persistent listings suggest the price (not the market) is what's stuck; bring a comps-based counter.
Risks & watch-outs
- Climate carrying-cost: major wildfire risk; extreme-heat days projected 7→17/yr by 2055 (HVAC capex compounding) — expect insurance premiums to compound above CPI over the hold.
Questions for the listing agent
- It's been on market 155 days. Have you received any prior offers? Is the seller open to a 12% concession, seller financing, or rate buy-down credit?
- Built in 1979 — when were the roof, HVAC, electrical panel, plumbing, and water heater last replaced?
- Why hasn't it sold? Are there any deal-killer items the seller is aware of (foundation, flood, title, zoning, code violations)?
- Is there a deadline driving the sale (1031 exchange, divorce, estate, relocation)? That informs how much negotiation room exists.
- Crime grade is D in this area — have there been break-ins, vandalism, or insurance claims at this property in the last 3 years? What carrier currently insures it and at what premium?
- What's the average days-on-market for RENTAL listings here right now (not sales)? A rising rental-DOM trend means longer vacancies and softer asking-rent achievability than the comps imply.
- What's the recent tenant-quality profile in this submarket — average credit score on applications, eviction rate, late-payment / NSF rate, and stable-employment percentage? A property-management company in the area should have these aggregated.
- How much new for-sale + rental construction is in the pipeline within 1–3 miles? Heavy new supply typically softens prices + rents 12–24 months out; constrained supply supports both.
Investment metrics
- 1% rule
- 1.97% ✓
- Cap rate
- 16.70%
- Cash-on-cash
- 37.19%
- DSCR
- 2.65
- GRM
- 4.2
CMA / ARV
No comps found within radius.
Projected returns pro-forma
-3.0% appreciation · 3.32% rent growth · sell at horizon
- IRR
- 33.5%
- Equity multiple
- 2.42×
- Total profit
- $39,684
- Equity at exit
- $14,895
- IRR
- 40.6%
- Equity multiple
- 4.88×
- Total profit
- $108,393
- Equity at exit
- $8,638
Cash invested: $27,972 (down + closing). Projections, not guarantees.
Landlord ↔ Tenant lean methodology
- Overall (STATE)
- 18 Strongly Tenant-Friendly
- State California
- 18 Strongly Tenant-Friendly · D+13
- County
- — inherits STATE
- City
- — inherits STATE
ZIP-level market 93277
- Rents YoY
- 3.3%
- Active inventory
- 233
- Price-to-rent
- 4.2×
Monthly cashflow live
- Estimated rent
- $1,971 high interval (Pro) →
- Mortgage (P&I)
- −$524
- Tax est. 1.5%
- −$125 /mo · $1,498/yr
- Insurance
- −$42
- HOA
- −$0
- Vacancy / Maint / Mgmt
- −$414
- Net cashflow
- $867
Break-even live
Sensitivity live
| Price | -10% $936 | -5% $901 | +0% $867 | +5% $832 | +10% $798 |
|---|---|---|---|---|---|
| Rent | -10% $711 | -5% $789 | +0% $867 | +5% $945 | +10% $1,022 |
| Rate | -1.0pp $917 | -0.5pp $892 | base $867 | +0.5pp $841 | +1.0pp $815 |
UW: 25.0% down · 7.5% · 30yr · 1.5% tax · 5.0% vac · 8.0% maint · 8.0% mgmt
Financing live
Cash to close
- Down payment
- $24,975
- Closing costs
- $2,997
- Reserves months
- —
- Total cash needed
- —
Loan-product check · same deal, 3 products live
Conventional
25% down · 7.5% · 30yr
- Down + closing
- —
- Monthly P&I
- —
- Monthly cashflow
- —
- DSCR
- —
- Eligible?
- —
Personal DTI + credit; lowest rate.
DSCR
20% down · 8.5% · 30yr
- Down + closing
- —
- Monthly P&I
- —
- Monthly cashflow
- —
- DSCR
- —
- Eligible?
- —
No personal income docs; deal must DSCR.
Hard money
10% down · 12.0% · 12mo
- Down + closing
- —
- Monthly P&I
- —
- Monthly cashflow
- —
- DSCR
- —
- Eligible?
- —
Short-term bridge; refi at stabilization.
Rent comps 13 comps
| Address | Beds | Baths | Sqft | Rent | $/sqft | DOM | Units | Dist |
|---|---|---|---|---|---|---|---|---|
| 3940 S Shady Ct Unit 123 Visalia, CA | 2.0 | 1.0 | 910 | $1,695 | $1.86 | 44d | 1 | 0.38mi |
| 3940 S Shady Ct Apt 107 Visalia, CA | 2.0 | 2.0 | 950 | $1,695 | $1.78 | 44d | 1 | 0.38mi |
| 3919 S Sallee Ct Visalia, CA | 3.0 | 2.0 | 1642 | $2,400 | $1.46 | 22d | 1 | 0.38mi |
| 3940 S Shady Ct Apt 223 Visalia, CA | 2.0 | 2.0 | 910 | $1,950 | $2.14 | 44d | 1 | 0.39mi |
| 2546 W Victor Ct Unit 102 Visalia, CA | 3.0 | 2.0 | 1200 | $1,995 | $1.66 | 44d | 1 | 0.81mi |
| 3837 W Rialto Ave Visalia, CA | 3.0 | 2.0 | 1475 | $2,100 | $1.42 | 44d | 1 | 0.85mi |
| 3909 W Nellis Ave Visalia, CA | 3.0 | 2.0 | 1475 | $2,100 | $1.42 | 22d | 1 | 0.88mi |
| 3922 W Nellis Ave Visalia, CA | 3.0 | 2.0 | 1475 | $2,500 | $1.69 | 44d | 1 | 0.88mi |
| 2704 W Whitendale Ave Visalia, CA | 3.0 | 2.0 | 1583 | $1,895 | $1.20 | 22d | 1 | 1.10mi |
| 1917 W Whitendale Ave Unit 1917 Visalia, CA | 2.0 | 2.0 | 1048 | $1,295 | $1.24 | 44d | 1 | 1.11mi |
| 1107 W Victor Ave Visalia, CA | 3.0 | 2.0 | 1710 | $2,500 | $1.46 | 14d | 1 | 1.18mi |
| 3618 W Country Ave Visalia, CA | 3.0 | 2.0 | 1618 | $2,095 | $1.29 | 44d | 1 | 1.32mi |
| 324 W Kimball Ave Visalia, CA | 3.0 | 2.0 | 1297 | $2,500 | $1.93 | 14d | 1 | 1.46mi |
Listing history 25 events
-
2026-06-18days on market $99,900 Active 155 DOM
-
2026-06-17days on market $99,900 Active 154 DOM
-
2026-06-16days on market $99,900 Active 153 DOM
-
2026-06-15days on market $99,900 Active 152 DOM
-
2026-06-14days on market $99,900 Active 150 DOM
-
2026-06-13days on market $99,900 Active 149 DOM
-
2026-06-10days on market $99,900 Active 147 DOM
-
2026-06-09days on market $99,900 Active 146 DOM
-
2026-06-08days on market $99,900 Active 145 DOM
-
2026-06-07days on market $99,900 Active 144 DOM
-
2026-06-03days on market $99,900 Active 140 DOM
-
2026-06-02days on market $99,900 Active 139 DOM
-
2026-06-01days on market $99,900 Active 138 DOM
-
2026-05-31days on market $99,900 Active 137 DOM
-
2026-05-30days on market $99,900 Active 136 DOM
-
2026-01-14$99,900 Active
-
2025-11-04historical
-
2025-09-05price $94,900
-
2025-09-05price $94,900
-
2025-08-06price $99,900
-
2025-08-06price $99,900
-
2025-07-16$109,500 Active
-
2025-06-26price $109,500
-
2025-05-01$119,900 Active
-
2025-05-01$119,900 Active
ⓘ Source: listings_history table (triggers on properties + properties_extension) + one-shot
backfill from property_details.listing_events for pre-trigger history.
Climate risk First Street
- Flood 4/10 Moderate FEMA zone X (shaded) · 21% chance over 30 yrs
- Wildfire 6/10 Major
- Heat 8/10 Severe 7 d/yr ≥105°F today · 17 d/yr by 30 yrs out
- Wind 1/10 Low
- Air quality 10/10 Extreme 40 unhealthy d/yr today · 43 by 30 yrs out
Nearby sold comps map
Loading sold comps map…
Walkable amenities ~0.75 mi
Loading nearby amenities…
Taxation est. · year 1
- Rental income
- $23,653
- − Mortgage interest
- −$5,596
- − Property taxes
- −$1,498
- − Insurance
- −$500
- − Repairs & maintenance
- −$1,892
- − Management
- −$1,892
- − Depreciation
- −$2,906
- Taxable income
- $9,369
- Est. tax owed @ 24.0%
- −$2,248
- After-tax cash flow
- $8,153/yr
For passive investors: Depreciation is non-cash, so a rental often shows a tax loss while cash-flowing — sheltering income. Rental losses are passive: they offset passive income freely, and up to $25,000/yr can offset ordinary (W-2) income if you actively participate and your MAGI is under $100k (phasing out to $0 by $150k); unused losses carry forward. On sale, claimed depreciation is recaptured at up to 25%, and gains may owe capital-gains tax (a 1031 exchange can defer both). Figures are a year-1 estimate at your 24.0% rate — not tax advice; consult a CPA.
Schools (NCES district)
- District
- Tulare Joint Union High
- NCES district ID
- 0639930
- Math proficiency
- 18% ▼ -6.00%
- Reading proficiency
- 52% ▼ -1.00%
- Median HH income
- $46,858
- Composite
- 29.91/100
- National rank
- #6384
- State rank
- #280 of 517 in CA
Livability — Visalia
- Score
- 72/100
- State rank
- #196
- US rank
- #6351
Category grades
Schools grade is shown separately in the Schools card above.
Census & demographics
- Census place
- Visalia, CA
- County
- Tulare County · 323,826 people
- City population
- 163,333
- Metro
- Visalia, CA
- Population (ZIP)
- 53,985
- Household income
- $80,548
- Rent vs Own
- Severe rent burden
- 1896.0
Population outlook (Tulare County) Hauer SSP2
- Today (2025)
- 484,681 people
- By 2030
- 496,241 · +2.4%
- By 2040
- 518,507 · +7.0%
- By 2050
- 534,920 · +10.4%
- By 2075
- 548,417 · +13.2%
- By 2100
- 513,085 · +5.9%
Race, ethnicity, and origin ACS 2023
- Neighborhood character
- Diverse neighborhood (Simpson 0.60)
- Race & ethnicity
- Hispanic / Latino 48% White 40% Two or more races 21% Asian 4% Black 2% Native American 2%
- Hispanic origin (detail)
- Mexican 44%
- Common ancestry
- Russian 3% Iranian 2% Italian 2%
- Foreign-born
- 12% · Canada, China
- Languages at home
- 73% English-only · Spanish 22% Chinese 2% Other Asian/Pacific 1%
Political lean MEDSL · Tulare
- 2024 margin
- Strong R (+20.7) · D 38.5% · R 59.2% · Other 2.3%
- 2008→2024 swing
- -5.4pp toward R · 2008: -15.3pp · 2024: -20.7pp
- All cycles
- 2024: R+20.7 2020: R+7.8 2016: R+12.1 2012: R+17.8 2008: R+15.3
Not yet ingested
- Civics
- —
Market trends
- HPI YoY
- ▼ -371.43%
- Current HPI
- 310.349
- Rent YoY
- ▲ 3.32%
- Metro
- Visalia, CA
- State GDP YoY
- ▲ 3.21%
- F500 in state
- 116
Industry mix (Fortune 500 HQ in CA)
| Industry | F500 HQs | Revenue |
|---|---|---|
| Technology | 27 | $1,492B |
|
||
| Financial Services | 3 | $174B |
|
||
| Retail | 3 | $44B |
|
||
| Insurance | 3 | $26B |
|
||
| Media / Entertainment | 2 | $115B |
|
||
| Pharmaceuticals / Biotech | 2 | $62B |
|
||
Price history
-16.7% since first listed10 events — show timeline
- 2026-01-14 Listed $99,900 TCMLS
- 2025-11-04 Listing Removed — CRMLS
- 2025-09-05 Price Changed $94,900 CRMLS
- 2025-09-05 Price Changed $94,900 TCMLS
- 2025-08-06 Price Changed $99,900 CRMLS
- 2025-08-06 Price Changed $99,900 TCMLS
- 2025-07-16 Listed $109,500 CRMLS
- 2025-06-26 Price Changed $109,500 TCMLS
- 2025-05-01 Listed $119,900 FRESNOMLS
- 2025-05-01 Listed $119,900 TCMLS
Property tax history
-3.3%/yrLatest (2021): $60 · -3.1% YoY. Source: county tax records.
Cash-flow waterfall
monthlySold comps — $/sqft
last 12 mo · ≤1 miLoading sold comps…