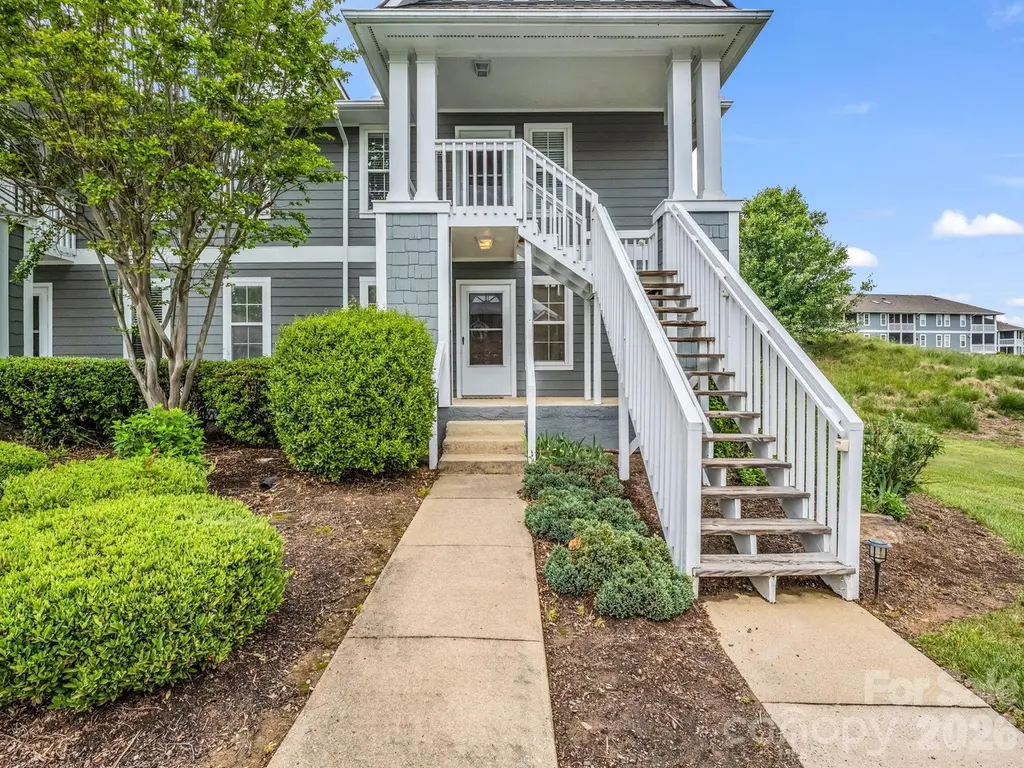
3005 Sagamore Ln · Asheville, NC
Flood risk 1/10 · Minimal
- FEMA flood zone
- X (unshaded)
- Chance of flooding over 30 yrs
- 0.0%
- Est. flood insurance / yr
- $507 – $1,088
Fire risk 3/10 · Minor
- Est. fire insurance / yr
- $906 – $1,684
Heat risk 4/10 · Minor
- Hot days now (above 97°F)
- 9 days/yr
- Hot days in 30 yrs
- 24 days/yr
Wind risk 2/10 · Minimal
- Chance of severe wind over 30 yrs
- —
Air-quality risk 3/10 · Minor
- Unhealthy air days now
- 3 days/yr
- Unhealthy air days in 30 yrs
- 3 days/yr
Risk factors via First Street. Map © Google.
Why this score? — see what drove the D- grade
The composite is a weighted blend of 9 inputs, each scored 0–100. Each bar is that input's sub-score; the figure is the points it added to the 100-point composite (weight × sub-score).
- ARV discount +14.5/15.0
- Cash flow +7.3/30.0
- Schools +4.0/10.0
- Livability +3.6/5.0
- Rent growth +3.0/5.0
- 1% rule +2.9/10.0
- Condition / age +2.5/5.0
- DSCR +1.4/10.0
- Appreciation +0.0/10.0
$215,000
🖨 Deal sheet (PDF) 📄 Offer letter ✓ Due diligence
Listing remarks
Experience the perfect blend of comfort and convenience in this 2BR/2BA Biltmore Commons retreat. Featuring light filled space and a private screened in porch with serene views, this home offers a premier "lock-and-leave" lifestyle. Enjoy amenities including a heated pool, tennis courts and a fitness area-all within a secure gated community just minutes from downtown Asheville and the Blue Ridge Parkway. This condo is the lowest priced opportunity to join this coveted community. While the home needs some TLC and cosmetic updates, it offers a blank canvas for you to bring your vision to life while hopefully building instant equity. Bonus - end unit on the ground floor!
Key facts
- Gated community
- Fitness area
- End unit
Tags
Property features AI
Finance
- Other: Zoning: RM6; Development completed; Land not included; Rental restrictions apply; see community rules
- HOA & community: HOA present; mandatory monthly dues ($293/month); Community clubhouse; Fitness center; Outdoor pool; Tennis courts; Street lights; Pets allowed with conditions; cat(s) allowed (number limits apply)
Exterior
- Parking: 2 assigned parking spaces in a parking lot
- Utilities: City water; Public sewer; Electricity connected; Underground utilities
- Home design: Residential condominium; Site-built construction; One story; Entry level 1
- Construction: Fiber cement exterior; Crawl space foundation
- Exterior features: Covered rear porch with screened area; In-ground outdoor private pool; Asphalt-paved roads on private maintained road
Interior
- Kitchen: Dishwasher; Disposal; Electric range; Microwave; Oven; Refrigerator
- Bedrooms: 2 bedrooms on the main level
- Bathrooms: 2 full bathrooms on the main level
- Heating & cooling: Central heating; Central air conditioning; Gas-log fireplace
- Interior features: 8 total rooms; Main-level entry
- Laundry & utility: Washer and dryer in unit; Laundry located in hall on main level; Gas water heater
Neighborhood map
What this means for you Summary
Snapshot
- This is a 2-bed/2.0-bath condo listed at $215k.
Deal economics
- At list price, monthly cash flow is $-291 ($-3k/yr) — negative.
- To cash-flow at today's rent, offer at most $164k (23.9% below list).
- To meet the 1% rule (rent ≥ 1% of price), the offer needs to be $169k (21.2% below list).
- Recommended offer: $164k (23.9% below list) — sets the bar for cash-flow.
- Cap rate 4.7% vs local median 2.5% in Asheville — top-decile yield for the area; either an underpriced asset or a hidden risk that comps aren't pricing in. Stress-test before assuming the spread holds.
Location & tenants
- Location reads 72/100 on livability (#96 in NC) — a middle-class / working-renter tenant base. Strengths: commute A+, health & safety A+, housing A-; Watch: crime F.
- Buncombe County Schools (suburban): math 45% / reading 50% proficiency, ranked #72 of 178 in NC (top 40%) — families likely to look elsewhere, expect single-tenant / working-renter base with shorter leases.
- Zoned schools: Sand Hill-Venable Elem (math 38% / reading 43%, grade F, #682 of 1,410 statewide, top 49%, 534 students, 77% FRL); Enka Middle (math 39% / reading 50%, grade D, #169 of 475 statewide, top 37%, 602 students, 65% FRL); Enka High (math 77% / reading 63%, grade B+, #119 of 535 statewide, top 22%, 1,045 students, 58% FRL) — zoned schools average 67% FRL vs 47% district-wide (19 pts higher); higher-poverty schools than district average — tighter screening recommended.
- Market conditions: Rents rising (+2.1%/yr); 333 active listings in the ZIP; 4 comparable units currently listed for rent nearby; rentals lingering (median 46d on market — plan ~5-8 weeks vacancy on turnover, expect pricing pressure); 50% of comp listings sitting > 30 days — soft ceiling on asking rent; 3,305 units permitted in Buncombe County in 2024 (1,855 in 5+ unit buildings).
- This rent runs 32% of the median local income ($63k/yr) — at the standard rent-burdened threshold; future hikes will face affordability resistance.
Forward outlook
- Local home prices are declining (-3.0%/yr); year-one equity from $1k of loan paydown is wiped out by about $6k of value loss. Plan a longer hold.
- Buncombe County population projected at +24% by 2050 — long-run rental-demand tailwind backs the buy-and-hold thesis.
Negotiation context
- It's been on market 40 days — a 3% lower offer ($209k) is reasonable based on typical stale-listing flexibility.
- 2 sale attempts with the ask held roughly flat each time — persistent listings suggest the price (not the market) is what's stuck; bring a comps-based counter.
- Current owner paid $92k; list at $215k implies a 132% gain — meaningful room to come down on a strong offer.
Questions for the listing agent
- What do current leases actually rent for vs. the listed asking? Can we see a recent rent roll and the last 12 months of T-12 income?
- It's been on market 40 days. Have you received any prior offers? Is the seller open to a 24% concession, seller financing, or rate buy-down credit?
- What does the HOA fee cover, when was the last increase, and are there any pending special assessments or reserve-fund shortfalls?
- Any open or pending special assessments — roof, HVAC, plumbing, elevator, façade? What's the per-unit balance and payoff schedule, and is the seller paying it off at close or rolling it to the buyer?
- Is there a deadline driving the sale (1031 exchange, divorce, estate, relocation)? That informs how much negotiation room exists.
- Schools are B-rated — typically a magnet for longer-tenancy family renters. What's the average tenant stay here, and is there a school-zone premium baked into asking?
- Crime grade is F in this area — have there been break-ins, vandalism, or insurance claims at this property in the last 3 years? What carrier currently insures it and at what premium?
- The area grade is low — what's the realistic commute time and amenity access for the typical tenant pool here? Any planned neighborhood developments (good or bad) we should know about?
- What's the average days-on-market for RENTAL listings here right now (not sales)? A rising rental-DOM trend means longer vacancies and softer asking-rent achievability than the comps imply.
- What's the recent tenant-quality profile in this submarket — average credit score on applications, eviction rate, late-payment / NSF rate, and stable-employment percentage? A property-management company in the area should have these aggregated.
- How much new apartment / multifamily construction is in the pipeline within 1–3 miles? Heavy new supply (>2% of stock underway) typically softens rents 12–24 months out; light construction supports rent growth.
Investment metrics
- 1% rule
- 0.79% ✗
- Cap rate
- 4.67%
- Cash-on-cash
- -5.80%
- DSCR
- 0.74
- GRM
- 10.6
CMA / ARV
- ARV (median comp)
- $254,292
- List price
- $215,000
- Delta
- -15.45%
- Verdict
- UNDERPRICED
- Comps
- 20 within 1.0 mi
Projected returns pro-forma
-3.0% appreciation · 2.06% rent growth · sell at horizon
- IRR
- -27.3%
- Equity multiple
- 0.09×
- Total profit
- $-54,847
- Equity at exit
- $32,057
- IRR
- -29.3%
- Equity multiple
- -0.29×
- Total profit
- $-77,554
- Equity at exit
- $18,589
Cash invested: $60,200 (down + closing). Projections, not guarantees.
Landlord ↔ Tenant lean methodology
- Overall (STATE)
- 85 Strongly Landlord-Friendly
- State North Carolina
- 85 Strongly Landlord-Friendly · R+3
- County
- — inherits STATE
- City
- — inherits STATE
ZIP-level market 28806
- Rents YoY
- 2.1%
- Active inventory
- 333
- Price-to-rent
- 10.6×
Monthly cashflow live
- Estimated rent
- $1,694 medium interval (Pro) →
- Mortgage (P&I)
- −$1,127
- Tax from tax record
- −$119 /mo · $1,428/yr
- Insurance
- −$90
- HOA
- −$293
- Vacancy / Maint / Mgmt
- −$356
- Net cashflow
- $-291
Break-even live
Sensitivity live
| Price | -10% $-169 | -5% $-230 | +0% $-291 | +5% $-352 | +10% $-413 |
|---|---|---|---|---|---|
| Rent | -10% $-425 | -5% $-358 | +0% $-291 | +5% $-224 | +10% $-157 |
| Rate | -1.0pp $-183 | -0.5pp $-236 | base $-291 | +0.5pp $-347 | +1.0pp $-403 |
UW: 25.0% down · 7.5% · 30yr · 1.5% tax · 5.0% vac · 8.0% maint · 8.0% mgmt
Financing live
Cash to close
- Down payment
- $53,750
- Closing costs
- $6,450
- Reserves months
- —
- Total cash needed
- —
Loan-product check · same deal, 3 products live
Conventional
25% down · 7.5% · 30yr
- Down + closing
- —
- Monthly P&I
- —
- Monthly cashflow
- —
- DSCR
- —
- Eligible?
- —
Personal DTI + credit; lowest rate.
DSCR
20% down · 8.5% · 30yr
- Down + closing
- —
- Monthly P&I
- —
- Monthly cashflow
- —
- DSCR
- —
- Eligible?
- —
No personal income docs; deal must DSCR.
Hard money
10% down · 12.0% · 12mo
- Down + closing
- —
- Monthly P&I
- —
- Monthly cashflow
- —
- DSCR
- —
- Eligible?
- —
Short-term bridge; refi at stabilization.
Rent comps 4 comps
| Address | Beds | Baths | Sqft | Rent | $/sqft | DOM | Units | Dist |
|---|---|---|---|---|---|---|---|---|
| 24 Triple H Dr Unit C Asheville, NC | 1.0 | 1.0 | 730 | $1,150 | $1.58 | 45d | 1 | 0.63mi |
| 26 Triple H Dr Unit A Asheville, NC | 2.0 | 2.0 | 880 | $1,700 | $1.93 | 45d | 1 | 0.63mi |
| 115 Featherdown Way Asheville, NC | 1.0–3.0 | 1.0–2.0 | 1108 | $1,764 | $1.59 | 16d | 23 | 0.88mi |
| 125 River Birch Grove Rd Asheville, NC | 1.0–3.0 | 1.0–2.0 | 1127 | $2,464 | $2.18 | 16d | 51 | 1.30mi |
HOA detail condo
- Monthly dues
- $293 · $3,516/yr
- Likely covers
- poolsecurity
- Assessments
- None detected in remarks — confirm with the listing agent.
Listing history 18 events
-
2026-06-22days on market $215,000 Active 40 DOM
-
2026-06-18days on market $215,000 Active 37 DOM
-
2026-06-17days on market $215,000 Active 36 DOM
-
2026-06-16days on market $215,000 Active 35 DOM
-
2026-06-15days on market $215,000 Active 34 DOM
-
2026-06-14days on market $215,000 Active 32 DOM
-
2026-06-10days on market $215,000 Active 29 DOM
-
2026-06-09days on market $215,000 Active 28 DOM
-
2026-06-08days on market $215,000 Active 27 DOM
-
2026-06-07days on market $215,000 Active 26 DOM
-
2026-06-03days on market $215,000 Active 22 DOM
-
2026-06-02days on market $215,000 Active 21 DOM
-
2026-06-01days on market $215,000 Active 20 DOM
-
2026-06-01status $215,000 Active 19 DOM
-
2026-05-31days on market $215,000 Active Under Contract 19 DOM
-
2026-05-30days on market $215,000 Active Under Contract 18 DOM
-
2026-05-12$215,000 Active 686-char remark
-
2002-05-03soldstatus $92,500
ⓘ Source: listings_history table (triggers on properties + properties_extension) + one-shot
backfill from property_details.listing_events for pre-trigger history.
Tax reassessment forecast NC · Resets to sale price
- Current annual tax
- $1,428 · $119/mo
- Projected year-2 tax
- $1,763 · $147/mo
- Expected delta
- +$335/yr (+$28/mo · 23.4%)
ⓘ Screening estimate from a state-policy table — verify with the county assessor before closing.
Climate risk First Street
- Flood 1/10 Low FEMA zone X (unshaded) · 0% chance over 30 yrs
- Wildfire 3/10 Moderate
- Heat 4/10 Moderate 9 d/yr ≥97°F today · 24 d/yr by 30 yrs out
- Wind 2/10 Low
- Air quality 3/10 Moderate 3 unhealthy d/yr today · 3 by 30 yrs out
Nearby sold comps map
Loading sold comps map…
Walkable amenities ~0.75 mi
Loading nearby amenities…
Taxation est. · year 1
- Rental income
- $20,326
- − Mortgage interest
- −$12,043
- − Property taxes
- −$1,428
- − Insurance
- −$1,075
- − Repairs & maintenance
- −$1,626
- − Management
- −$1,626
- − HOA
- −$3,516
- − Depreciation
- −$6,255
- Taxable loss
- −$7,244
- Est. tax savings @ 24.0%
- +$1,739
- After-tax cash flow
- $-1,753/yr
For passive investors: Depreciation is non-cash, so a rental often shows a tax loss while cash-flowing — sheltering income. Rental losses are passive: they offset passive income freely, and up to $25,000/yr can offset ordinary (W-2) income if you actively participate and your MAGI is under $100k (phasing out to $0 by $150k); unused losses carry forward. On sale, claimed depreciation is recaptured at up to 25%, and gains may owe capital-gains tax (a 1031 exchange can defer both). Figures are a year-1 estimate at your 24.0% rate — not tax advice; consult a CPA.
Schools (NCES district)
- District
- Buncombe County Schools
- NCES district ID
- 3700450
- Math proficiency
- 45% ▬ 0.00%
- Reading proficiency
- 50% ▲ 2.00%
- Median HH income
- $45,981
- Composite
- 40.32/100
- National rank
- #3749
- State rank
- #72 of 178 in NC
Livability — Asheville
- Score
- 72/100
- State rank
- #96
- US rank
- #6307
Category grades
Schools grade is shown separately in the Schools card above.
Census & demographics
- Census place
- Asheville, NC
- County
- Buncombe County · 241,085 people
- City population
- 137,611
- Metro
- Asheville, NC
- Population (ZIP)
- 43,433
- Household income
- $63,273
- Rent vs Own
- Severe rent burden
- 1783.0
Population outlook (Buncombe County) Hauer SSP2
- Today (2025)
- 286,475 people
- By 2030
- 302,237 · +5.5%
- By 2040
- 330,687 · +15.4%
- By 2050
- 356,370 · +24.4%
- By 2075
- 409,383 · +42.9%
- By 2100
- 437,270 · +52.6%
Race, ethnicity, and origin ACS 2023
- Neighborhood character
- Predominantly White (77%)
- Race & ethnicity
- White 77% Hispanic / Latino 11% Two or more races 9% Black 6% Asian 2%
- Hispanic origin (detail)
- Mexican 6%
- Common ancestry
- Serbian 3% Slovak 3% Italian 3%
- Foreign-born
- 10% · Canada, China
- Languages at home
- 86% English-only · Spanish 9% Russian/Polish/Slavic 3% Other Indo-European 2%
Political lean MEDSL · Buncombe
- 2024 margin
- Strong D (+24.8) · D 61.7% · R 36.9% · Other 1.4%
- 2008→2024 swing
- +10.9pp toward D · 2008: 13.9pp · 2024: 24.8pp
- All cycles
- 2024: D+24.8 2020: D+21.1 2016: D+14.6 2012: D+12.4 2008: D+13.9
Not yet ingested
- Civics
- —
Market trends
- HPI YoY
- ▼ -271.16%
- Current HPI
- 350.3071
- Rent YoY
- ▲ 2.06%
- Metro
- Asheville, NC
- State GDP YoY
- ▲ 3.28%
- F500 in state
- 26
Industry mix (Fortune 500 HQ in NC)
| Industry | F500 HQs | Revenue |
|---|---|---|
| Financial Services | 2 | $213B |
|
||
| Retail | 2 | $95B |
|
||
| Industrial Conglomerate | 1 | $38B |
|
||
| Metals / Steel | 1 | $35B |
|
||
| Utilities | 1 | $30B |
|
||
| Industrial Machinery | 1 | $19B |
|
||
Price history
+132.4% since first listed4 events — show timeline
- 2026-05-31 Relisted — CANOPYMLS as Distributed by MLS Grid
- 2026-05-19 Contingent — CANOPYMLS as Distributed by MLS Grid
- 2026-05-12 Listed $215,000 CANOPYMLS as Distributed by MLS Grid
- 2002-05-03 Sold (Public Records) $92,500 Public Records
Property tax history
+1.9%/yrLatest (2025): $1,428 · -10.5% YoY. Source: county tax records.
Cash-flow waterfall
monthlySold comps — $/sqft
last 12 mo · ≤1 miLoading sold comps…