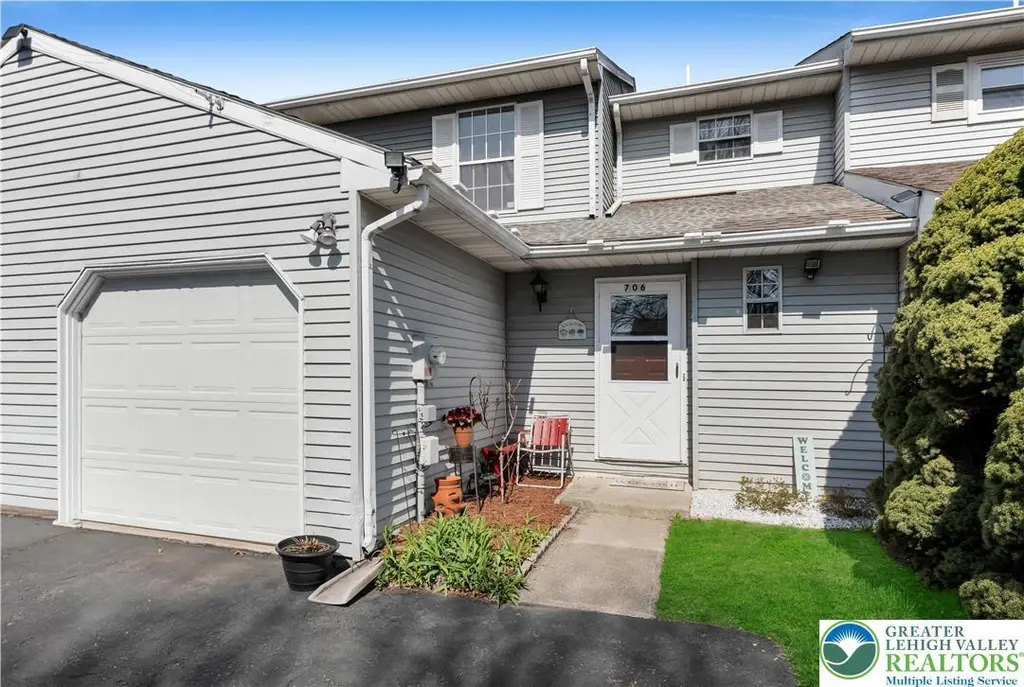
706 Overlook Dr · Bethlehem, PA
Flood risk 1/10 · Minimal
- FEMA flood zone
- X (unshaded)
- Chance of flooding over 30 yrs
- 0.0%
- Est. flood insurance / yr
- $473 – $860
Fire risk 1/10 · Minimal
- Est. fire insurance / yr
- $511 – $949
Heat risk 5/10 · Moderate
- Hot days now (above 99°F)
- 7 days/yr
- Hot days in 30 yrs
- 15 days/yr
Wind risk 4/10 · Minor
- Chance of severe wind over 30 yrs
- 20.0%
Air-quality risk 3/10 · Minor
- Unhealthy air days now
- 2 days/yr
- Unhealthy air days in 30 yrs
- 5 days/yr
Risk factors via First Street. Map © Google.
Why this score? — see what drove the C- grade
The composite is a weighted blend of 9 inputs, each scored 0–100. Each bar is that input's sub-score; the figure is the points it added to the 100-point composite (weight × sub-score).
- Cash flow +15.4/30.0
- ARV discount +15.0/15.0
- DSCR +4.7/10.0
- Livability +4.1/5.0
- 1% rule +4.0/10.0
- Schools +3.5/10.0
- Rent growth +3.2/5.0
- Condition / age +2.5/5.0
- Appreciation +0.0/10.0
$283,500
🖨 Deal sheet 📄 Offer letter ✓ Due diligence
Listing remarks MLS
This Townhouse Has Neutral Carpeting Installed Less Than 2 Years, Home Has Been Well Maintained & Offers 3-bedrooms, 1-1/2 Baths, 1-car Garage & Is Close To Rte 22. Also Has Full Basement. Electric Bills Average $50- $60 During The Summer And $90-$120 During The Winter.
Key facts
- Outdoor pool
- Private balcony
- Walking paths
Tags
Neighborhood map
What this means for you Summary
Snapshot
- This is a 3-bed/1.5-bath single-family listed at $284k.
Deal economics
- At list price, monthly cash flow is $109 ($1k/yr) — positive.
- The deal already cash-flows at list — no discount required.
- To meet the 1% rule (rent ≥ 1% of price), the offer needs to be $255k (9.9% below list).
- Recommended offer: $255k (9.9% below list) — sets the bar for 1% rule.
- Cap rate 6.8% vs local median 4.3% in Bethlehem — top-decile yield for the area; either an underpriced asset or a hidden risk that comps aren't pricing in. Stress-test before assuming the spread holds.
Location & tenants
- Location reads 82/100 on livability (#138 in PA, #1,122 nationally) — a professional / high-income tenant draw. Strengths: amenities A+, cost of living A+, housing A+; Watch: commute F.
- Bethlehem Area SD (urban): math 31% / reading 49% proficiency, ranked #342 of 539 in PA (top 64%) — families likely to look elsewhere, expect single-tenant / working-renter base with shorter leases.
- Market conditions: Rents rising (+2.6%/yr); 153 active listings in the ZIP; 9 comparable units currently listed for rent nearby; rentals at typical pace (median 21d on market — plan ~3-4 weeks tenant-placement turnaround); solid renter incomes; 567 units permitted in Northampton County in 2024 (151 in 5+ unit buildings).
- This rent runs 34% of the median local income ($91k/yr) — at the standard rent-burdened threshold; future hikes will face affordability resistance.
Forward outlook
- Local home prices are declining (-3.0%/yr); year-one equity from $2k of loan paydown is wiped out by about $9k of value loss. Plan a longer hold.
Negotiation context
- Only 10 days on market — expect competitive offers; lowballing is unlikely to land.
- 3 sale attempts since 26y ago with the ask held roughly flat each time — persistent listings suggest the price (not the market) is what's stuck; bring a comps-based counter.
- Current owner paid $91k; list at $284k implies a 212% gain — meaningful room to come down on a strong offer.
Risks & watch-outs
- Climate carrying-cost: extreme-heat days projected 7→15/yr by 2055 (HVAC capex compounding) — expect insurance premiums to compound above CPI over the hold.
Questions for the listing agent
- Is there a deadline driving the sale (1031 exchange, divorce, estate, relocation)? That informs how much negotiation room exists.
- Schools are B-rated — typically a magnet for longer-tenancy family renters. What's the average tenant stay here, and is there a school-zone premium baked into asking?
- What's the average days-on-market for RENTAL listings here right now (not sales)? A rising rental-DOM trend means longer vacancies and softer asking-rent achievability than the comps imply.
- What's the recent tenant-quality profile in this submarket — average credit score on applications, eviction rate, late-payment / NSF rate, and stable-employment percentage? A property-management company in the area should have these aggregated.
- How much new for-sale + rental construction is in the pipeline within 1–3 miles? Heavy new supply typically softens prices + rents 12–24 months out; constrained supply supports both.
Investment metrics
- 1% rule
- 0.90% ✗
- Cap rate
- 6.75%
- Cash-on-cash
- 1.65%
- DSCR
- 1.07
- GRM
- 9.3
CMA / ARV
- ARV (on-the-fly)
- $382,480
- Comps found
- 5
Show comp detail 5 sales within ~0.75 mi
| Address | Dist | Beds/Ba | Sqft | Sold | Price | $/sf | Match |
|---|---|---|---|---|---|---|---|
| 1385 W Macada Rd | 0.66mi | 3/1.5 | 1,350 (-1%) | 2mo | $378,000 | $280 | 66 |
| 1410 Stoke Park Rd | 0.47mi | 3/2.5 | 1,505 (+10%) | 8mo | $340,000 | $226 | 51 |
| 1560 Chaucer Ln | 0.68mi | 3/2.0 | 1,496 (+10%) | 7mo | $361,000 | $241 | 44 |
| 1440 Oakwood Dr | 0.73mi | 3/3.0 | 1,368 (+0%) | 23mo | $510,000 | $373 | 40 |
| 1369 Woodland Cir | 0.56mi | 3/2.0 | 1,504 (+10%) | 19mo | $440,000 | $293 | 39 |
Match score weights: distance 35% · size 25% · config 20% · recency 20%. Top-matched comps best support the ARV.
Projected returns pro-forma
-3.0% appreciation · 2.6% rent growth · sell at horizon
- IRR
- -14.1%
- Equity multiple
- 0.50×
- Total profit
- $-40,010
- Equity at exit
- $42,271
- IRR
- -6.0%
- Equity multiple
- 0.62×
- Total profit
- $-30,034
- Equity at exit
- $24,512
Cash invested: $79,380 (down + closing). Projections, not guarantees.
Landlord ↔ Tenant lean methodology
- Overall (STATE)
- 62 Landlord-Friendly
- State Pennsylvania
- 62 Landlord-Friendly · EVEN
- County
- — inherits STATE
- City
- — inherits STATE
ZIP-level market 18017
- Rents YoY
- 2.6%
- Active inventory
- 153
- Price-to-rent
- 9.3×
Monthly cashflow live
- Estimated rent
- $2,553 high interval (Pro) →
- Mortgage (P&I)
- −$1,487
- Tax from tax record
- −$303 /mo · $3,640/yr
- Insurance
- −$118
- HOA
- −$0
- Vacancy / Maint / Mgmt
- −$536
- Net cashflow
- $109
Break-even live
UW: 25.0% down · 7.5% · 30yr · 1.5% tax · 5.0% vac · 8.0% maint · 8.0% mgmt
Financing live
Cash to close
- Down payment
- $70,875
- Closing costs
- $8,505
- Reserves months
- —
- Total cash needed
- —
Loan-product check · same deal, 3 products live
Conventional
25% down · 7.5% · 30yr
- Down + closing
- —
- Monthly P&I
- —
- Monthly cashflow
- —
- DSCR
- —
- Eligible?
- —
Personal DTI + credit; lowest rate.
DSCR
20% down · 8.5% · 30yr
- Down + closing
- —
- Monthly P&I
- —
- Monthly cashflow
- —
- DSCR
- —
- Eligible?
- —
No personal income docs; deal must DSCR.
Hard money
10% down · 12.0% · 12mo
- Down + closing
- —
- Monthly P&I
- —
- Monthly cashflow
- —
- DSCR
- —
- Eligible?
- —
Short-term bridge; refi at stabilization.
Rent comps 9 comps
| Address | Beds | Baths | Sqft | Rent | $/sqft | DOM | Units | Dist |
|---|---|---|---|---|---|---|---|---|
| 1590 Winthrop Ave Bethlehem, PA | 4.0 | 2.5 | 1850 | $2,550 | $1.38 | 43d | 1 | 0.69mi |
| 1160 Brentwood Ave Bethlehem, PA | 4.0 | 2.5 | 1712 | $3,200 | $1.87 | 2d | 1 | 0.92mi |
| 3071 Athena Dr Bethlehem, PA | 2.0 | 2.0 | 1848 | $2,800 | $1.52 | 43d | 1 | 1.24mi |
| 4613 Cheryl Dr Bethlehem, PA | 2.0 | 2.0 | 1134 | $2,200 | $1.94 | 14d | 1 | 1.28mi |
| 2104 Westgate Dr Bethlehem, PA | 1.0–2.0 | 1.0 | 795 | $1,620 | $2.04 | 2d | 5 | 1.31mi |
| 4747 Cheryl Dr Bethlehem, PA | 2.0 | 2.0 | 1134 | $2,200 | $1.94 | 21d | 1 | 1.34mi |
| 5143 Cheryl Dr Unit 5143 Bethlehem, PA | 2.0 | 2.0 | 1100 | $1,950 | $1.77 | 2d | 1 | 1.45mi |
| 1411 Greenview Dr Unit 17 Bethlehem, PA | 2.0 | 2.5 | 1400 | $2,500 | $1.79 | 23d | 1 | 1.45mi |
| 1411 Greenview Dr Unit 12 Bethlehem, PA | 2.0 | 2.5 | 1380 | $2,500 | $1.81 | 43d | 1 | 1.45mi |
Listing history 9 events
-
2026-04-20status Pending
-
2026-04-10$283,500 Active
-
2000-11-20soldstatus $91,000
-
2000-11-17soldstatus $91,000 282-char remark
Show marketing remark (282 chars)
THIS TOWNHOUSE HAS NEUTRAL CARPETING INSTALLED LESS THAN 2 YEARS, HOME HAS BEEN WELL MAINTAINED & OFFERS 3-BEDROOMS, 1-1/2 BATHS, 1-CAR GARAGE & IS CLOSE TO RTE 22. ALSO HAS FULL BASEMENT. ELECTRIC BILLS AVERAGE $50- $60 DURING THE SUMMER AND $90-$120 DURING THE WINTER.
-
2000-04-18$89,900 282-char remark
Show marketing remark (282 chars)
THIS TOWNHOUSE HAS NEUTRAL CARPETING INSTALLED LESS THAN 2 YEARS, HOME HAS BEEN WELL MAINTAINED & OFFERS 3-BEDROOMS, 1-1/2 BATHS, 1-CAR GARAGE & IS CLOSE TO RTE 22. ALSO HAS FULL BASEMENT. ELECTRIC BILLS AVERAGE $50- $60 DURING THE SUMMER AND $90-$120 DURING THE WINTER.
-
1988-12-01soldstatus $91,000
-
1987-08-01soldstatus $72,400
ⓘ Source: listings_history table (triggers on properties + properties_extension) + one-shot
backfill from property_details.listing_events for pre-trigger history.
Tax reassessment forecast PA · Partial reset (capped growth)
- Current annual tax
- $3,640 · $303/mo
- Projected year-2 tax
- $4,060 · $338/mo
- Expected delta
- +$419/yr (+$35/mo · 11.5%)
ⓘ Screening estimate from a state-policy table — verify with the county assessor before closing.
Climate risk First Street
- Flood 1/10 Low FEMA zone X (unshaded) · 0% chance over 30 yrs
- Wildfire 1/10 Low
- Heat 5/10 Major 7 d/yr ≥99°F today · 15 d/yr by 30 yrs out
- Wind 4/10 Moderate 20% chance of damaging wind over 30 yrs
- Air quality 3/10 Moderate 2 unhealthy d/yr today · 5 by 30 yrs out
Nearby sold comps map
Loading sold comps map…
Walkable amenities ~0.75 mi
Loading nearby amenities…
Taxation est. · year 1
- Rental income
- $30,642
- − Mortgage interest
- −$15,880
- − Property taxes
- −$3,640
- − Insurance
- −$1,418
- − Repairs & maintenance
- −$2,451
- − Management
- −$2,451
- − Depreciation
- −$8,247
- Taxable loss
- −$3,446
- Est. tax savings @ 24.0%
- +$827
- After-tax cash flow
- $2,136/yr
For passive investors: Depreciation is non-cash, so a rental often shows a tax loss while cash-flowing — sheltering income. Rental losses are passive: they offset passive income freely, and up to $25,000/yr can offset ordinary (W-2) income if you actively participate and your MAGI is under $100k (phasing out to $0 by $150k); unused losses carry forward. On sale, claimed depreciation is recaptured at up to 25%, and gains may owe capital-gains tax (a 1031 exchange can defer both). Figures are a year-1 estimate at your 24.0% rate — not tax advice; consult a CPA.
Schools (NCES district)
- District
- Bethlehem Area SD
- NCES district ID
- 4203570
- Math proficiency
- 31% ▼ -2.00%
- Reading proficiency
- 49% ▼ -6.00%
- Median HH income
- $55,124
- Composite
- 34.92/100
- National rank
- #5068
- State rank
- #342 of 539 in PA
Livability — Bethlehem
- Score
- 82/100
- State rank
- #138
- US rank
- #1122
Category grades
Schools grade is shown separately in the Schools card above.
Census & demographics
- County
- Northampton County · 236,814 people
- City population
- 129,661
- Metro
- Allentown-Bethlehem-Easton, PA-NJ
- Population (ZIP)
- 40,640
- Household income
- $91,173
- Rent vs Own
- Severe rent burden
- 950.0
Population outlook (Northampton County) Hauer SSP2
- Today (2025)
- 312,227 people
- By 2030
- 314,769 · +0.8%
- By 2040
- 316,914 · +1.5%
- By 2050
- 318,037 · +1.9%
- By 2075
- 334,003 · +7.0%
- By 2100
- 344,696 · +10.4%
Race, ethnicity, and origin ACS 2023
- Neighborhood character
- Majority White (64%)
- Race & ethnicity
- White 64% Hispanic / Latino 25% Two or more races 14% Black 5% Asian 4%
- Hispanic origin (detail)
- Puerto Rican 16% Dominican 4%
- Common ancestry
- Romanian 4% Polish 2% Lithuanian 1%
- Foreign-born
- 10% · Canada, China, Vietnam
- Languages at home
- 77% English-only · Spanish 15% Other Indo-European 2% French/Haitian/Cajun 1%
Political lean MEDSL · Northampton
- 2024 margin
- Toss-up / Even · D 48.6% · R 50.4%
- 2008→2024 swing
- -14.1pp toward R · 2008: 12.3pp · 2024: -1.8pp
- All cycles
- 2024: R+1.8 2020: D+0.7 2016: R+3.8 2012: D+4.6 2008: D+12.3
Not yet ingested
- Civics
- —
Market trends
- HPI YoY
- ▼ -218.92%
- Current HPI
- 203.0358
- Rent YoY
- ▲ 2.60%
- Metro
- Allentown-Bethlehem-Easton, PA-NJ
- State GDP YoY
- ▲ 1.68%
- F500 in state
- 34
Industry mix (Fortune 500 HQ in PA)
| Industry | F500 HQs | Revenue |
|---|---|---|
| Healthcare | 2 | $309B |
|
||
| Insurance | 2 | $27B |
|
||
| Telecommunications / Media | 1 | $124B |
|
||
| Industrial Distribution | 1 | $22B |
|
||
| Financial Services | 1 | $20B |
|
||
| Chemicals / Materials | 1 | $18B |
|
||
Price history
+291.6% since first listed9 events — show timeline
- 2026-04-20 Pending — GLVRMLS
- 2026-04-10 Listed $283,500 GLVRMLS
- 2000-11-20 Sold (Public Records) $91,000 Public Records
- 2000-11-17 Sold (MLS) $91,000 PMAR
- 2000-11-17 Sold (MLS) $91,000 GLVRMLS
- 2000-04-18 Listed $89,900 PMAR
- 2000-04-18 Listed $89,900 GLVRMLS
- 1988-12-01 Sold (Public Records) $91,000 Public Records
- 1987-08-01 Sold (Public Records) $72,400 Public Records
Property tax history
+1.5%/yrLatest (2026): $3,640 · +4.6% YoY. Source: county tax records.
Cash-flow waterfall
monthlySold comps — $/sqft
last 12 mo · ≤1 miLoading sold comps…