885 Talmadge Ave SE · Palm Bay, FL
Flood risk 1/10 · Minimal
- FEMA flood zone
- X (unshaded)
- Chance of flooding over 30 yrs
- 0.0%
- Est. flood insurance / yr
- $507 – $1,088
Fire risk 3/10 · Minor
- Est. fire insurance / yr
- $947 – $1,759
Heat risk 10/10 · Severe
- Hot days now (above 106°F)
- 7 days/yr
- Hot days in 30 yrs
- 22 days/yr
Wind risk 10/10 · Severe
- Chance of severe wind over 30 yrs
- 99.0%
Air-quality risk 1/10 · Minimal
- Unhealthy air days now
- 0 days/yr
- Unhealthy air days in 30 yrs
- 0 days/yr
Risk factors via First Street. Map © Google.
Why this score? — see what drove the D- grade
The composite is a weighted blend of 9 inputs, each scored 0–100. Each bar is that input's sub-score; the figure is the points it added to the 100-point composite (weight × sub-score).
- Appreciation +10.0/10.0
- ARV discount +7.5/15.0
- Cash flow +5.3/30.0
- Schools +4.7/10.0
- Livability +3.6/5.0
- Rent growth +3.4/5.0
- Condition / age +2.5/5.0
- 1% rule +0.9/10.0
- DSCR +0.0/10.0
$364,900
🖨 Deal sheet 📄 Offer letter ✓ Due diligence
Listing remarks MLS
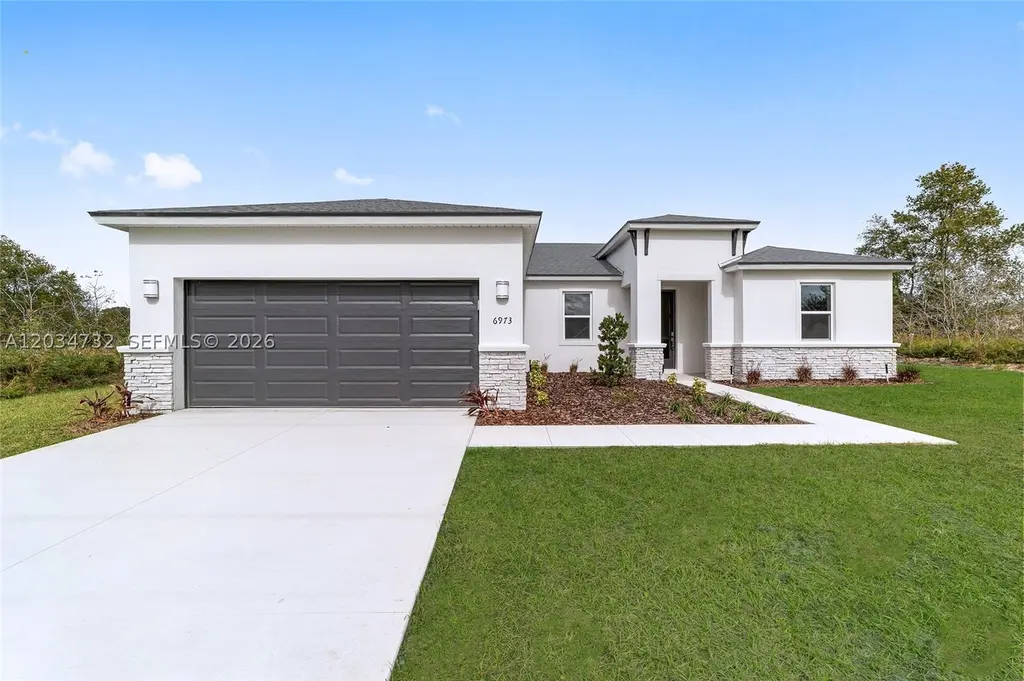
No HOA!! No CDD!! Standard features of this home include 36'' real wood soft close cabinets, quartz countertops, luxury tile plank flooring, 9'4'' ceilings, large walk-in closets, an irrigation system, rain gutters, hurricane shutters, a spacious open floor plan, Energy Star S/S appliances, double pane low emission windows that help control your home's internal temperature and reduce noise pollution, LED lighting, high performance 16 SEER HVAC unit. Designer landscaping. Pictures are from a previously built model.
Key facts
- Quartz countertops
- Rain gutters
- Walk-in closets
Tags
Property features AI
Finance
- Other: Lot roughly a quarter to half acre
- Financial info: Lease considered
Exterior
- Parking: Attached garage with automatic garage door opener; 2 covered garage spaces (2-car garage)
- Security: Storm/Security shutters
- Utilities: Public water; Septic tank
- Home design: Single-story home; New construction; Faces west; Builder model: Brite Sunrise 1787; Residential zoning
- Construction: Block and stucco construction; Shingle roof; New construction
- Exterior features: Exterior lighting; Storm/security shutters; Automatic sprinklers
Interior
- Kitchen: Dishwasher; Electric range; Microwave; Refrigerator; Garbage disposal; Pantry; Eat-in kitchen / breakfast area
- Bedrooms: Includes den (flex room)
- Flooring: Tile
- Bathrooms: 2 full bathrooms
- Heating & cooling: Central heating (electric); Central air conditioning (electric)
- Interior features: Breakfast area; Entrance foyer; Eat-in kitchen; First floor entry; Pantry; Split bedrooms; Unfurnished
- Laundry & utility: Washer hookup; Dryer hookup; Utility room
Neighborhood map
What this means for you Summary
Snapshot
- This is a 3-bed/2.0-bath land listed at $365k.
Deal economics
- At list price, monthly cash flow is $-818 ($-10k/yr) — negative.
- To cash-flow at today's rent, offer at most $247k (32.4% below list).
- To meet the 1% rule (rent ≥ 1% of price), the offer needs to be $216k (40.9% below list).
- Recommended offer: $216k (40.9% below list) — sets the bar for 1% rule.
Location & tenants
- Location reads 72/100 on livability (#366 in FL) — a middle-class / working-renter tenant base. Strengths: cost of living A+, housing A+; Watch: schools C-, employment D+, amenities F.
- Brevard (suburban): math 53% / reading 57% proficiency, ranked #19 of 73 in FL (top 26%) — acceptable for families but not a draw, mixed tenant base, ~2y average lease.
- Market conditions: Rents rising (+3.7%/yr); 1111 active listings in the ZIP; 24 comparable units currently listed for rent nearby; rentals at typical pace (median 23d on market — plan ~3-4 weeks tenant-placement turnaround); solid renter incomes; 4,602 units permitted in Brevard County in 2024 (702 in 5+ unit buildings).
- This rent runs 32% of the median local income ($80k/yr) — at the standard rent-burdened threshold; future hikes will face affordability resistance.
Forward outlook
- In year one you build about $39k of equity ($3k loan paydown + $36k appreciation (10.0% local appreciation)).
- Brevard County population projected at +15% by 2050 — modest demand growth; plan on rents tracking national, not racing it.
- By year 2, paydown + projected appreciation supports a ~$63k cash-out refi (75% LTV) — recoverable capital for the next deal without selling this one.
Negotiation context
- Only 8 days on market — expect competitive offers; lowballing is unlikely to land.
- 7 sale attempts since 21y ago; this cycle's ask is 15765% above the opening price — seller raised mid-cycle; expect resistance to lowballs.
Risks & watch-outs
- Climate carrying-cost: severe wind risk, 99% chance of damaging wind over 30y; extreme-heat days projected 7→22/yr by 2055 (HVAC capex compounding) — expect insurance premiums to compound above CPI over the hold.
Questions for the listing agent
- What do current leases actually rent for vs. the listed asking? Can we see a recent rent roll and the last 12 months of T-12 income?
- Is there a deadline driving the sale (1031 exchange, divorce, estate, relocation)? That informs how much negotiation room exists.
- The area grade is low — what's the realistic commute time and amenity access for the typical tenant pool here? Any planned neighborhood developments (good or bad) we should know about?
- What's the average days-on-market for RENTAL listings here right now (not sales)? A rising rental-DOM trend means longer vacancies and softer asking-rent achievability than the comps imply.
- What's the recent tenant-quality profile in this submarket — average credit score on applications, eviction rate, late-payment / NSF rate, and stable-employment percentage? A property-management company in the area should have these aggregated.
- How much new for-sale + rental construction is in the pipeline within 1–3 miles? Heavy new supply typically softens prices + rents 12–24 months out; constrained supply supports both.
Investment metrics
- 1% rule
- 0.59% ✗
- Cap rate
- 3.60%
- Cash-on-cash
- -9.61%
- DSCR
- 0.57
- GRM
- 14.1
CMA / ARV
No comps found within radius.
Projected returns pro-forma
10.0% appreciation · 3.67% rent growth · sell at horizon
- IRR
- 17.7%
- Equity multiple
- 2.45×
- Total profit
- $148,130
- Equity at exit
- $328,731
- IRR
- 16.7%
- Equity multiple
- 5.70×
- Total profit
- $480,307
- Equity at exit
- $708,920
Cash invested: $102,172 (down + closing). Projections, not guarantees.
Landlord ↔ Tenant lean methodology
- Overall (STATE)
- 87 Strongly Landlord-Friendly
- State Florida
- 87 Strongly Landlord-Friendly · R+3
- County
- — inherits STATE
- City
- — inherits STATE
ZIP-level market 32909
- Home prices YoY
- 6.0%
- Rents YoY
- 3.7%
- Active inventory
- 1111
- Price-to-rent
- 14.1×
Monthly cashflow live
- Estimated rent
- $2,157 high interval (Pro) →
- Mortgage (P&I)
- −$1,914
- Tax est. 1.5%
- −$456 /mo · $5,474/yr
- Insurance
- −$152
- HOA
- −$0
- Vacancy / Maint / Mgmt
- −$453
- Net cashflow
- $-818
Break-even live
UW: 25.0% down · 7.5% · 30yr · 1.5% tax · 5.0% vac · 8.0% maint · 8.0% mgmt
Financing live
Cash to close
- Down payment
- $91,225
- Closing costs
- $10,947
- Reserves months
- —
- Total cash needed
- —
Loan-product check · same deal, 3 products live
Conventional
25% down · 7.5% · 30yr
- Down + closing
- —
- Monthly P&I
- —
- Monthly cashflow
- —
- DSCR
- —
- Eligible?
- —
Personal DTI + credit; lowest rate.
DSCR
20% down · 8.5% · 30yr
- Down + closing
- —
- Monthly P&I
- —
- Monthly cashflow
- —
- DSCR
- —
- Eligible?
- —
No personal income docs; deal must DSCR.
Hard money
10% down · 12.0% · 12mo
- Down + closing
- —
- Monthly P&I
- —
- Monthly cashflow
- —
- DSCR
- —
- Eligible?
- —
Short-term bridge; refi at stabilization.
Rent comps 24 comps
| Address | Beds | Baths | Sqft | Rent | $/sqft | DOM | Units | Dist |
|---|---|---|---|---|---|---|---|---|
| 885 Talmadge Ave SE Palm Bay, FL | 3.0 | 2.0 | 1787 | $2,300 | $1.29 | 21d | 1 | 0.02mi |
| 896 Talmadge Ave SE Palm Bay, FL | 3.0 | 2.0 | 1263 | $1,900 | $1.50 | 14d | 1 | 0.05mi |
| 829 Tampa Ave SE Palm Bay, FL | 3.0 | 2.0 | 1303 | $1,740 | $1.34 | 23d | 1 | 0.16mi |
| 721 Taluga Ave SE Palm Bay, FL | 3.0 | 2.0 | 1556 | $1,800 | $1.16 | 23d | 1 | 0.19mi |
| 1205 Jaslo St SE Palm Bay, FL | 1.0–3.0 | 1.0–2.0 | 992 | $2,245 | $2.26 | 14d | 8 | 0.29mi |
| 1255 Wadsworth St SE Unit 1255 Palm Bay, FL | 3.0 | 3.0 | 1747 | $2,350 | $1.35 | 19d | 1 | 0.47mi |
| 1210 Vandalia Ave SE Palm Bay, FL | 4.0 | 2.0 | 1833 | $2,050 | $1.12 | 14d | 1 | 0.66mi |
| 84 San Filippo Dr SE Palm Bay, FL | 1.0–3.0 | 1.0–2.0 | 1052 | $2,044 | $1.94 | 14d | 30 | 0.73mi |
| 907 Algardi St SE Palm Bay, FL | 4.0 | 2.0 | 1943 | $2,330 | $1.20 | 23d | 1 | 0.82mi |
| 1643 Talavera St SE Palm Bay, FL | 4.0 | 2.0 | 1833 | $1,861 | $1.02 | 19d | 1 | 0.96mi |
| 710 Avalon St SE Palm Bay, FL | 3.0 | 2.0 | 1378 | $1,995 | $1.45 | 23d | 1 | 1.05mi |
| 743 Andrew St SE Palm Bay, FL | 3.0 | 2.0 | 1252 | $1,895 | $1.51 | 23d | 1 | 1.06mi |
| 1418 Paley Cir SE Palm Bay, FL | 3.0 | 2.0 | 1260 | $1,850 | $1.47 | 23d | 1 | 1.20mi |
| 647 Airoso Rd SE Palm Bay, FL | 4.0 | 3.0 | 2365 | $2,900 | $1.23 | 13d | 1 | 1.20mi |
| 822 Seven Gables Cir SE Palm Bay, FL | 3.0 | 2.0 | 1474 | $1,835 | $1.24 | 23d | 1 | 1.25mi |
| 1150 Raoul St SE Palm Bay, FL | 4.0 | 2.0 | 1787 | $2,300 | $1.29 | 23d | 1 | 1.26mi |
| 818 Seven Gables Cir SE Palm Bay, FL | 3.0 | 2.0 | 1490 | $1,795 | $1.20 | 23d | 1 | 1.26mi |
| 1129 Colonial Ave SE Palm Bay, FL | 4.0 | 3.0 | 2008 | $2,500 | $1.25 | 19d | 1 | 1.27mi |
| 1517 Wacker Ave SE Palm Bay, FL | 4.0 | 2.0 | 1775 | $2,200 | $1.24 | 23d | 1 | 1.28mi |
| 1290 Sail Ct SE Palm Bay, FL | 3.0 | 2.0 | 1509 | $1,945 | $1.29 | 23d | 1 | 1.33mi |
| 1530 Paley Cir SE Palm Bay, FL | 4.0 | 2.0 | 1842 | $2,095 | $1.14 | 14d | 1 | 1.37mi |
| 1224 Buffing Cir SE Palm Bay, FL | 4.0 | 2.0 | 2233 | $2,395 | $1.07 | 14d | 1 | 1.48mi |
| 2910 Emerson Dr SE Palm Bay, FL | 3.0 | 2.0 | 1700 | $1,950 | $1.15 | 14d | 1 | 1.48mi |
| 1068 Saint Johns St SE Palm Bay, FL | 3.0 | 2.0 | 1332 | $2,000 | $1.50 | 23d | 1 | 1.50mi |
Listing history 6 events
-
2026-06-18days on market $364,900 Active 8 DOM
-
2026-06-17days on market $364,900 Active 7 DOM
-
2026-06-16days on market $364,900 Active 6 DOM
-
2026-06-15days on market $364,900 Active 5 DOM
-
2026-06-14remarks 519-char remark
-
2026-06-14$364,900 Active 3 DOM
ⓘ Source: listings_history table (triggers on properties + properties_extension) + one-shot
backfill from property_details.listing_events for pre-trigger history.
Climate risk First Street
- Flood 1/10 Low FEMA zone X (unshaded) · 0% chance over 30 yrs
- Wildfire 3/10 Moderate
- Heat 10/10 Extreme 7 d/yr ≥106°F today · 22 d/yr by 30 yrs out
- Wind 10/10 Extreme 99% chance of damaging wind over 30 yrs
- Air quality 1/10 Low 0 unhealthy d/yr today · 0 by 30 yrs out
Nearby sold comps map
Loading sold comps map…
Walkable amenities ~0.75 mi
Loading nearby amenities…
Taxation est. · year 1
- Rental income
- $25,879
- − Mortgage interest
- −$20,440
- − Property taxes
- −$5,474
- − Insurance
- −$1,824
- − Repairs & maintenance
- −$2,070
- − Management
- −$2,070
- − Depreciation
- −$10,615
- Taxable loss
- −$16,615
- Est. tax savings @ 24.0%
- +$3,988
- After-tax cash flow
- $-5,829/yr
For passive investors: Depreciation is non-cash, so a rental often shows a tax loss while cash-flowing — sheltering income. Rental losses are passive: they offset passive income freely, and up to $25,000/yr can offset ordinary (W-2) income if you actively participate and your MAGI is under $100k (phasing out to $0 by $150k); unused losses carry forward. On sale, claimed depreciation is recaptured at up to 25%, and gains may owe capital-gains tax (a 1031 exchange can defer both). Figures are a year-1 estimate at your 24.0% rate — not tax advice; consult a CPA.
Schools (NCES district)
- District
- Brevard
- NCES district ID
- 1200150
- Math proficiency
- 53% ▼ -9.00%
- Reading proficiency
- 57% ▼ -4.00%
- Median HH income
- $49,426
- Composite
- 46.86/100
- National rank
- #2370
- State rank
- #19 of 73 in FL
Livability — Palm Bay
- Score
- 72/100
- State rank
- #366
- US rank
- #6458
Category grades
Schools grade is shown separately in the Schools card above.
Census & demographics
- Census place
- Palm Bay, FL
- County
- Brevard County · 602,871 people
- City population
- 132,211
- Metro
- Palm Bay-Melbourne-Titusville, FL
- Population (ZIP)
- 41,804
- Household income
- $79,977
- Rent vs Own
- Severe rent burden
- 697.0
Population outlook (Brevard County) Hauer SSP2
- Today (2025)
- 623,254 people
- By 2030
- 648,420 · +4.0%
- By 2040
- 690,009 · +10.7%
- By 2050
- 715,669 · +14.8%
- By 2075
- 775,744 · +24.5%
- By 2100
- 776,687 · +24.6%
Race, ethnicity, and origin ACS 2023
- Neighborhood character
- Diverse neighborhood (Simpson 0.70)
- Race & ethnicity
- White 46% Black 21% Hispanic / Latino 20% Two or more races 16% Asian 4%
- Hispanic origin (detail)
- Mexican 2% Puerto Rican 8% Cuban 5%
- Common ancestry
- Hispanic 3% Slovak 2% Lithuanian 2%
- Foreign-born
- 17% · Canada, China, Jamaica
- Languages at home
- 84% English-only · Spanish 9% French/Haitian/Cajun 4% Chinese 1%
Political lean MEDSL · Brevard
- 2024 margin
- Strong R (+20.8) · D 39.1% · R 59.9% · Other 1.0%
- 2008→2024 swing
- -10.4pp toward R · 2008: -10.4pp · 2024: -20.8pp
- All cycles
- 2024: R+20.8 2020: R+16.4 2016: R+19.8 2012: R+12.7 2008: R+10.4
Not yet ingested
- Civics
- —
Market trends
- HPI YoY
- ▲ 18.81%
- Current HPI
- 330.8595
- Rent YoY
- ▲ 3.67%
- Metro
- Palm Bay-Melbourne-Titusville, FL
- State GDP YoY
- ▲ 3.28%
- F500 in state
- 36
Industry mix (Fortune 500 HQ in FL)
| Industry | F500 HQs | Revenue |
|---|---|---|
| Industrial Technology | 2 | $29B |
|
||
| Insurance | 2 | $17B |
|
||
| Retail | 1 | $60B |
|
||
| Technology Distribution | 1 | $58B |
|
||
| Homebuilding | 1 | $35B |
|
||
| Technology Manufacturing | 1 | $35B |
|
||
Price history
-95.8% since first listed13 events — show timeline
- 2026-06-11 Listed for Rent $2,300 RMLSFL
- 2026-06-11 Rental Removed $2,300 MARMLS
- 2026-06-01 Listed $364,900 MARMLS
- 2026-06-01 Listed $364,900 SCMLS
- 2026-05-28 Listed for Rent $2,300 MARMLS
- 2024-04-18 Sold (Public Records) $615,000 Public Records
- 2018-08-08 Sold (Public Records) $12,000 Public Records
- 2018-07-18 Sold (MLS) $12,000 SCMLS
- 2017-07-26 Listed $12,000 SCMLS
- 2016-09-28 Listing Removed — SCMLS
- 2016-08-16 Listing Removed — SCMLS
- 2013-11-26 Listed $24,900 SCMLS
- 2005-10-07 Listed $55,000 SCMLS
Property tax history
+18.0%/yrLatest (2025): $585 · +19.3% YoY. Source: county tax records.
Cash-flow waterfall
monthlySold comps — $/sqft
last 12 mo · ≤1 miLoading sold comps…