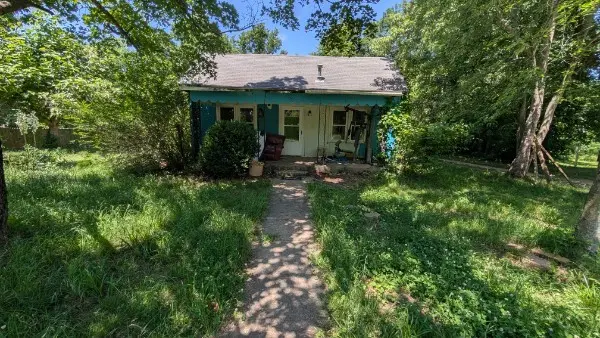
404 N Duff Ave · Sulphur Springs, AR
Flood risk 1/10 · Minimal
- FEMA flood zone
- X (unshaded)
- Chance of flooding over 30 yrs
- 0.0%
- Est. flood insurance / yr
- $507 – $1,088
Fire risk 6/10 · Moderate
- Est. fire insurance / yr
- $1,499 – $2,785
Heat risk 5/10 · Moderate
- Hot days now (above 108°F)
- 7 days/yr
- Hot days in 30 yrs
- 20 days/yr
Wind risk 2/10 · Minimal
- Chance of severe wind over 30 yrs
- 3.0%
Air-quality risk 2/10 · Minimal
- Unhealthy air days now
- 0 days/yr
- Unhealthy air days in 30 yrs
- 1 days/yr
Risk factors via First Street. Map © Google.
Why this score? — see what drove the B+ grade
The composite is a weighted blend of 9 inputs, each scored 0–100. Each bar is that input's sub-score; the figure is the points it added to the 100-point composite (weight × sub-score).
- Cash flow +30.0/30.0
- 1% rule +10.0/10.0
- DSCR +10.0/10.0
- Appreciation +7.8/10.0
- ARV discount +7.5/15.0
- Schools +4.0/10.0
- Livability +3.2/5.0
- Rent growth +2.5/5.0
- Condition / age +2.5/5.0
$39,000
🖨 Deal sheet (PDF) 📄 Offer letter ✓ Due diligence
Listing remarks
Investor Special in Sulphur Springs! Calling all flippers and visionary DIYers! If you are looking for your next profitable project, this property in the quiet, scenic community of Sulphur Springs, AR, is packed with potential and priced to move. The heavy lifting starts here, but so does the equity. This home is needing a full renovation, making it the perfect opportunity to tear down to the studs and build back exactly to meet current market finishes and tastes. Whether you are looking to fix-and-flip for a quick return or add a high-yield asset to your long-term rental portfolio, the bones are here to make it happen. Property needs extensive interior and exterior work. Located in an area
Key facts
- Full renovation
- 0.36 acre lot
- Parking
Tags
Property features AI
Finance
- Other: Property tax information available (not included per instructions)
- HOA & community: Association fees billed monthly
Exterior
- Parking: Circular driveway
- Utilities: Electricity available; Public water; Public sewer
- Home design: Single-story; Residential zoning; Age not specified
- Construction: Concrete and wood siding construction; Asphalt shingle roof; Crawlspace foundation
- Exterior features: Gravel driveway; City lot, level; Public paved road frontage
Interior
- Kitchen: See remarks regarding appliances
- Flooring: Carpet; Tile
- Bathrooms: 1 full bathroom
- Interior features: Vinyl window frames; No additional interior features listed
- Laundry & utility: Gas water heater
Neighborhood map
What this means for you Summary
Snapshot
- This is a 2-bed/1.0-bath single-family listed at $39k.
Deal economics
- At list price, monthly cash flow is $559 ($7k/yr) — positive.
- The deal already cash-flows at list — no discount required.
- Meets the 1% rule at list price ($1k rent vs $39k).
- Cap rate 23.5% vs local median 4.4% in Sulphur Springs — top-decile yield for the area; either an underpriced asset or a hidden risk that comps aren't pricing in. Stress-test before assuming the spread holds.
Location & tenants
- Location reads 63/100 on livability (#192 in AR) — a middle-class / working-renter tenant base. Strengths: cost of living A+, housing A+, crime A; Watch: employment C-, schools F, amenities F.
- Gravette School District (rural): math 49% / reading 45% proficiency, ranked #26 of 238 in AR (top 11%) — families likely to look elsewhere, expect single-tenant / working-renter base with shorter leases.
- Market conditions: 36 active listings in the ZIP; 4,359 units permitted in Benton County in 2024 (402 in 5+ unit buildings).
Forward outlook
- In year one you build about $2k of equity ($270 loan paydown + $2k appreciation (5.7% local appreciation)).
- Benton County population projected at +56% by 2050 — long-run rental-demand tailwind backs the buy-and-hold thesis.
- At projected returns (5.7% appreciation + 3.0% rent growth), your $11k cash investment doubles in ~2 years — after that, you're playing with house money.
Negotiation context
- Only 11 days on market — expect competitive offers; lowballing is unlikely to land.
- Current owner paid $27k; 46% above their basis — modest negotiation headroom, anchor on the comps not their cost.
Risks & watch-outs
- Climate carrying-cost: major wildfire risk; extreme-heat days projected 7→20/yr by 2055 (HVAC capex compounding) — expect insurance premiums to compound above CPI over the hold.
Questions for the listing agent
- Is there a deadline driving the sale (1031 exchange, divorce, estate, relocation)? That informs how much negotiation room exists.
- Schools are F-rated, which usually means shorter tenancies and higher turnover. Who's the typical renter profile here, and what's been the actual vacancy rate?
- What's the average days-on-market for RENTAL listings here right now (not sales)? A rising rental-DOM trend means longer vacancies and softer asking-rent achievability than the comps imply.
- What's the recent tenant-quality profile in this submarket — average credit score on applications, eviction rate, late-payment / NSF rate, and stable-employment percentage? A property-management company in the area should have these aggregated.
- How much new for-sale + rental construction is in the pipeline within 1–3 miles? Heavy new supply typically softens prices + rents 12–24 months out; constrained supply supports both.
Investment metrics
- 1% rule
- 2.66% ✓
- Cap rate
- 23.50%
- Cash-on-cash
- 61.45%
- DSCR
- 3.73
- GRM
- 3.1
CMA / ARV
- ARV (on-the-fly)
- $125,600
- Comps found
- 5
Show comp detail 5 sales within ~0.75 mi
| Address | Dist | Beds/Ba | Sqft | Sold | Price | $/sf | Match |
|---|---|---|---|---|---|---|---|
| 120 N Duff Ave | 0.21mi | 3/1.5 (+1) | 1,300 (+4%) | 7mo | $37,500 | $29 | 71 |
| 118 Duff Ave | 0.33mi | 2/1.0 | 1,249 (-1%) | 22mo | $125,000 | $100 | 66 |
| 205 Grove St | 0.08mi | 2/1.0 | 1,116 (-11%) | 20mo | $140,000 | $125 | 61 |
| 133 S Bush Ave | 0.39mi | 2/1.0 | 1,156 (-8%) | 13mo | $93,500 | $81 | 58 |
| 1120 Roundtop Rd | 0.46mi | 3/1.5 (+1) | 1,312 (+4%) | 20mo | $285,000 | $217 | 47 |
Match score weights: distance 35% · size 25% · config 20% · recency 20%. Top-matched comps best support the ARV.
Projected returns pro-forma
5.68% appreciation · 3.0% rent growth · sell at horizon
- IRR
- 69.0%
- Equity multiple
- 5.23×
- Total profit
- $46,146
- Equity at exit
- $23,728
- IRR
- 66.3%
- Equity multiple
- 10.90×
- Total profit
- $108,078
- Equity at exit
- $42,363
Cash invested: $10,920 (down + closing). Projections, not guarantees.
Landlord ↔ Tenant lean methodology
- Overall (STATE)
- 92 Strongly Landlord-Friendly
- State Arkansas
- 92 Strongly Landlord-Friendly · R+14
- County
- — inherits STATE
- City
- — inherits STATE
ZIP-level market 72768
- Home prices YoY
- 1.4%
- Active inventory
- 36
- Price-to-rent
- 3.1×
Monthly cashflow live
- Estimated rent
- $1,038 medium interval (Pro) →
- Mortgage (P&I)
- −$205
- Tax from tax record
- −$40 /mo · $484/yr
- Insurance
- −$16
- HOA
- −$0
- Vacancy / Maint / Mgmt
- −$218
- Net cashflow
- $559
Break-even live
Sensitivity live
| Price | -10% $581 | -5% $570 | +0% $559 | +5% $548 | +10% $537 |
|---|---|---|---|---|---|
| Rent | -10% $477 | -5% $518 | +0% $559 | +5% $600 | +10% $641 |
| Rate | -1.0pp $579 | -0.5pp $569 | base $559 | +0.5pp $549 | +1.0pp $539 |
UW: 25.0% down · 7.5% · 30yr · 1.5% tax · 5.0% vac · 8.0% maint · 8.0% mgmt
Financing live
Cash to close
- Down payment
- $9,750
- Closing costs
- $1,170
- Reserves months
- —
- Total cash needed
- —
Loan-product check · same deal, 3 products live
Conventional
25% down · 7.5% · 30yr
- Down + closing
- —
- Monthly P&I
- —
- Monthly cashflow
- —
- DSCR
- —
- Eligible?
- —
Personal DTI + credit; lowest rate.
DSCR
20% down · 8.5% · 30yr
- Down + closing
- —
- Monthly P&I
- —
- Monthly cashflow
- —
- DSCR
- —
- Eligible?
- —
No personal income docs; deal must DSCR.
Hard money
10% down · 12.0% · 12mo
- Down + closing
- —
- Monthly P&I
- —
- Monthly cashflow
- —
- DSCR
- —
- Eligible?
- —
Short-term bridge; refi at stabilization.
Listing history 9 events
-
2026-06-16statusdays on market $39,000 Pending 11 DOM
-
2026-06-15days on market $39,000 Active 10 DOM
-
2026-06-14days on market $39,000 Active 8 DOM
-
2026-06-13days on market $39,000 Active 7 DOM
-
2026-06-10days on market $39,000 Active 5 DOM
-
2026-06-09days on market $39,000 Active 4 DOM
-
2026-06-08days on market $39,000 Active 3 DOM
-
2026-06-07remarks 699-char remark
-
2026-06-07$39,000 Active 2 DOM
ⓘ Source: listings_history table (triggers on properties + properties_extension) + one-shot
backfill from property_details.listing_events for pre-trigger history.
Tax reassessment forecast AR · Resets to sale price
- Current annual tax
- $484 · $40/mo
- Projected year-2 tax
- $484 · $40/mo
- Expected delta
- $0/yr ($0/mo · 0.0%)
ⓘ Screening estimate from a state-policy table — verify with the county assessor before closing.
Climate risk First Street
- Flood 1/10 Low FEMA zone X (unshaded) · 0% chance over 30 yrs
- Wildfire 6/10 Major
- Heat 5/10 Major 7 d/yr ≥108°F today · 20 d/yr by 30 yrs out
- Wind 2/10 Low 3% chance of damaging wind over 30 yrs
- Air quality 2/10 Low 0 unhealthy d/yr today · 1 by 30 yrs out
Nearby sold comps map
Loading sold comps map…
Walkable amenities ~0.75 mi
Loading nearby amenities…
Taxation est. · year 1
- Rental income
- $12,460
- − Mortgage interest
- −$2,185
- − Property taxes
- −$484
- − Insurance
- −$195
- − Repairs & maintenance
- −$997
- − Management
- −$997
- − Depreciation
- −$1,135
- Taxable income
- $6,469
- Est. tax owed @ 24.0%
- −$1,553
- After-tax cash flow
- $5,158/yr
For passive investors: Depreciation is non-cash, so a rental often shows a tax loss while cash-flowing — sheltering income. Rental losses are passive: they offset passive income freely, and up to $25,000/yr can offset ordinary (W-2) income if you actively participate and your MAGI is under $100k (phasing out to $0 by $150k); unused losses carry forward. On sale, claimed depreciation is recaptured at up to 25%, and gains may owe capital-gains tax (a 1031 exchange can defer both). Figures are a year-1 estimate at your 24.0% rate — not tax advice; consult a CPA.
Schools (NCES district)
- District
- Gravette School District
- NCES district ID
- 0506840
- Math proficiency
- 49% ▼ -11.00%
- Reading proficiency
- 45% ▼ -10.00%
- Median HH income
- $50,964
- Composite
- 40.41/100
- National rank
- #3728
- State rank
- #26 of 238 in AR
Livability — Sulphur Springs
- Score
- 63/100
- State rank
- #192
- US rank
- #15295
Category grades
Schools grade is shown separately in the Schools card above.
Census & demographics
- Census place
- Sulphur Springs, AR
- Population (ZIP)
- 1,320
Population outlook (Benton County) Hauer SSP2
- Today (2025)
- 318,683 people
- By 2030
- 353,481 · +10.9%
- By 2040
- 425,280 · +33.4%
- By 2050
- 497,239 · +56.0%
- By 2075
- 662,114 · +107.8%
- By 2100
- 776,431 · +143.6%
Race, ethnicity, and origin ACS 2023
- Neighborhood character
- Predominantly White (75%)
- Race & ethnicity
- White 75% Two or more races 21% Hispanic / Latino 6%
- Hispanic origin (detail)
- Mexican 4%
- Common ancestry
- Danish 10% Slovak 3% Lithuanian 1%
- Foreign-born
- 2%
- Languages at home
- 97% English-only · Other Asian/Pacific 2% Spanish 1%
Political lean MEDSL · Benton
- 2024 margin
- Strong R (+27.0) · D 35.2% · R 62.1% · Other 2.7%
- 2008→2024 swing
- +9.6pp toward D · 2008: -36.5pp · 2024: -27.0pp
- All cycles
- 2024: R+27.0 2020: R+26.4 2016: R+34.9 2012: R+40.4 2008: R+36.5
Not yet ingested
- Civics
- —
Market trends
- HPI YoY
- ▲ 5.68%
- Current HPI
- 420.7339
- Rent YoY
- —
- Metro
- —
- State GDP YoY
- ▲ 3.80%
- F500 in state
- 10
Industry mix (Fortune 500 HQ in AR)
| Industry | F500 HQs | Revenue |
|---|---|---|
| Retail | 1 | $681B |
|
||
| Food / Agriculture | 1 | $53B |
|
||
| Retail / Energy | 1 | $22B |
|
||
| Transportation / Logistics | 1 | $12B |
|
||
| Energy | 1 | $4B |
|
||
Price history
+45.8% since first listed2 events — show timeline
- 2026-06-05 Listed $39,000 NWARMLS
- 2019-09-03 Sold (Public Records) $26,752 Public Records
Property tax history
+7.6%/yrLatest (2025): $484 · +9.9% YoY. Source: county tax records.
Cash-flow waterfall
monthlySold comps — $/sqft
last 12 mo · ≤1 miLoading sold comps…