11720 Park Blvd #302 · Seminole, FL
Flood risk 1/10 · Minimal
- FEMA flood zone
- X (unshaded)
- Chance of flooding over 30 yrs
- 0.0%
- Est. flood insurance / yr
- $507 – $1,088
Fire risk 1/10 · Minimal
- Est. fire insurance / yr
- $947 – $1,759
Heat risk 10/10 · Severe
- Hot days now (above 107°F)
- 7 days/yr
- Hot days in 30 yrs
- 27 days/yr
Wind risk 10/10 · Severe
- Chance of severe wind over 30 yrs
- 99.0%
Air-quality risk 3/10 · Minor
- Unhealthy air days now
- 2 days/yr
- Unhealthy air days in 30 yrs
- 2 days/yr
Risk factors via First Street. Map © Google.
Why this score? — see what drove the C- grade
The composite is a weighted blend of 9 inputs, each scored 0–100. Each bar is that input's sub-score; the figure is the points it added to the 100-point composite (weight × sub-score).
- Cash flow +15.8/30.0
- 1% rule +9.8/10.0
- ARV discount +7.5/15.0
- DSCR +4.9/10.0
- Livability +4.4/5.0
- Schools +4.3/10.0
- Rent growth +2.5/5.0
- Condition / age +2.5/5.0
- Appreciation +0.0/10.0
$119,500
🖨 Deal sheet (PDF) 📄 Offer letter ✓ Due diligence
Listing remarks
NO SPECIAL ASSESSMENTS!! A 55+ community where you don’t have to be 55+ to own, NO rental restrictions; must be 55+ to live here! NEW ROOF (NOV 2025) | HOA includes CABLE, INTERNET, WATER, SEWER, TRASH more + Low electric Bill! New Carport & Digital Laundry | ELEVATOR | Welcome to this inviting Seminole condo including a large HEATED pool, clubhouse, shuffleboard, assigned covered parking and guest parking; thoughtfully tucked towards the back of the community in a peaceful, low-traffic setting offering tranquil views. This spacious 2-bedroom, 1-bath residence offers comfort, functionality, and a relaxed 55+ lifestyle in one of Seminole’s highly sought-after areas. Inside,
Key facts
- New digital laundry
- Flex space
- Walk-in closet
Tags
Property features AI
Finance
- Other: Buyer approval required for community; Directions available to condo complex
- Financial info: Total annual association fees $6,300; Land lease amount $152
- HOA & community: Monthly condo fee of $525; Association amenities include clubhouse, pool, laundry, shuffleboard court, and cable TV; Association fee covers cable TV, pool, internet, escrow reserves, maintenance (structure & grounds), pest control, sewer, trash and water; Association approval required; Qualified Property Management; Senior community; Pets allowed (cats and dogs)
Exterior
- Parking: Carport (1 covered space)
- Utilities: Public water; Public sewer; Cable connected; Broadband/high-speed internet available; Water connected; Irrigation equipment
- Home design: Residential condominium; Third-floor unit; Faces south; Single-story living area within a building listed as three or more levels
- Construction: Block and concrete construction; Other roof; Concrete perimeter and slab foundation; Building/Unit identified as 302
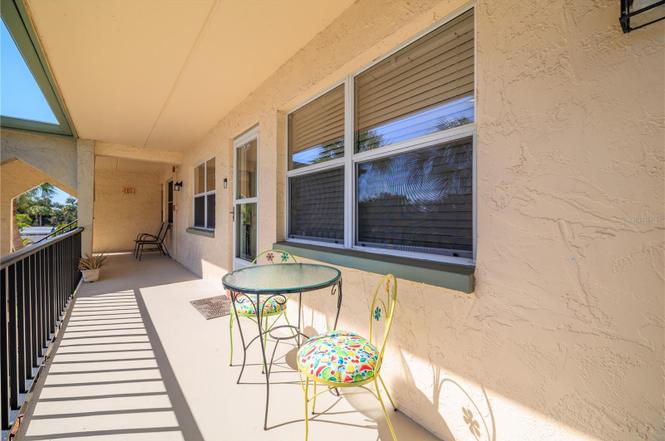
- Exterior features: Balcony; Sidewalk
Interior
- Kitchen: Built-in oven; Cooktop; Dishwasher; Disposal; Microwave; Refrigerator
- Bedrooms: 2 bedrooms
- Flooring: Carpet; Tile
- Bathrooms: 1 full bathroom
- Heating & cooling: Central heating; Central air conditioning
- Interior features: Ceiling fans; Walk-in closet(s); Window treatments; Bonus room; Building elevator
- Laundry & utility: Common area laundry
Neighborhood map
What this means for you Summary
Snapshot
- This is a 2-bed/1.0-bath condo listed at $120k.
Deal economics
- At list price, monthly cash flow is $56 ($667/yr) — positive.
- The deal already cash-flows at list — no discount required.
- Meets the 1% rule at list price ($2k rent vs $120k).
- Recommended offer: $109k (9.0% below list) — sets the bar for market timing.
- Cap rate 6.9% vs local median 3.7% in Seminole — top-decile yield for the area; either an underpriced asset or a hidden risk that comps aren't pricing in. Stress-test before assuming the spread holds.
Location & tenants
- Location reads 88/100 on livability (#5 in FL, #174 nationally) — a professional / high-income tenant draw. Strengths: commute A+, housing A+, health & safety A+.
- Pinellas (suburban): math 51% / reading 51% proficiency, ranked #31 of 73 in FL (top 42%) — acceptable for families but not a draw, mixed tenant base, ~2y average lease.
- Market conditions: Rents flat; 209 active listings in the ZIP; 23 comparable units currently listed for rent nearby; rentals leasing fast (median 6d on market — plan ~1-2 weeks tenant-placement turnaround); 2,676 units permitted in Pinellas County in 2024 (1,422 in 5+ unit buildings).
Forward outlook
- Local home prices are declining (-3.0%/yr); year-one equity from $826 of loan paydown is wiped out by about $4k of value loss. Plan a longer hold.
- Pinellas County population projected at +14% by 2050 — modest demand growth; plan on rents tracking national, not racing it.
Negotiation context
- It's been on market 118 days — a 9% lower offer ($109k) is reasonable based on typical stale-listing flexibility.
- 6 sale attempts since 5y ago with the ask held roughly flat each time — persistent listings suggest the price (not the market) is what's stuck; bring a comps-based counter.
- Current owner paid $99k; 21% above their basis — modest negotiation headroom, anchor on the comps not their cost.
Risks & watch-outs
- Watch-outs: HOA is 30% of rent.
- Climate carrying-cost: severe wind risk, 99% chance of damaging wind over 30y; extreme-heat days projected 7→27/yr by 2055 (HVAC capex compounding) — expect insurance premiums to compound above CPI over the hold.
Questions for the listing agent
- It's been on market 118 days. Have you received any prior offers? Is the seller open to a 9% concession, seller financing, or rate buy-down credit?
- Built in 1973 — when were the roof, HVAC, electrical panel, plumbing, and water heater last replaced?
- What does the HOA fee cover, when was the last increase, and are there any pending special assessments or reserve-fund shortfalls?
- Any open or pending special assessments — roof, HVAC, plumbing, elevator, façade? What's the per-unit balance and payoff schedule, and is the seller paying it off at close or rolling it to the buyer?
- Why hasn't it sold? Are there any deal-killer items the seller is aware of (foundation, flood, title, zoning, code violations)?
- Is there a deadline driving the sale (1031 exchange, divorce, estate, relocation)? That informs how much negotiation room exists.
- Schools are B-rated — typically a magnet for longer-tenancy family renters. What's the average tenant stay here, and is there a school-zone premium baked into asking?
- What's the average days-on-market for RENTAL listings here right now (not sales)? A rising rental-DOM trend means longer vacancies and softer asking-rent achievability than the comps imply.
- What's the recent tenant-quality profile in this submarket — average credit score on applications, eviction rate, late-payment / NSF rate, and stable-employment percentage? A property-management company in the area should have these aggregated.
- How much new apartment / multifamily construction is in the pipeline within 1–3 miles? Heavy new supply (>2% of stock underway) typically softens rents 12–24 months out; light construction supports rent growth.
Investment metrics
- 1% rule
- 1.48% ✓
- Cap rate
- 6.85%
- Cash-on-cash
- 1.99%
- DSCR
- 1.09
- GRM
- 5.6
CMA / ARV
No comps found within radius.
Projected returns pro-forma
-3.0% appreciation · 0.1% rent growth · sell at horizon
- IRR
- -18.2%
- Equity multiple
- 0.39×
- Total profit
- $-20,500
- Equity at exit
- $17,818
- IRR
- -24.0%
- Equity multiple
- 0.06×
- Total profit
- $-31,338
- Equity at exit
- $10,332
Cash invested: $33,460 (down + closing). Projections, not guarantees.
Landlord ↔ Tenant lean methodology
- Overall (STATE)
- 87 Strongly Landlord-Friendly
- State Florida
- 87 Strongly Landlord-Friendly · R+3
- County
- — inherits STATE
- City
- — inherits STATE
ZIP-level market 33772
- Rents YoY
- 0.1%
- Active inventory
- 209
- Price-to-rent
- 5.6×
Monthly cashflow live
- Estimated rent
- $1,771 high interval (Pro) →
- Mortgage (P&I)
- −$627
- Tax from tax record
- −$142 /mo · $1,707/yr
- Insurance
- −$50
- HOA
- −$525
- Vacancy / Maint / Mgmt
- −$372
- Net cashflow
- $56
Break-even live
Sensitivity live
| Price | -10% $123 | -5% $89 | +0% $56 | +5% $22 | +10% $-12 |
|---|---|---|---|---|---|
| Rent | -10% $-84 | -5% $-14 | +0% $56 | +5% $126 | +10% $196 |
| Rate | -1.0pp $116 | -0.5pp $86 | base $56 | +0.5pp $25 | +1.0pp $-7 |
UW: 25.0% down · 7.5% · 30yr · 1.5% tax · 5.0% vac · 8.0% maint · 8.0% mgmt
Financing live
Cash to close
- Down payment
- $29,875
- Closing costs
- $3,585
- Reserves months
- —
- Total cash needed
- —
Loan-product check · same deal, 3 products live
Conventional
25% down · 7.5% · 30yr
- Down + closing
- —
- Monthly P&I
- —
- Monthly cashflow
- —
- DSCR
- —
- Eligible?
- —
Personal DTI + credit; lowest rate.
DSCR
20% down · 8.5% · 30yr
- Down + closing
- —
- Monthly P&I
- —
- Monthly cashflow
- —
- DSCR
- —
- Eligible?
- —
No personal income docs; deal must DSCR.
Hard money
10% down · 12.0% · 12mo
- Down + closing
- —
- Monthly P&I
- —
- Monthly cashflow
- —
- DSCR
- —
- Eligible?
- —
Short-term bridge; refi at stabilization.
Rent comps 23 comps
| Address | Beds | Baths | Sqft | Rent | $/sqft | DOM | Units | Dist |
|---|---|---|---|---|---|---|---|---|
| 11700 Park Blvd Seminole, FL | 2.0 | 2.0 | 1010 | $1,400 | $1.39 | 25d | 1 | 0.01mi |
| 12100 Park Blvd Seminole, FL | 1.0–3.0 | 1.0–2.5 | 921 | $1,744 | $1.89 | 3d | 40 | 0.32mi |
| 8201 120th St Seminole, FL | 3.0 | 2.0 | 1056 | $2,500 | $2.37 | 12d | 1 | 0.36mi |
| 11201 80th Ave #303 Seminole, FL | 2.0 | 2.0 | 1000 | $1,800 | $1.80 | 25d | 1 | 0.49mi |
| 8080 112th St #108 Seminole, FL | 1.0 | 1.0 | 874 | $1,700 | $1.95 | 25d | 1 | 0.53mi |
| 12400 Rose St Seminole, FL | 2.0 | 1.0 | 910 | $1,705 | $1.87 | 4d | 2 | 0.54mi |
| 12430 Rose St Seminole, FL | 2.0 | 1.0 | 910 | $1,705 | $1.87 | 25d | 1 | 0.59mi |
| 12460 Rose St #15 Seminole, FL | 2.0 | 1.0 | 910 | $1,705 | $1.87 | 25d | 1 | 0.61mi |
| 12450 Rose St #30 Seminole, FL | 2.0 | 1.0 | 910 | $1,705 | $1.87 | 25d | 1 | 0.61mi |
| 8450 112th St #103 Seminole, FL | 1.0 | 1.0 | 608 | $1,250 | $2.06 | 25d | 1 | 0.63mi |
| 8425 112th St #104 Seminole, FL | 1.0 | 1.0 | 608 | $1,300 | $2.14 | 5d | 1 | 0.64mi |
| 11200 86th Ave #202 Seminole, FL | 2.0 | 1.0 | 836 | $1,700 | $2.03 | 5d | 1 | 0.65mi |
| 8555 112th St #206 Seminole, FL | 1.0 | 1.0 | 638 | $1,250 | $1.96 | 5d | 1 | 0.68mi |
| 11234 68th Ave Seminole, FL | 2.0 | 1.5 | 960 | $2,400 | $2.50 | 9d | 1 | 0.73mi |
| 11100 86th Ave #101 Seminole, FL | 1.0 | 1.0 | 874 | $1,350 | $1.54 | 19d | 1 | 0.74mi |
| 10764 70th Ave Seminole, FL | 1.0–2.0 | 1.0–2.0 | 828 | $2,200 | $2.66 | 5d | 2 | 0.92mi |
| 10530 68th Ave Seminole, FL | 2.0 | 1.0 | 1000 | $1,690 | $1.69 | 5d | 1 | 1.19mi |
| 10888 Temple Ave Seminole, FL | 2.0 | 2.0 | 1101 | $2,150 | $1.95 | 5d | 1 | 1.21mi |
| 9209 Seminole Blvd Seminole, FL | 2.0 | 1.5 | 1015 | $1,700 | $1.67 | 4d | 2 | 1.27mi |
| 9209 Seminole Blvd Seminole, FL | 2.0 | 1.5 | 1015 | $1,675 | $1.65 | 5d | 3 | 1.27mi |
| 10405 Addison Way Seminole, FL | 1.0–3.0 | 1.0–2.0 | 1133 | $2,351 | $2.08 | 3d | 18 | 1.35mi |
| 9209 Seminole Blvd #139 Seminole, FL | 2.0 | 1.5 | 1015 | $1,800 | $1.77 | 25d | 1 | 1.35mi |
| 11013 Temple Ave Seminole, FL | 3.0 | 1.0 | 951 | $2,050 | $2.16 | 5d | 1 | 1.37mi |
HOA detail condo
- Monthly dues
- $525 · $6,300/yr
- Likely covers
- watersewertrashelectricinternetcablepool
- Assessments
- None detected in remarks — confirm with the listing agent.
Listing history 33 events
-
2026-06-18days on market $119,500 Active 118 DOM
-
2026-06-17days on market $119,500 Active 117 DOM
-
2026-06-16days on market $119,500 Active 116 DOM
-
2026-06-15days on market $119,500 Active 115 DOM
-
2026-06-13pricedays on market $119,500 Active 113 DOM
-
2026-06-09days on market $120,000 Active 109 DOM
-
2026-06-08days on market $120,000 Active 108 DOM
-
2026-06-07days on market $120,000 Active 107 DOM
-
2026-06-04days on market $120,000 Active 104 DOM
-
2026-06-03days on market $120,000 Active 103 DOM
-
2026-06-01days on market $120,000 Active 101 DOM
-
2026-05-31days on market $120,000 Active 100 DOM
-
2026-05-20status Active
-
2026-05-19historical
-
2026-05-06price $120,000
-
2026-02-19$124,900 Active
-
2026-02-11historical
-
2025-08-12$124,900 Active
-
2024-10-29historical
-
2024-08-07price $149,500
-
2024-05-30price $154,900
-
2024-05-15price $169,000
-
2024-04-29$174,000 Active
-
2024-03-18historical
-
2024-02-20price $174,000
-
2024-02-07price $189,900
-
2023-12-05$199,000 Active
-
2021-09-08soldstatus $99,000
-
2021-08-31soldstatus $99,000 Closed
-
2021-08-15status Pending
-
2021-08-06$99,000 Active
-
1988-02-17soldstatus $40,000
-
1983-11-01soldstatus $34,900
ⓘ Source: listings_history table (triggers on properties + properties_extension) + one-shot
backfill from property_details.listing_events for pre-trigger history.
Tax reassessment forecast FL · Resets to sale price
- Current annual tax
- $1,707 · $142/mo
- Projected year-2 tax
- $1,707 · $142/mo
- Expected delta
- $0/yr ($0/mo · 0.0%)
ⓘ Screening estimate from a state-policy table — verify with the county assessor before closing.
Climate risk First Street
- Flood 1/10 Low FEMA zone X (unshaded) · 0% chance over 30 yrs
- Wildfire 1/10 Low
- Heat 10/10 Extreme 7 d/yr ≥107°F today · 27 d/yr by 30 yrs out
- Wind 10/10 Extreme 99% chance of damaging wind over 30 yrs
- Air quality 3/10 Moderate 2 unhealthy d/yr today · 2 by 30 yrs out
Nearby sold comps map
Loading sold comps map…
Walkable amenities ~0.75 mi
Loading nearby amenities…
Taxation est. · year 1
- Rental income
- $21,255
- − Mortgage interest
- −$6,694
- − Property taxes
- −$1,707
- − Insurance
- −$598
- − Repairs & maintenance
- −$1,700
- − Management
- −$1,700
- − HOA
- −$6,300
- − Depreciation
- −$3,476
- Taxable loss
- −$920
- Est. tax savings @ 24.0%
- +$221
- After-tax cash flow
- $888/yr
For passive investors: Depreciation is non-cash, so a rental often shows a tax loss while cash-flowing — sheltering income. Rental losses are passive: they offset passive income freely, and up to $25,000/yr can offset ordinary (W-2) income if you actively participate and your MAGI is under $100k (phasing out to $0 by $150k); unused losses carry forward. On sale, claimed depreciation is recaptured at up to 25%, and gains may owe capital-gains tax (a 1031 exchange can defer both). Figures are a year-1 estimate at your 24.0% rate — not tax advice; consult a CPA.
Schools (NCES district)
- District
- Pinellas
- NCES district ID
- 1201560
- Math proficiency
- 51% ▼ -5.00%
- Reading proficiency
- 51% ▼ -3.00%
- Median HH income
- $46,270
- Composite
- 43.27/100
- National rank
- #3046
- State rank
- #31 of 73 in FL
Livability — Seminole
- Score
- 88/100
- State rank
- #5
- US rank
- #174
Category grades
Schools grade is shown separately in the Schools card above.
Census & demographics
- Census place
- Seminole, FL
- County
- Pinellas County · 939,478 people
- City population
- 42,315
- Metro
- Tampa-St. Petersburg-Clearwater, FL
- Population (ZIP)
- 23,733
- Household income
- $73,586
- Rent vs Own
- Severe rent burden
- 720.0
Population outlook (Pinellas County) Hauer SSP2
- Today (2025)
- 1,027,532 people
- By 2030
- 1,063,586 · +3.5%
- By 2040
- 1,125,020 · +9.5%
- By 2050
- 1,168,637 · +13.7%
- By 2075
- 1,265,188 · +23.1%
- By 2100
- 1,260,357 · +22.7%
Race, ethnicity, and origin ACS 2023
- Neighborhood character
- Predominantly White (84%)
- Race & ethnicity
- White 84% Hispanic / Latino 8% Two or more races 7% Asian 3% Black 2%
- Hispanic origin (detail)
- Puerto Rican 2%
- Common ancestry
- Romanian 5% Lithuanian 3% Slovak 3%
- Foreign-born
- 10% · Canada, Vietnam, Jamaica
- Languages at home
- 89% English-only · Spanish 5% Other Indo-European 1% Russian/Polish/Slavic 1%
Political lean MEDSL · Pinellas
- 2024 margin
- Lean R (+5.2) · D 46.9% · R 52.1%
- 2008→2024 swing
- -13.5pp toward R · 2008: 8.3pp · 2024: -5.2pp
- All cycles
- 2024: R+5.2 2020: D+0.2 2016: R+1.1 2012: D+5.6 2008: D+8.3
Not yet ingested
- Civics
- —
Market trends
- HPI YoY
- ▼ -485.84%
- Current HPI
- 315.303
- Rent YoY
- ▲ 0.10%
- Metro
- Tampa-St. Petersburg-Clearwater, FL
- State GDP YoY
- ▲ 3.28%
- F500 in state
- 36
Industry mix (Fortune 500 HQ in FL)
| Industry | F500 HQs | Revenue |
|---|---|---|
| Industrial Technology | 2 | $29B |
|
||
| Insurance | 2 | $17B |
|
||
| Retail | 1 | $60B |
|
||
| Technology Distribution | 1 | $58B |
|
||
| Homebuilding | 1 | $35B |
|
||
| Technology Manufacturing | 1 | $35B |
|
||
Price history
+243.8% since first listed21 events — show timeline
- 2026-05-20 Relisted — Stellar MLS as Distributed by MLS Grid
- 2026-05-19 Listing Removed — Stellar MLS as Distributed by MLS Grid
- 2026-05-06 Price Changed $120,000 Stellar MLS as Distributed by MLS Grid
- 2026-02-19 Listed $124,900 Stellar MLS as Distributed by MLS Grid
- 2026-02-11 Listing Removed — Stellar MLS as Distributed by MLS Grid
- 2025-08-12 Listed $124,900 Stellar MLS as Distributed by MLS Grid
- 2024-10-29 Listing Removed — Stellar MLS as Distributed by MLS Grid
- 2024-08-07 Price Changed $149,500 Stellar MLS as Distributed by MLS Grid
- 2024-05-30 Price Changed $154,900 Stellar MLS as Distributed by MLS Grid
- 2024-05-15 Price Changed $169,000 Stellar MLS as Distributed by MLS Grid
- 2024-04-29 Listed $174,000 Stellar MLS as Distributed by MLS Grid
- 2024-03-18 Listing Removed — Stellar MLS as Distributed by MLS Grid
- 2024-02-20 Price Changed $174,000 Stellar MLS as Distributed by MLS Grid
- 2024-02-07 Price Changed $189,900 Stellar MLS as Distributed by MLS Grid
- 2023-12-05 Listed $199,000 Stellar MLS as Distributed by MLS Grid
- 2021-09-08 Sold (Public Records) $99,000 Public Records
- 2021-08-31 Sold (MLS) $99,000 Stellar MLS as Distributed by MLS Grid
- 2021-08-15 Pending — Stellar MLS as Distributed by MLS Grid
- 2021-08-06 Listed $99,000 Stellar MLS as Distributed by MLS Grid
- 1988-02-17 Sold (Public Records) $40,000 Public Records
- 1983-11-01 Sold (Public Records) $34,900 Public Records
Property tax history
+10.5%/yrLatest (2025): $1,707 · +9.8% YoY. Source: county tax records.
Cash-flow waterfall
monthlySold comps — $/sqft
last 12 mo · ≤1 miLoading sold comps…