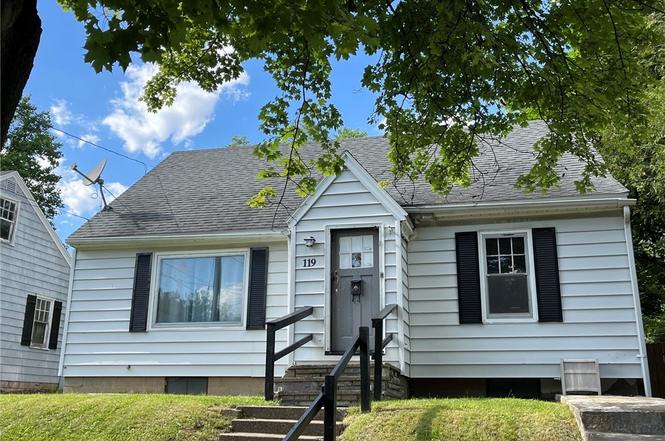
119 Vincent St · Syracuse, NY
Flood risk 1/10 · Minimal
- FEMA flood zone
- X (unshaded)
- Chance of flooding over 30 yrs
- 0.0%
- Est. flood insurance / yr
- $473 – $860
Fire risk 1/10 · Minimal
- Est. fire insurance / yr
- $691 – $1,283
Heat risk 3/10 · Minor
- Hot days now (above 93°F)
- 7 days/yr
- Hot days in 30 yrs
- 16 days/yr
Wind risk 1/10 · Minimal
- Chance of severe wind over 30 yrs
- 0.0%
Air-quality risk 2/10 · Minimal
- Unhealthy air days now
- 0 days/yr
- Unhealthy air days in 30 yrs
- 1 days/yr
Risk factors via First Street. Map © Google.
Why this score? — see what drove the B grade
The composite is a weighted blend of 9 inputs, each scored 0–100. Each bar is that input's sub-score; the figure is the points it added to the 100-point composite (weight × sub-score).
- Cash flow +27.7/30.0
- ARV discount +15.0/15.0
- DSCR +9.8/10.0
- 1% rule +6.9/10.0
- Rent growth +5.0/5.0
- Livability +3.9/5.0
- Condition / age +2.5/5.0
- Schools +1.8/10.0
- Appreciation +0.0/10.0
$150,000
🖨 Deal sheet 📄 Offer letter ✓ Due diligence
Listing remarks
Outer Comstock 3 Bdrm Cape. .. Private Fenced Backyard w/ Large Shed for extra storage. 1 1/2 Baths. Open Floor Plan. Taxes estimated without exemptions * * * Delayed Showing - Friday June 20 @ 8am. Seller reserves right to set deadline for offers.
Key facts
- Open floor plan
- 6,250 sq ft lot
- Built 1946
Tags
Property features AI
Exterior
- Parking: No garage
- Utilities: Sewer connected; Public water; Cable available; High-speed internet available; Circuit breaker electric
- Home design: Single-story home; Existing (previously built); City street frontage; Rectangular residential lot (50 x 125)
- Construction: Shake siding; Asphalt roof; Block foundation
- Exterior features: Blacktop driveway; Enclosed porch; Open porch; Shed(s) / storage
Interior
- Kitchen: Electric oven; Electric range; Refrigerator
- Bedrooms: 1 bedroom on the main level
- Flooring: Carpet; Hardwood; Tile; Varied flooring
- Bathrooms: 1 full bathroom; 1 half bathroom; 1 main-level bathroom
- Heating & cooling: Gas forced-air heating
- Interior features: Breakfast bar; Separate/formal dining room; Kitchen island; Natural woodwork; Bedroom on main level; Full basement
- Laundry & utility: Laundry located in the basement; Gas water heater
Neighborhood map
What this means for you Summary
Snapshot
- This is a 3-bed/1.5-bath single-family listed at $150k.
Deal economics
- At list price, monthly cash flow is $454 ($5k/yr) — positive.
- The deal already cash-flows at list — no discount required.
- Meets the 1% rule at list price ($2k rent vs $150k).
- Cap rate 9.9% vs local median 8.2% in Syracuse — meaningfully above typical; check what's discounted (condition, days-on-market, listing class) to confirm the premium yield is real.
Location & tenants
- Location reads 77/100 on livability (#187 in NY, #2,869 nationally) — a middle-class / working-renter tenant base. Strengths: amenities A+, commute A+, cost of living A+; Watch: schools D+, crime F, employment D-.
- Syracuse City School District (urban): math 18% / reading 26% proficiency, ranked #590 of 590 in NY (top 100%) — low school quality limits family demand, transient renter base, plan for 1-2y turnover; 74% free/reduced lunch — lower-income household profile, screen leases tightly.
- Market conditions: Rents rising fast (+11.2%/yr); 58 active listings in the ZIP; 16 comparable units currently listed for rent nearby; rentals at typical pace (median 21d on market — plan ~3-4 weeks tenant-placement turnaround); 44% of comp listings sitting > 30 days — soft ceiling on asking rent; lower-income renter base — watch delinquency; 616 units permitted in Onondaga County in 2024 (256 in 5+ unit buildings).
- At $1,786/mo this rent would consume 51% of the median local household income ($42k/yr) (locally 2307% of renters already pay >50% of income on rent) — very limited rent-growth headroom before tenants either downsize or default.
Forward outlook
- Local home prices are declining (-3.0%/yr); year-one equity from $1k of loan paydown is wiped out by about $4k of value loss. Plan a longer hold.
- Onondaga County population projected to shrink 9% by 2050 — rents likely to lag national; underwrite the cash flow, not the appreciation.
- At projected returns (-3.0% appreciation + 8.0% rent growth), your $42k cash investment doubles in ~7 years — after that, you're playing with house money.
Negotiation context
- Only 2 days on market — expect competitive offers; lowballing is unlikely to land.
- Current owner paid $50k; list at $150k implies a 200% gain — meaningful room to come down on a strong offer.
Risks & watch-outs
- Watch-outs: built in 1946 — expect roof / HVAC / electrical / plumbing capex.
Questions for the listing agent
- Built in 1946 — when were the roof, HVAC, electrical panel, plumbing, and water heater last replaced?
- Is there a deadline driving the sale (1031 exchange, divorce, estate, relocation)? That informs how much negotiation room exists.
- Schools are D-rated, which usually means shorter tenancies and higher turnover. Who's the typical renter profile here, and what's been the actual vacancy rate?
- Crime grade is F in this area — have there been break-ins, vandalism, or insurance claims at this property in the last 3 years? What carrier currently insures it and at what premium?
- What's the average days-on-market for RENTAL listings here right now (not sales)? A rising rental-DOM trend means longer vacancies and softer asking-rent achievability than the comps imply.
- What's the recent tenant-quality profile in this submarket — average credit score on applications, eviction rate, late-payment / NSF rate, and stable-employment percentage? A property-management company in the area should have these aggregated.
- How much new for-sale + rental construction is in the pipeline within 1–3 miles? Heavy new supply typically softens prices + rents 12–24 months out; constrained supply supports both.
Investment metrics
- 1% rule
- 1.19% ✓
- Cap rate
- 9.92%
- Cash-on-cash
- 12.96%
- DSCR
- 1.58
- GRM
- 7.0
CMA / ARV
- ARV (on-the-fly)
- $180,110
- Comps found
- 12
Show comp detail 12 sales within ~0.75 mi
| Address | Dist | Beds/Ba | Sqft | Sold | Price | $/sf | Match |
|---|---|---|---|---|---|---|---|
| 415 Thurber St | 0.25mi | 3/1.5 | 1,165 (+0%) | 1mo | $165,000 | $142 | 87 |
| 212 Boise Dr | 0.28mi | 3/1.5 | 1,154 (-1%) | 7mo | $180,250 | $156 | 80 |
| 120 Goodrich Ave | 0.36mi | 3/1.0 | 1,152 (-1%) | 1mo | $150,000 | $130 | 79 |
| 140 Ruth Ave | 0.20mi | 3/1.5 | 1,088 (-6%) | 2mo | $180,000 | $165 | 78 |
| 222 Vincent St | 0.14mi | 3/1.0 | 1,071 (-8%) | 2mo | $190,000 | $177 | 77 |
| 144 Ruth Ave | 0.20mi | 3/2.0 | 1,085 (-7%) | 4mo | $168,000 | $155 | 74 |
| 435 Jamesville Ave | 0.09mi | 3/1.0 | 1,296 (+12%) | 3mo | $179,000 | $138 | 72 |
| 315 Thurber St | 0.18mi | 3/1.0 | 1,248 (+7%) | 8mo | $171,000 | $137 | 70 |
| 1447 Comstock Ave | 0.41mi | 3/1.0 | 1,134 (-2%) | 9mo | $209,250 | $185 | 68 |
| 133 Hobart Ave | 0.62mi | 3/1.0 | 1,248 (+7%) | 1mo | $145,000 | $116 | 56 |
| 141 Tejah Ave | 0.66mi | 3/1.0 | 1,120 (-4%) | 7mo | $156,000 | $139 | 56 |
| 313 Goodrich Ave | 0.52mi | 3/1.0 | 992 (-15%) | 4mo | $279,000 | $281 | 46 |
Match score weights: distance 35% · size 25% · config 20% · recency 20%. Top-matched comps best support the ARV.
Projected returns pro-forma
-3.0% appreciation · 8.0% rent growth · sell at horizon
- IRR
- 8.1%
- Equity multiple
- 1.33×
- Total profit
- $13,995
- Equity at exit
- $22,365
- IRR
- 21.1%
- Equity multiple
- 3.20×
- Total profit
- $92,250
- Equity at exit
- $12,969
Cash invested: $42,000 (down + closing). Projections, not guarantees.
Landlord ↔ Tenant lean methodology
- Overall (STATE)
- 15 Strongly Tenant-Friendly
- State New York
- 15 Strongly Tenant-Friendly · D+10
- County
- — inherits STATE
- City
- — inherits STATE
ZIP-level market 13210
- Home prices YoY
- -9.0%
- Rents YoY
- 11.2%
- Active inventory
- 58
- Price-to-rent
- 7.0×
Monthly cashflow live
- Estimated rent
- $1,786 high interval (Pro) →
- Mortgage (P&I)
- −$787
- Tax from tax record
- −$108 /mo · $1,300/yr
- Insurance
- −$62
- HOA
- −$0
- Vacancy / Maint / Mgmt
- −$375
- Net cashflow
- $454
Break-even live
UW: 25.0% down · 7.5% · 30yr · 1.5% tax · 5.0% vac · 8.0% maint · 8.0% mgmt
Financing live
Cash to close
- Down payment
- $37,500
- Closing costs
- $4,500
- Reserves months
- —
- Total cash needed
- —
Loan-product check · same deal, 3 products live
Conventional
25% down · 7.5% · 30yr
- Down + closing
- —
- Monthly P&I
- —
- Monthly cashflow
- —
- DSCR
- —
- Eligible?
- —
Personal DTI + credit; lowest rate.
DSCR
20% down · 8.5% · 30yr
- Down + closing
- —
- Monthly P&I
- —
- Monthly cashflow
- —
- DSCR
- —
- Eligible?
- —
No personal income docs; deal must DSCR.
Hard money
10% down · 12.0% · 12mo
- Down + closing
- —
- Monthly P&I
- —
- Monthly cashflow
- —
- DSCR
- —
- Eligible?
- —
Short-term bridge; refi at stabilization.
Rent comps 16 comps
| Address | Beds | Baths | Sqft | Rent | $/sqft | DOM | Units | Dist |
|---|---|---|---|---|---|---|---|---|
| 260 Robert Dr Syracuse, NY | 3.0 | 1.5 | 1200 | $2,097 | $1.75 | 44d | 1 | 0.34mi |
| 259 Robert Dr Syracuse, NY | 3.0 | 1.5 | 1350 | $699 | $0.52 | 44d | 1 | 0.34mi |
| 2859 S Salina St Unit 2 Syracuse, NY | 2.0 | 1.0 | 1000 | $1,200 | $1.20 | 44d | 1 | 0.43mi |
| 116 Newbury Hollow Ln Syracuse, NY | 1.0–2.0 | 1.0 | 825 | $1,295 | $1.57 | 14d | 7 | 0.52mi |
| 102 Newbury Hollow Ln Syracuse, NY | 2.0 | 1.5 | 1200 | $1,550 | $1.29 | 14d | 1 | 0.54mi |
| 147 E Matson Ave Syracuse, NY | 3.0 | 2.5 | 1421 | $2,000 | $1.41 | 21d | 1 | 0.59mi |
| 508-10 W Brighton Ave Syracuse, NY | 2.0 | 1.0 | 735 | $1,350 | $1.84 | 13d | 13 | 0.99mi |
| 620 Euclid Ave Apt 1 Syracuse, NY | 3.0 | 1.0 | 1248 | $1,700 | $1.36 | 44d | 1 | 1.19mi |
| 953-55 Westcott St Unit 955 Syracuse, NY | 3.0 | 1.0 | 1286 | $1,500 | $1.17 | 44d | 1 | 1.20mi |
| 247 Roosevelt Ave Unit 2 Syracuse, NY | 2.0 | 1.0 | 822 | $1,450 | $1.76 | 44d | 1 | 1.25mi |
| 101 Waldorf Pkwy Unit 14 Syracuse, NY | 2.0 | 1.0 | 800 | $1,450 | $1.81 | 14d | 1 | 1.27mi |
| 822 Westcott St Unit 1 Syracuse, NY | 4.0 | 2.0 | 941 | $575 | $0.61 | 44d | 1 | 1.28mi |
| 113 Croyden Ln Syracuse, NY | 1.0–2.0 | 1.0 | 622 | $1,825 | $2.93 | 13d | 9 | 1.40mi |
| 154 Seeley Ave Syracuse, NY | 4.0 | 1.0 | 1312 | $2,100 | $1.60 | 14d | 1 | 1.41mi |
| 158 Parkway Dr Syracuse, NY | 4.0 | 3.0 | 1029 | $2,250 | $2.19 | 21d | 1 | 1.43mi |
| 683 E Seneca Tpke Syracuse, NY | 1.0–2.0 | 1.0–2.0 | 937 | $1,550 | $1.65 | 14d | 4 | 1.43mi |
Listing history 3 events
-
2026-06-18days on market $150,000 Active 2 DOM
-
2026-06-17remarks 250-char remark
-
2026-06-17$150,000 Active 1 DOM
ⓘ Source: listings_history table (triggers on properties + properties_extension) + one-shot
backfill from property_details.listing_events for pre-trigger history.
Tax reassessment forecast NY · Partial reset (capped growth)
- Current annual tax
- $1,300 · $108/mo
- Projected year-2 tax
- $1,917 · $160/mo
- Expected delta
- +$618/yr (+$51/mo · 47.5%)
ⓘ Screening estimate from a state-policy table — verify with the county assessor before closing.
Climate risk First Street
- Flood 1/10 Low FEMA zone X (unshaded) · 0% chance over 30 yrs
- Wildfire 1/10 Low
- Heat 3/10 Moderate 7 d/yr ≥93°F today · 16 d/yr by 30 yrs out
- Wind 1/10 Low 0% chance of damaging wind over 30 yrs
- Air quality 2/10 Low 0 unhealthy d/yr today · 1 by 30 yrs out
Nearby sold comps map
Loading sold comps map…
Walkable amenities ~0.75 mi
Loading nearby amenities…
Taxation est. · year 1
- Rental income
- $21,432
- − Mortgage interest
- −$8,402
- − Property taxes
- −$1,300
- − Insurance
- −$750
- − Repairs & maintenance
- −$1,715
- − Management
- −$1,715
- − Depreciation
- −$4,364
- Taxable income
- $3,187
- Est. tax owed @ 24.0%
- −$765
- After-tax cash flow
- $4,677/yr
For passive investors: Depreciation is non-cash, so a rental often shows a tax loss while cash-flowing — sheltering income. Rental losses are passive: they offset passive income freely, and up to $25,000/yr can offset ordinary (W-2) income if you actively participate and your MAGI is under $100k (phasing out to $0 by $150k); unused losses carry forward. On sale, claimed depreciation is recaptured at up to 25%, and gains may owe capital-gains tax (a 1031 exchange can defer both). Figures are a year-1 estimate at your 24.0% rate — not tax advice; consult a CPA.
Schools (NCES district)
- District
- Syracuse City School District
- NCES district ID
- 3628590
- Math proficiency
- 18% ▼ -5.00%
- Reading proficiency
- 26% ▬ 0.00%
- Median HH income
- $32,097
- Composite
- 17.83/100
- National rank
- #9007
- State rank
- #590 of 590 in NY
Livability — Syracuse
- Score
- 77/100
- State rank
- #187
- US rank
- #2869
Category grades
Schools grade is shown separately in the Schools card above.
Census & demographics
- Census place
- Syracuse, NY
- County
- Onondaga County · 247,257 people
- City population
- 152,627
- Metro
- Syracuse, NY
- Population (ZIP)
- 19,803
- Household income
- $41,738
- Rent vs Own
- Severe rent burden
- 2307.0
Population outlook (Onondaga County) Hauer SSP2
- Today (2025)
- 467,894 people
- By 2030
- 463,381 · -1.0%
- By 2040
- 447,697 · -4.3%
- By 2050
- 426,399 · -8.9%
- By 2075
- 373,661 · -20.1%
- By 2100
- 307,967 · -34.2%
Race, ethnicity, and origin ACS 2023
- Neighborhood character
- Diverse neighborhood (Simpson 0.61)
- Race & ethnicity
- White 58% Black 18% Asian 9% Hispanic / Latino 9% Two or more races 8%
- Hispanic origin (detail)
- Puerto Rican 3%
- Common ancestry
- Romanian 3% Lithuanian 3% Italian 2%
- Foreign-born
- 18% · China, Canada, South Korea
- Languages at home
- 78% English-only · Chinese 5% Spanish 4% Other Indo-European 2%
Political lean MEDSL · Onondaga
- 2024 margin
- D (+17.3) · D 58.6% · R 41.4%
- 2008→2024 swing
- -3.0pp toward R · 2008: 20.3pp · 2024: 17.3pp
- All cycles
- 2024: D+17.3 2020: D+20.6 2016: D+12.8 2012: D+21.1 2008: D+20.3
Not yet ingested
- Civics
- —
Market trends
- HPI YoY
- ▼ -37.59%
- Current HPI
- 378.0277
- Rent YoY
- ▲ 11.18%
- Metro
- Syracuse, NY
- State GDP YoY
- ▲ 2.60%
- F500 in state
- 92
Industry mix (Fortune 500 HQ in NY)
| Industry | F500 HQs | Revenue |
|---|---|---|
| Financial Services | 10 | $950B |
|
||
| Consumer Goods | 9 | $162B |
|
||
| Insurance | 4 | $225B |
|
||
| Telecommunications | 2 | $144B |
|
||
| Pharmaceuticals | 2 | $112B |
|
||
| Media / Entertainment | 2 | $69B |
|
||
Price history
+118.3% since first listed3 events — show timeline
- 2026-06-17 Listed $150,000 CNYIS
- 2001-08-30 Sold (Public Records) $50,000 Public Records
- 1994-10-31 Sold (Public Records) $68,700 Public Records
Property tax history
+2.1%/yrLatest (2025): $1,300 · +3.3% YoY. Source: county tax records.
Cash-flow waterfall
monthlySold comps — $/sqft
last 12 mo · ≤1 miLoading sold comps…