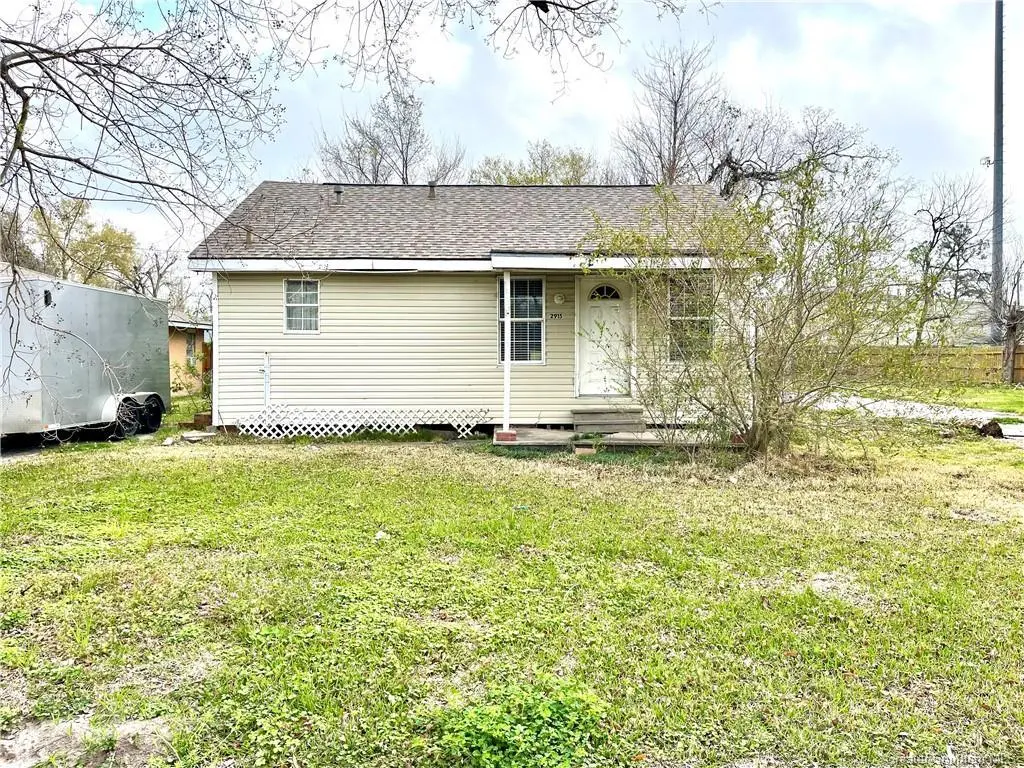
2915 Louisiana Ave · Lake Charles, LA
Flood risk 1/10 · Minimal
- FEMA flood zone
- X (unshaded)
- Chance of flooding over 30 yrs
- 0.0%
- Est. flood insurance / yr
- $507 – $1,088
Fire risk 1/10 · Minimal
- Est. fire insurance / yr
- $1,269 – $2,357
Heat risk 9/10 · Severe
- Hot days now (above 109°F)
- 7 days/yr
- Hot days in 30 yrs
- 22 days/yr
Wind risk 9/10 · Severe
- Chance of severe wind over 30 yrs
- 99.0%
Air-quality risk 2/10 · Minimal
- Unhealthy air days now
- 1 days/yr
- Unhealthy air days in 30 yrs
- 1 days/yr
Risk factors via First Street. Map © Google.
Why this score? — see what drove the B grade
The composite is a weighted blend of 9 inputs, each scored 0–100. Each bar is that input's sub-score; the figure is the points it added to the 100-point composite (weight × sub-score).
- Cash flow +30.0/30.0
- 1% rule +10.0/10.0
- DSCR +10.0/10.0
- ARV discount +7.5/15.0
- Rent growth +4.0/5.0
- Livability +3.4/5.0
- Schools +3.1/10.0
- Condition / age +2.5/5.0
- Appreciation +0.0/10.0
$40,000
🖨 Deal sheet (PDF) 📄 Offer letter ✓ Due diligence
Listing remarks MLS
INVESTMENT OPPORTUNITY! This 3 bedroom 1 bathroom home is located in Boulevard Terrace Subdivision in Lake Charles and is priced to sell! Home is Flood Zone X where flood insurance is typically not required. Call today!
Key facts
- 7,841 sq ft lot
- Built 1974
- Listed 320 days
Neighborhood map
What this means for you Summary
Snapshot
- This is a 2-bed/1.0-bath single-family listed at $40k.
Deal economics
- At list price, monthly cash flow is $587 ($7k/yr) — positive.
- The deal already cash-flows at list — no discount required.
- Meets the 1% rule at list price ($1k rent vs $40k).
- Recommended offer: $35k (12.0% below list) — sets the bar for market timing.
- Cap rate 23.9% vs local median 4.2% in Lake Charles — top-decile yield for the area; either an underpriced asset or a hidden risk that comps aren't pricing in. Stress-test before assuming the spread holds.
Location & tenants
- Location reads 68/100 on livability (#95 in LA) — a middle-class / working-renter tenant base. Strengths: commute A+, cost of living A+, housing A+; Watch: crime F, amenities F, employment D-.
- Calcasieu Parish (other): math 30% / reading 44% proficiency, ranked #29 of 98 in LA (top 30%) — families likely to look elsewhere, expect single-tenant / working-renter base with shorter leases.
- Zoned schools: College Oaks Elementary School (math 12% / reading 22%, grade F, #487 of 646 statewide, top 78%, 254 students, 78% FRL); Oak Park Middle School (math 10% / reading 22%, grade F, #180 of 218 statewide, top 83%, 385 students, 83% FRL); Lagrange High School (math 9% / reading 22%, grade F, #217 of 265 statewide, top 82%, 907 students, 76% FRL) — zoned schools average 79% FRL vs 52% district-wide (27 pts higher); higher-poverty schools than district average — tighter screening recommended.
- Zoned-school proficiency averages 16% at this address vs 37% district-wide (-21 pts) — the specific schools serving this property underperform the Calcasieu Parish average; the district grade overstates school quality for this exact location.
- Market conditions: Rents rising fast (+6.2%/yr); 364 active listings in the ZIP; 25 comparable units currently listed for rent nearby; rentals at typical pace (median 23d on market — plan ~3-4 weeks tenant-placement turnaround); 44% of comp listings sitting > 30 days — soft ceiling on asking rent; 1,298 units permitted in Calcasieu Parish in 2024 (526 in 5+ unit buildings).
Forward outlook
- Local home prices are declining (-3.0%/yr); year-one equity from $277 of loan paydown is wiped out by about $1k of value loss. Plan a longer hold.
- Calcasieu County population projected at +11% by 2050 — modest demand growth; plan on rents tracking national, not racing it.
- At projected returns (-3.0% appreciation + 6.2% rent growth), your $11k cash investment doubles in ~2 years — after that, you're playing with house money.
Negotiation context
- It's been on market 320 days — a 12% lower offer ($35k) is reasonable based on typical stale-listing flexibility.
Risks & watch-outs
- Climate carrying-cost: severe wind risk, 99% chance of damaging wind over 30y; extreme-heat days projected 7→22/yr by 2055 (HVAC capex compounding) — expect insurance premiums to compound above CPI over the hold.
Questions for the listing agent
- It's been on market 320 days. Have you received any prior offers? Is the seller open to a 12% concession, seller financing, or rate buy-down credit?
- Built in 1974 — when were the roof, HVAC, electrical panel, plumbing, and water heater last replaced?
- Why hasn't it sold? Are there any deal-killer items the seller is aware of (foundation, flood, title, zoning, code violations)?
- Is there a deadline driving the sale (1031 exchange, divorce, estate, relocation)? That informs how much negotiation room exists.
- Schools are B-rated — typically a magnet for longer-tenancy family renters. What's the average tenant stay here, and is there a school-zone premium baked into asking?
- Crime grade is F in this area — have there been break-ins, vandalism, or insurance claims at this property in the last 3 years? What carrier currently insures it and at what premium?
- What's the average days-on-market for RENTAL listings here right now (not sales)? A rising rental-DOM trend means longer vacancies and softer asking-rent achievability than the comps imply.
- What's the recent tenant-quality profile in this submarket — average credit score on applications, eviction rate, late-payment / NSF rate, and stable-employment percentage? A property-management company in the area should have these aggregated.
- How much new for-sale + rental construction is in the pipeline within 1–3 miles? Heavy new supply typically softens prices + rents 12–24 months out; constrained supply supports both.
Investment metrics
- 1% rule
- 2.68% ✓
- Cap rate
- 23.92%
- Cash-on-cash
- 62.95%
- DSCR
- 3.80
- GRM
- 3.1
CMA / ARV
- ARV (median comp)
- $111,506
- List price
- $40,000
- Delta
- -64.13%
- Verdict
- UNDERPRICED
- Comps
- 20 within 1.0 mi
Show comp detail 12 sales within ~0.75 mi
| Address | Dist | Beds/Ba | Sqft | Sold | Price | $/sf | Match |
|---|---|---|---|---|---|---|---|
| 1014 Fall St St | 0.20mi | 2/1.0 | 1,190 (+4%) | 2mo | $45,000 | $38 | 82 |
| 819 Craft St | 0.20mi | 3/2.0 (+1) | 1,156 (+1%) | 3mo | $143,000 | $124 | 77 |
| 3022 Louisiana Ave | 0.07mi | 3/1.0 (+1) | 1,100 (-4%) | 12mo | $115,000 | $105 | 76 |
| 3101 Center St | 0.40mi | 3/1.0 (+1) | 1,180 (+3%) | 10mo | $119,000 | $101 | 63 |
| 1518 21st St | 0.37mi | 3/1.0 (+1) | 1,201 (+5%) | 9mo | $135,000 | $112 | 62 |
| 1609 18th St | 0.52mi | 3/1.0 (+1) | 1,178 (+3%) | 9mo | $57,000 | $48 | 58 |
| 707 Fall St | 0.42mi | 3/1.5 (+1) | 1,192 (+4%) | 10mo | $52,000 | $44 | 57 |
| 2529 Aster St | 0.47mi | 2/1.0 | 1,273 (+12%) | 5mo | $115,000 | $90 | 55 |
| 1001 Orange St | 0.20mi | 3/2.0 (+1) | 1,303 (+14%) | 8mo | $158,000 | $121 | 51 |
| 3227 Aster St | 0.40mi | 3/2.0 (+1) | 1,050 (-8%) | 14mo | $106,500 | $101 | 47 |
| 805 Camelia St St | 0.59mi | 3/2.0 (+1) | 1,068 (-6%) | 9mo | $138,800 | $130 | 45 |
| 1203 15th St | 0.53mi | 3/2.0 (+1) | 1,282 (+12%) | 12mo | $184,000 | $144 | 36 |
Match score weights: distance 35% · size 25% · config 20% · recency 20%. Top-matched comps best support the ARV.
Projected returns pro-forma
-3.0% appreciation · 6.18% rent growth · sell at horizon
- IRR
- 65.4%
- Equity multiple
- 4.08×
- Total profit
- $34,479
- Equity at exit
- $5,964
- IRR
- 70.8%
- Equity multiple
- 9.37×
- Total profit
- $93,728
- Equity at exit
- $3,458
Cash invested: $11,200 (down + closing). Projections, not guarantees.
Landlord ↔ Tenant lean methodology
- Overall (STATE)
- 90 Strongly Landlord-Friendly
- State Louisiana
- 90 Strongly Landlord-Friendly · R+12
- County
- — inherits STATE
- City
- — inherits STATE
ZIP-level market 70601
- Rents YoY
- 6.2%
- Active inventory
- 364
- Price-to-rent
- 3.1×
Monthly cashflow live
- Estimated rent
- $1,072 high interval (Pro) →
- Mortgage (P&I)
- −$210
- Tax from tax record
- −$33 /mo · $393/yr
- Insurance
- −$17
- HOA
- −$0
- Vacancy / Maint / Mgmt
- −$225
- Net cashflow
- $587
Break-even live
Sensitivity live
| Price | -10% $610 | -5% $599 | +0% $587 | +5% $576 | +10% $565 |
|---|---|---|---|---|---|
| Rent | -10% $503 | -5% $545 | +0% $587 | +5% $630 | +10% $672 |
| Rate | -1.0pp $608 | -0.5pp $598 | base $587 | +0.5pp $577 | +1.0pp $567 |
UW: 25.0% down · 7.5% · 30yr · 1.5% tax · 5.0% vac · 8.0% maint · 8.0% mgmt
Financing live
Cash to close
- Down payment
- $10,000
- Closing costs
- $1,200
- Reserves months
- —
- Total cash needed
- —
Loan-product check · same deal, 3 products live
Conventional
25% down · 7.5% · 30yr
- Down + closing
- —
- Monthly P&I
- —
- Monthly cashflow
- —
- DSCR
- —
- Eligible?
- —
Personal DTI + credit; lowest rate.
DSCR
20% down · 8.5% · 30yr
- Down + closing
- —
- Monthly P&I
- —
- Monthly cashflow
- —
- DSCR
- —
- Eligible?
- —
No personal income docs; deal must DSCR.
Hard money
10% down · 12.0% · 12mo
- Down + closing
- —
- Monthly P&I
- —
- Monthly cashflow
- —
- DSCR
- —
- Eligible?
- —
Short-term bridge; refi at stabilization.
Rent comps 25 comps
| Address | Beds | Baths | Sqft | Rent | $/sqft | DOM | Units | Dist |
|---|---|---|---|---|---|---|---|---|
| 1028 Alamo St Lake Charles, LA | 2.0 | 1.0 | 865 | $850 | $0.98 | 22d | 1 | 0.11mi |
| 3108 Aster St Unit M Lake Charles, LA | 2.0 | 1.0 | 1100 | $1,300 | $1.18 | 15d | 1 | 0.30mi |
| 1300 16th St Lake Charles, LA | 2.0 | 1.5 | 1344 | $1,295 | $0.96 | 22d | 1 | 0.43mi |
| 603 Falls St Lake Charles, LA | 2.0 | 1.0 | 825 | $825 | $1.00 | 22d | 1 | 0.57mi |
| 807 Camelia St Lake Charles, LA | 3.0 | 1.0 | 1322 | $1,500 | $1.13 | 45d | 1 | 0.58mi |
| 3206 Hodges St Lake Charles, LA | 2.0 | 1.0 | 1497 | $1,200 | $0.80 | 45d | 1 | 0.66mi |
| 3322 Kingham Rd Unit 2 Lake Charles, LA | 2.0 | 1.0 | 870 | $1,075 | $1.24 | 45d | 1 | 0.70mi |
| 3506 Common St Unit 11 Lake Charles, LA | 2.0 | 1.0 | 910 | $950 | $1.04 | 15d | 1 | 0.80mi |
| 520 E Lagrange St Unit 12 Lake Charles, LA | 1.0 | 1.0 | 700 | $749 | $1.07 | 22d | 1 | 0.82mi |
| 3619 Texas St Lake Charles, LA | 1.0–3.0 | 1.0–2.0 | 950 | $994 | $1.05 | 15d | 6 | 0.88mi |
| 3715 Common St Unit B1 Lake Charles, LA | 2.0 | 2.0 | 900 | $1,395 | $1.55 | 15d | 1 | 0.98mi |
| 114 W Lagrange St Apt 18 Lake Charles, LA | 2.0 | 1.0 | 1200 | $1,300 | $1.08 | 22d | 1 | 1.03mi |
| 121 W Lagrange St Lake Charles, LA | 1.0 | 1.0 | 850 | $750 | $0.88 | 45d | 1 | 1.09mi |
| 2700 Ernest St Lake Charles, LA | 1.0–3.0 | 1.0–2.0 | 1054 | $1,333 | $1.26 | 15d | 1 | 1.14mi |
| 1915 Legion St Lake Charles, LA | 3.0 | 1.0 | 966 | $950 | $0.98 | 15d | 1 | 1.18mi |
| 1505 7th St Lake Charles, LA | 2.0 | 1.0 | 1054 | $900 | $0.85 | 45d | 1 | 1.23mi |
| 1710 Granger St Lake Charles, LA | 3.0 | 2.5 | 1450 | $1,900 | $1.31 | 45d | 1 | 1.27mi |
| 1605 W Common St Unit 1 Lake Charles, LA | 1.0 | 1.0 | 750 | $925 | $1.23 | 22d | 1 | 1.29mi |
| 200 W 11th St Unit 4 Lake Charles, LA | 1.0 | 1.0 | 700 | $875 | $1.25 | 22d | 1 | 1.30mi |
| 3529 Greinwich Blvd Lake Charles, LA | 3.0 | 1.0 | 768 | $895 | $1.17 | 45d | 1 | 1.33mi |
| 422 W Lagrange St Lake Charles, LA | 2.0 | 2.0 | 995 | $1,050 | $1.06 | 45d | 1 | 1.35mi |
| 422 W Lagrange St Lake Charles, LA | 1.0 | 1.0 | 775 | $900 | $1.16 | 22d | 1 | 1.35mi |
| 125 East St Lake Charles, LA | 3.0 | 2.0 | 1138 | $3,850 | $3.38 | 45d | 1 | 1.40mi |
| 317 W School St Unit A Lake Charles, LA | 2.0 | 1.0 | 825 | $900 | $1.09 | 45d | 1 | 1.43mi |
| 1906 8th Ave Lake Charles, LA | 3.0 | 1.0 | 1001 | $1,350 | $1.35 | 45d | 1 | 1.48mi |
Listing history 20 events
-
2026-06-21days on market $40,000 Active 320 DOM
-
2026-06-19days on market $40,000 Active 318 DOM
-
2026-06-18days on market $40,000 Active 317 DOM
-
2026-06-17days on market $40,000 Active 316 DOM
-
2026-06-16days on market $40,000 Active 315 DOM
-
2026-06-15days on market $40,000 Active 314 DOM
-
2026-06-14days on market $40,000 Active 312 DOM
-
2026-06-13days on market $40,000 Active 311 DOM
-
2026-06-10days on market $40,000 Active 309 DOM
-
2026-06-09days on market $40,000 Active 308 DOM
-
2026-06-08days on market $40,000 Active 307 DOM
-
2026-06-07days on market $40,000 Active 306 DOM
-
2026-06-05days on market $40,000 Active 303 DOM
-
2026-06-02days on market $40,000 Active 301 DOM
-
2026-06-01days on market $40,000 Active 300 DOM
-
2026-05-31days on market $40,000 Active 299 DOM
-
2026-05-30days on market $40,000 Active 298 DOM
-
2025-10-20price $40,000 219-char remark
Show marketing remark (219 chars)
INVESTMENT OPPORTUNITY! This 3 bedroom 1 bathroom home is located in Boulevard Terrace Subdivision in Lake Charles and is priced to sell! Home is Flood Zone X where flood insurance is typically not required. Call today!
-
2024-03-25$45,000 Active 219-char remark
Show marketing remark (219 chars)
INVESTMENT OPPORTUNITY! This 3 bedroom 1 bathroom home is located in Boulevard Terrace Subdivision in Lake Charles and is priced to sell! Home is Flood Zone X where flood insurance is typically not required. Call today!
-
2014-05-23soldstatus $48,000
ⓘ Source: listings_history table (triggers on properties + properties_extension) + one-shot
backfill from property_details.listing_events for pre-trigger history.
Tax reassessment forecast LA · Resets to sale price
- Current annual tax
- $393 · $33/mo
- Projected year-2 tax
- $393 · $33/mo
- Expected delta
- $0/yr ($0/mo · 0.0%)
ⓘ Screening estimate from a state-policy table — verify with the county assessor before closing.
Climate risk First Street
- Flood 1/10 Low FEMA zone X (unshaded) · 0% chance over 30 yrs
- Wildfire 1/10 Low
- Heat 9/10 Extreme 7 d/yr ≥109°F today · 22 d/yr by 30 yrs out
- Wind 9/10 Extreme 99% chance of damaging wind over 30 yrs
- Air quality 2/10 Low 1 unhealthy d/yr today · 1 by 30 yrs out
Nearby sold comps map
Loading sold comps map…
Walkable amenities ~0.75 mi
Loading nearby amenities…
Taxation est. · year 1
- Rental income
- $12,861
- − Mortgage interest
- −$2,241
- − Property taxes
- −$393
- − Insurance
- −$200
- − Repairs & maintenance
- −$1,029
- − Management
- −$1,029
- − Depreciation
- −$1,164
- Taxable income
- $6,806
- Est. tax owed @ 24.0%
- −$1,633
- After-tax cash flow
- $5,416/yr
For passive investors: Depreciation is non-cash, so a rental often shows a tax loss while cash-flowing — sheltering income. Rental losses are passive: they offset passive income freely, and up to $25,000/yr can offset ordinary (W-2) income if you actively participate and your MAGI is under $100k (phasing out to $0 by $150k); unused losses carry forward. On sale, claimed depreciation is recaptured at up to 25%, and gains may owe capital-gains tax (a 1031 exchange can defer both). Figures are a year-1 estimate at your 24.0% rate — not tax advice; consult a CPA.
Schools (NCES district)
- District
- Calcasieu Parish
- NCES district ID
- 2200330
- Math proficiency
- 30% ▼ -39.00%
- Reading proficiency
- 44% ▼ -33.00%
- Median HH income
- $44,700
- Composite
- 31.45/100
- National rank
- #5979
- State rank
- #29 of 98 in LA
Livability — Lake Charles
- Score
- 68/100
- State rank
- #95
- US rank
- #9820
Category grades
Schools grade is shown separately in the Schools card above.
Census & demographics
- Census place
- Lake Charles, LA
- County
- Calcasieu Parish · 170,889 people
- City population
- 133,538
- Metro
- Lake Charles, LA
- Population (ZIP)
- 30,872
- Household income
- $49,992
- Rent vs Own
- Severe rent burden
- 1304.0
Population outlook (Calcasieu County) Hauer SSP2
- Today (2025)
- 212,179 people
- By 2030
- 218,199 · +2.8%
- By 2040
- 228,486 · +7.7%
- By 2050
- 236,208 · +11.3%
- By 2075
- 251,696 · +18.6%
- By 2100
- 247,848 · +16.8%
Race, ethnicity, and origin ACS 2023
- Neighborhood character
- Diverse neighborhood (Simpson 0.55)
- Race & ethnicity
- Black 59% White 31% Two or more races 7% Hispanic / Latino 5%
- Common ancestry
- Lithuanian 7% Iranian 1% Serbian 1%
- Foreign-born
- 3% · Canada
- Languages at home
- 95% English-only · Spanish 2% French/Haitian/Cajun 1%
Political lean MEDSL · Calcasieu
- 2024 margin
- Solid R (+39.6) · D 29.5% · R 69.0% · Other 1.5%
- 2008→2024 swing
- -15.0pp toward R · 2008: -24.6pp · 2024: -39.6pp
- All cycles
- 2024: R+39.6 2020: R+35.2 2016: R+33.3 2012: R+28.7 2008: R+24.6
Not yet ingested
- Civics
- —
Market trends
- HPI YoY
- ▼ -109.32%
- Current HPI
- 55.6127
- Rent YoY
- ▲ 6.18%
- Metro
- Lake Charles, LA
- State GDP YoY
- ▲ 3.29%
- F500 in state
- 10
Industry mix (Fortune 500 HQ in LA)
| Industry | F500 HQs | Revenue |
|---|---|---|
| Telecommunications | 2 | $23B |
|
||
| Utilities | 1 | $12B |
|
||
| Wholesale / Distribution | 1 | $5B |
|
||
| Advertising | 1 | $2B |
|
||
Price history
-16.7% since first listed3 events — show timeline
- 2025-10-20 Price Changed $40,000 SWLAR
- 2024-03-25 Listed $45,000 SWLAR
- 2014-05-23 Sold (Public Records) $48,000 Public Records
Property tax history
-0.5%/yrLatest (2025): $393 · +1.3% YoY. Source: county tax records.
Cash-flow waterfall
monthlySold comps — $/sqft
last 12 mo · ≤1 miLoading sold comps…