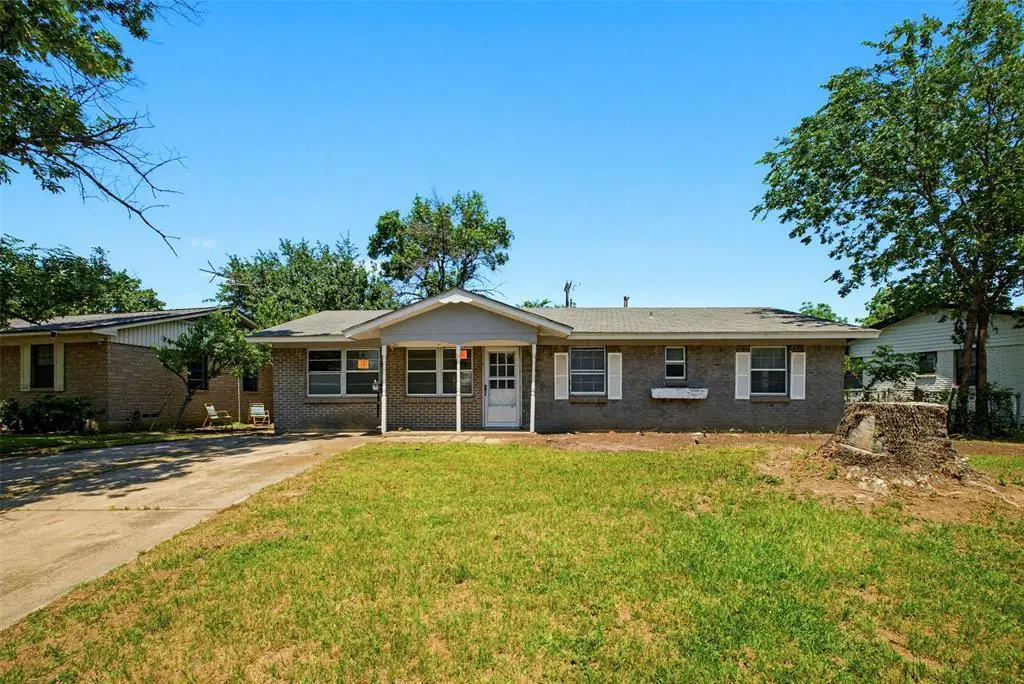
361 N Shore Pl · Lewisville, TX
Flood risk 1/10 · Minimal
- FEMA flood zone
- X (unshaded)
- Chance of flooding over 30 yrs
- 0.0%
- Est. flood insurance / yr
- $507 – $1,088
Fire risk 1/10 · Minimal
- Est. fire insurance / yr
- $1,222 – $2,270
Heat risk 7/10 · Major
- Hot days now (above 109°F)
- 7 days/yr
- Hot days in 30 yrs
- 22 days/yr
Wind risk 5/10 · Moderate
- Chance of severe wind over 30 yrs
- 24.0%
Air-quality risk 3/10 · Minor
- Unhealthy air days now
- 3 days/yr
- Unhealthy air days in 30 yrs
- 4 days/yr
Risk factors via First Street. Map © Google.
Why this score? — see what drove the C+ grade
The composite is a weighted blend of 9 inputs, each scored 0–100. Each bar is that input's sub-score; the figure is the points it added to the 100-point composite (weight × sub-score).
- Cash flow +21.9/30.0
- ARV discount +15.0/15.0
- DSCR +7.0/10.0
- 1% rule +6.0/10.0
- Schools +4.7/10.0
- Livability +3.5/5.0
- Rent growth +2.7/5.0
- Condition / age +2.5/5.0
- Appreciation +0.0/10.0
$179,999
🖨 Deal sheet (PDF) 📄 Offer letter ✓ Due diligence
Listing remarks
Great entry-level opportunity in the heart of Lewisville. This 3-bedroom, 1.5- bath home offers 1,307 SF on a spacious lot and is priced well below nearby comparable homes, making it ideal for investors, first-time buyers, or anyone looking to add value through updates. Conveniently located near major highways, shopping, dining, and Lewisville Lake.
Key facts
- 6,840 sq ft lot
- Built 1962
- Listed 6 days
Property features AI
Finance
- Other: Property is listed for sale and currently Active Under Contract
- Financial info: No second mortgage; Loan type listed as: Treat As Clear
- HOA & community: No homeowners association
Exterior
- Parking: Driveway; On-street parking; No garage or carport spaces
- Security: No specific security features provided
- Utilities: City water; City sewer; Electricity available; Cable available
- Home design: Single family residence; Residential property; One story; Built in 1962; Not attached to another property
- Construction: Year built 1962; No additional construction material or roof/foundation details provided
- Exterior features: Lot under 0.5 acre (approximately 0.157 acres); Approximate lot size 6,840 square feet; Subdivision: Lakeland Terrace 2
Interior
- Kitchen: Includes appliances (listed as other)
- Bedrooms: Three bedrooms (all on main level); Primary bedroom on main level
- Flooring: No flooring details provided
- Bathrooms: One full bathroom; One half bathroom
- Heating & cooling: No heating or cooling details provided
- Interior features: Cable TV available; High-speed internet available; Seven total rooms; One living area; One dining area; Single-level home
- Laundry & utility: No specific washer/dryer details provided
Neighborhood map
What this means for you Summary
Snapshot
- This is a 3-bed/1.0-bath single-family listed at $180k.
Deal economics
- At list price, monthly cash flow is $283 ($3k/yr) — positive.
- The deal already cash-flows at list — no discount required.
- Meets the 1% rule at list price ($2k rent vs $180k).
- Cap rate 8.2% vs local median 3.2% in Lewisville — top-decile yield for the area; either an underpriced asset or a hidden risk that comps aren't pricing in. Stress-test before assuming the spread holds.
Location & tenants
- Location reads 69/100 on livability (#440 in TX) — a middle-class / working-renter tenant base. Strengths: housing A+, cost of living A, crime B+; Watch: commute D+, amenities F, health & safety F.
- Lewisville ISD (suburban): math 49% / reading 54% proficiency, ranked #109 of 826 in TX (top 13%) — acceptable for families but not a draw, mixed tenant base, ~2y average lease.
- Zoned schools: Lakeland El (math 20% / reading 21%, grade F, #3,515 of 4,322 statewide, top 82%, 620 students, 89% FRL) — zoned schools average 89% FRL vs 26% district-wide (63 pts higher); higher-poverty schools than district average — tighter screening recommended.
- Zoned-school proficiency averages 20% at this address vs 52% district-wide (-31 pts) — the specific schools serving this property underperform the Lewisville ISD average; the district grade overstates school quality for this exact location.
- Market conditions: Rents flat; 223 active listings in the ZIP; 40 comparable units currently listed for rent nearby; rentals leasing fast (median 8d on market — plan ~1-2 weeks tenant-placement turnaround); solid renter incomes; 10,531 units permitted in Denton County in 2024 (2,713 in 5+ unit buildings).
- This rent runs 30% of the median local income ($79k/yr) — at the standard rent-burdened threshold; future hikes will face affordability resistance.
Forward outlook
- Local home prices are declining (-3.0%/yr); year-one equity from $1k of loan paydown is wiped out by about $5k of value loss. Plan a longer hold.
- Denton County population projected at +66% by 2050 — long-run rental-demand tailwind backs the buy-and-hold thesis.
Negotiation context
- Only 6 days on market — expect competitive offers; lowballing is unlikely to land.
Risks & watch-outs
- Climate carrying-cost: moderate wind risk, 24% chance of damaging wind over 30y; extreme-heat days projected 7→22/yr by 2055 (HVAC capex compounding) — expect insurance premiums to compound above CPI over the hold.
Questions for the listing agent
- Built in 1962 — when were the roof, HVAC, electrical panel, plumbing, and water heater last replaced?
- Is there a deadline driving the sale (1031 exchange, divorce, estate, relocation)? That informs how much negotiation room exists.
- Schools are D-rated, which usually means shorter tenancies and higher turnover. Who's the typical renter profile here, and what's been the actual vacancy rate?
- What's the average days-on-market for RENTAL listings here right now (not sales)? A rising rental-DOM trend means longer vacancies and softer asking-rent achievability than the comps imply.
- What's the recent tenant-quality profile in this submarket — average credit score on applications, eviction rate, late-payment / NSF rate, and stable-employment percentage? A property-management company in the area should have these aggregated.
- How much new for-sale + rental construction is in the pipeline within 1–3 miles? Heavy new supply typically softens prices + rents 12–24 months out; constrained supply supports both.
Investment metrics
- 1% rule
- 1.10% ✓
- Cap rate
- 8.18%
- Cash-on-cash
- 6.74%
- DSCR
- 1.30
- GRM
- 7.6
CMA / ARV
- ARV (median comp)
- $274,230
- List price
- $179,999
- Delta
- -34.36%
- Verdict
- UNDERPRICED
- Comps
- 20 within 1.0 mi
Show comp detail 12 sales within ~0.75 mi
| Address | Dist | Beds/Ba | Sqft | Sold | Price | $/sf | Match |
|---|---|---|---|---|---|---|---|
| 361 N Shore Pl | 0.00mi | 3/1.5 | 1,307 (0%) | 0mo | $179,999 | $138 | 98 |
| 109 Ridgeway Cir | 0.34mi | 3/2.0 | 1,393 (+7%) | 0mo | $265,000 | $190 | 69 |
| 1054 Shadow Wood Ln | 0.25mi | 4/2.0 (+1) | 1,362 (+4%) | 6mo | $310,000 | $228 | 68 |
| 115 Price Dr | 0.38mi | 3/2.0 | 1,193 (-9%) | 0mo | $205,000 | $172 | 63 |
| 1713 Live Oak Dr | 0.73mi | 3/2.0 | 1,319 (+1%) | 2mo | $348,000 | $264 | 59 |
| 318 Price Dr | 0.67mi | 3/1.5 | 1,252 (-4%) | 1mo | $279,900 | $224 | 58 |
| 145 Price Dr | 0.43mi | 3/2.0 | 1,193 (-9%) | 7mo | $290,900 | $244 | 56 |
| 618 W Purnell Rd | 0.69mi | 3/1.0 | 1,244 (-5%) | 7mo | $220,000 | $177 | 54 |
| 408 Price Dr | 0.69mi | 3/1.5 | 1,240 (-5%) | 6mo | $250,000 | $202 | 52 |
| 562 Kent Dr | 0.47mi | 3/2.0 | 1,500 (+15%) | 0mo | $324,900 | $217 | 49 |
| 1273 Palisades Dr | 0.75mi | 4/2.0 (+1) | 1,380 (+6%) | 4mo | $229,900 | $167 | 43 |
| 524 Ridgecrest Dr | 0.57mi | 3/2.0 | 1,124 (-14%) | 4mo | $289,000 | $257 | 42 |
Match score weights: distance 35% · size 25% · config 20% · recency 20%. Top-matched comps best support the ARV.
Projected returns pro-forma
-3.0% appreciation · 0.86% rent growth · sell at horizon
- IRR
- -8.4%
- Equity multiple
- 0.70×
- Total profit
- $-15,252
- Equity at exit
- $26,838
- IRR
- -2.0%
- Equity multiple
- 0.88×
- Total profit
- $-6,233
- Equity at exit
- $15,563
Cash invested: $50,400 (down + closing). Projections, not guarantees.
Landlord ↔ Tenant lean methodology
- Overall (STATE)
- 87 Strongly Landlord-Friendly
- State Texas
- 87 Strongly Landlord-Friendly · R+5
- County
- — inherits STATE
- City
- — inherits STATE
ZIP-level market 75067
- Home prices YoY
- -22.7%
- Rents YoY
- 0.9%
- Active inventory
- 223
- Price-to-rent
- 7.6×
Monthly cashflow live
- Estimated rent
- $1,975 high interval (Pro) →
- Mortgage (P&I)
- −$944
- Tax from tax record
- −$259 /mo · $3,103/yr
- Insurance
- −$75
- HOA
- −$0
- Vacancy / Maint / Mgmt
- −$415
- Net cashflow
- $283
Break-even live
Sensitivity live
| Price | -10% $385 | -5% $334 | +0% $283 | +5% $232 | +10% $181 |
|---|---|---|---|---|---|
| Rent | -10% $127 | -5% $205 | +0% $283 | +5% $361 | +10% $439 |
| Rate | -1.0pp $374 | -0.5pp $329 | base $283 | +0.5pp $236 | +1.0pp $189 |
UW: 25.0% down · 7.5% · 30yr · 1.5% tax · 5.0% vac · 8.0% maint · 8.0% mgmt
Financing live
Cash to close
- Down payment
- $45,000
- Closing costs
- $5,400
- Reserves months
- —
- Total cash needed
- —
Loan-product check · same deal, 3 products live
Conventional
25% down · 7.5% · 30yr
- Down + closing
- —
- Monthly P&I
- —
- Monthly cashflow
- —
- DSCR
- —
- Eligible?
- —
Personal DTI + credit; lowest rate.
DSCR
20% down · 8.5% · 30yr
- Down + closing
- —
- Monthly P&I
- —
- Monthly cashflow
- —
- DSCR
- —
- Eligible?
- —
No personal income docs; deal must DSCR.
Hard money
10% down · 12.0% · 12mo
- Down + closing
- —
- Monthly P&I
- —
- Monthly cashflow
- —
- DSCR
- —
- Eligible?
- —
Short-term bridge; refi at stabilization.
Rent comps 40 comps
| Address | Beds | Baths | Sqft | Rent | $/sqft | DOM | Units | Dist |
|---|---|---|---|---|---|---|---|---|
| 324 N Shore Pl Lewisville, TX | 3.0 | 1.5 | 1160 | $2,150 | $1.85 | 21d | 1 | 0.04mi |
| 843 Harbor Dr Lewisville, TX | 3.0 | 1.0 | 1210 | $2,000 | $1.65 | 44d | 1 | 0.20mi |
| 220 S Shore Pl Lewisville, TX | 3.0 | 2.0 | 1291 | $1,925 | $1.49 | 44d | 1 | 0.30mi |
| 415 Crockett Lewisville, TX | 4.0 | 2.5 | 1634 | $2,500 | $1.53 | 8d | 1 | 0.52mi |
| 1531 S State Highway 121 Lewisville, TX | 1.0–3.0 | 1.0–2.0 | 928 | $2,024 | $2.18 | 0d | 82 | 0.55mi |
| 450 S Edna Ave Lewisville, TX | 3.0 | 2.5 | 1371 | $5,000 | $3.65 | 4d | 1 | 0.61mi |
| 1531 S State Highway 121 Unit 2118 Lewisville, TX | 2.0 | 2.0 | 1082 | $1,363 | $1.26 | 0d | 1 | 0.64mi |
| 1531 S State Highway 121 Apt 3121 Lewisville, TX | 3.0 | 2.0 | 1278 | $1,736 | $1.36 | 0d | 1 | 0.64mi |
| 712 Ridgecrest Dr Lewisville, TX | 3.0 | 2.0 | 1128 | $1,850 | $1.64 | 45d | 1 | 0.67mi |
| 535 S Mill St Lewisville, TX | 2.0 | 1.0–2.0 | 827 | $2,401 | $2.90 | 3d | 25 | 0.69mi |
| 760 S Edmonds Ln Lewisville, TX | 2.0 | 1.0 | 753 | $1,459 | $1.94 | 6d | 1 | 0.71mi |
| 201 W Southwest Pkwy Unit 2118 Lewisville, TX | 2.0 | 2.0 | 884 | $1,275 | $1.44 | 0d | 1 | 0.75mi |
| 400 W Main St Lewisville, TX | 1.0–3.0 | 1.0–2.0 | 1000 | $2,695 | $2.69 | 0d | 40 | 0.84mi |
| 1313 Monaco Dr Lewisville, TX | 3.0 | 2.0 | 1180 | $2,195 | $1.86 | 44d | 1 | 0.84mi |
| 213 Lily Ln Lewisville, TX | 3.0 | 3.5 | 1859 | $2,295 | $1.23 | 13d | 1 | 0.84mi |
| 617 Harvest Hill St Lewisville, TX | 2.0 | 2.0 | 1112 | $1,950 | $1.75 | 0d | 1 | 0.87mi |
| 602 Prairie Dell St Lewisville, TX | 2.0 | 2.0 | 1112 | $2,265 | $2.04 | 15d | 1 | 0.87mi |
| 601 Harvest Hill St Lewisville, TX | 2.0 | 2.0 | 1314 | $1,950 | $1.48 | 44d | 1 | 0.89mi |
| 100 E Main St Lewisville, TX | 1.0–2.0 | 1.0–2.0 | 1071 | $2,620 | $2.45 | 2d | 17 | 0.89mi |
| 120 Main St Lewisville, TX | 1.0–3.0 | 1.0–2.0 | 1542 | $3,464 | $2.25 | 0d | 13 | 0.89mi |
| 1420 Palisades Dr Lewisville, TX | 3.0 | 2.0 | 1229 | $1,924 | $1.57 | 21d | 1 | 0.89mi |
| 557 Hunters Glen St Lewisville, TX | 2.0 | 2.0 | 1314 | $1,800 | $1.37 | 18d | 1 | 0.96mi |
| 1679 S State Highway 121 Lewisville, TX | 2.0 | 2.0 | 1000 | $1,525 | $1.52 | 25d | 1 | 0.96mi |
| 998 Bellaire Blvd Unit 1031 Lewisville, TX | 3.0 | 2.0 | 1038 | $2,074 | $2.00 | 44d | 1 | 0.96mi |
| 998 Bellaire Blvd Unit 2121 Lewisville, TX | 2.0 | 2.0 | 889 | $1,360 | $1.53 | 0d | 1 | 0.96mi |
| 998 Bellaire Blvd Unit 3121 Lewisville, TX | 3.0 | 2.0 | 1038 | $1,953 | $1.88 | 0d | 1 | 0.96mi |
| 998 Bellaire Blvd Unit 1035 Lewisville, TX | 2.0 | 2.0 | 889 | $1,519 | $1.71 | 44d | 1 | 0.96mi |
| 376 W Walters St Lewisville, TX | 2.0 | 1.0 | 1008 | $1,650 | $1.64 | 44d | 1 | 0.97mi |
| 998 Bellaire Blvd Lewisville, TX | 2.0 | 2.0 | 889 | $1,520 | $1.71 | 4d | 1 | 0.97mi |
| 998 Bellaire Blvd Lewisville, TX | 3.0 | 2.0 | 1038 | $1,988 | $1.92 | 5d | 1 | 0.97mi |
| 998 Bellaire Blvd Lewisville, TX | 3.0 | 2.0 | 1038 | $2,076 | $2.00 | 44d | 1 | 0.97mi |
| 541 Hunters Glen St Lewisville, TX | 2.0 | 1.0 | 1050 | $1,675 | $1.60 | 44d | 1 | 0.98mi |
| 505 Legends Dr Lewisville, TX | 3.0 | 2.5 | 1554 | $2,450 | $1.58 | 44d | 1 | 1.00mi |
| 502 Harvest Hill St Lewisville, TX | 2.0 | 1.0 | 1143 | $1,895 | $1.66 | 8d | 1 | 1.00mi |
| 1716 S Edmonds Ln Lewisville, TX | 1.0–2.0 | 1.0–2.0 | 800 | $1,525 | $1.91 | 0d | 7 | 1.00mi |
| 200 Oak Knoll Cir Lewisville, TX | 1.0–2.0 | 1.0–2.0 | 820 | $1,273 | $1.55 | 0d | 59 | 1.01mi |
| 513 Hunters Glen St Lewisville, TX | 2.0 | 2.0 | 1314 | $1,950 | $1.48 | 44d | 1 | 1.01mi |
| 701 Idlewilde Dr Lewisville, TX | 3.0 | 2.0 | 1224 | $2,100 | $1.72 | 5d | 1 | 1.02mi |
| 807 Burr Oak Dr Lewisville, TX | 3.0 | 2.5 | 1720 | $2,490 | $1.45 | 25d | 1 | 1.08mi |
| 247 E Southwest Pkwy Lewisville, TX | 1.0–2.0 | 1.0–2.0 | 750 | $1,448 | $1.93 | 0d | 23 | 1.17mi |
Listing history 2 events
-
2026-05-15$179,999 Active 351-char remark
-
2025-08-07soldstatus
ⓘ Source: listings_history table (triggers on properties + properties_extension) + one-shot
backfill from property_details.listing_events for pre-trigger history.
Tax reassessment forecast TX · Resets to sale price
- Current annual tax
- $3,103 · $259/mo
- Projected year-2 tax
- $3,294 · $274/mo
- Expected delta
- +$191/yr (+$16/mo · 6.1%)
ⓘ Screening estimate from a state-policy table — verify with the county assessor before closing.
Climate risk First Street
- Flood 1/10 Low FEMA zone X (unshaded) · 0% chance over 30 yrs
- Wildfire 1/10 Low
- Heat 7/10 Severe 7 d/yr ≥109°F today · 22 d/yr by 30 yrs out
- Wind 5/10 Major 24% chance of damaging wind over 30 yrs
- Air quality 3/10 Moderate 3 unhealthy d/yr today · 4 by 30 yrs out
Nearby sold comps map
Loading sold comps map…
Walkable amenities ~0.75 mi
Loading nearby amenities…
Taxation est. · year 1
- Rental income
- $23,706
- − Mortgage interest
- −$10,083
- − Property taxes
- −$3,103
- − Insurance
- −$900
- − Repairs & maintenance
- −$1,896
- − Management
- −$1,896
- − Depreciation
- −$5,236
- Taxable income
- $590
- Est. tax owed @ 24.0%
- −$142
- After-tax cash flow
- $3,255/yr
For passive investors: Depreciation is non-cash, so a rental often shows a tax loss while cash-flowing — sheltering income. Rental losses are passive: they offset passive income freely, and up to $25,000/yr can offset ordinary (W-2) income if you actively participate and your MAGI is under $100k (phasing out to $0 by $150k); unused losses carry forward. On sale, claimed depreciation is recaptured at up to 25%, and gains may owe capital-gains tax (a 1031 exchange can defer both). Figures are a year-1 estimate at your 24.0% rate — not tax advice; consult a CPA.
Schools (NCES district)
- District
- Lewisville ISD
- NCES district ID
- 4827300
- Math proficiency
- 49% ▼ -10.00%
- Reading proficiency
- 54% ▼ -4.00%
- Median HH income
- $82,351
- Composite
- 47.1/100
- National rank
- #2333
- State rank
- #109 of 826 in TX
Livability — Lewisville
- Score
- 69/100
- State rank
- #440
- US rank
- #8991
Category grades
Schools grade is shown separately in the Schools card above.
Census & demographics
- Census place
- Lewisville, TX
- County
- Denton County · 901,654 people
- City population
- 84,871
- Metro
- Dallas-Fort Worth-Arlington, TX
- Population (ZIP)
- 66,913
- Household income
- $78,752
- Rent vs Own
- Severe rent burden
- 3630.0
Population outlook (Denton County) Hauer SSP2
- Today (2025)
- 1,053,010 people
- By 2030
- 1,192,269 · +13.2%
- By 2040
- 1,472,920 · +39.9%
- By 2050
- 1,746,506 · +65.9%
- By 2075
- 2,358,497 · +124.0%
- By 2100
- 2,779,183 · +163.9%
Race, ethnicity, and origin ACS 2023
- Neighborhood character
- Highly diverse neighborhood (Simpson 0.72)
- Race & ethnicity
- White 35% Hispanic / Latino 34% Black 16% Two or more races 16% Asian 11% Native American 1%
- Hispanic origin (detail)
- Mexican 25% Puerto Rican 2%
- Common ancestry
- Slovak 1% Romanian 1% Lithuanian 1%
- Foreign-born
- 24% · Canada, Philippines, South Korea
- Languages at home
- 61% English-only · Spanish 27% Other Asian/Pacific 4% Other Indo-European 2%
Political lean MEDSL · Denton
- 2024 margin
- R (+13.2) · D 42.7% · R 55.8% · Other 1.5%
- 2008→2024 swing
- +11.0pp toward D · 2008: -24.2pp · 2024: -13.2pp
- All cycles
- 2024: R+13.2 2020: R+8.1 2016: R+20.2 2012: R+31.7 2008: R+24.2
Not yet ingested
- Civics
- —
Market trends
- HPI YoY
- ▼ -82.21%
- Current HPI
- 279.3299
- Rent YoY
- ▲ 0.86%
- Metro
- Dallas-Fort Worth-Arlington, TX
- State GDP YoY
- ▲ 3.95%
- F500 in state
- 110
Industry mix (Fortune 500 HQ in TX)
| Industry | F500 HQs | Revenue |
|---|---|---|
| Energy | 16 | $1,198B |
|
||
| Technology | 5 | $198B |
|
||
| Engineering / Construction | 4 | $72B |
|
||
| Energy Services | 3 | $60B |
|
||
| Utilities | 3 | $41B |
|
||
| Healthcare | 2 | $330B |
|
||
Price history
5 events — show timeline
- 2026-06-11 Sold (MLS) — NTREIS
- 2026-05-21 Pending — NTREIS
- 2026-05-19 Contingent — NTREIS
- 2026-05-15 Listed $179,999 NTREIS
- 2025-08-07 Sold (Public Records) — Public Records
Property tax history
+2.8%/yrLatest (2025): $3,103 · -20.5% YoY. Source: county tax records.
Cash-flow waterfall
monthlySold comps — $/sqft
last 12 mo · ≤1 miLoading sold comps…