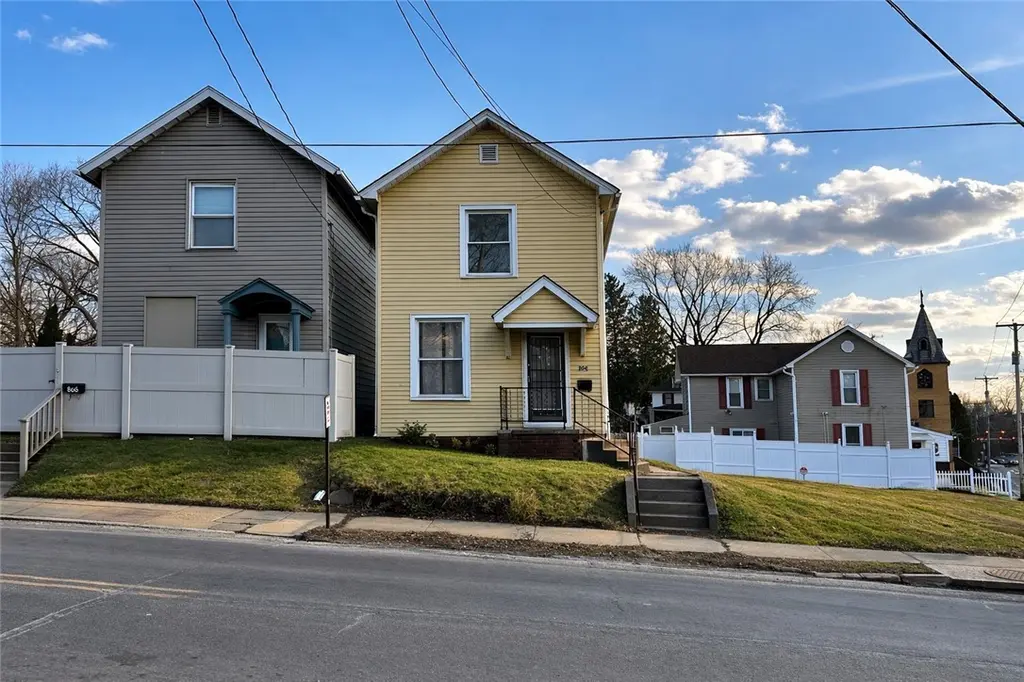
804 Butler Ave · New Castle, PA
Flood risk 1/10 · Minimal
- FEMA flood zone
- X (unshaded)
- Chance of flooding over 30 yrs
- 0.0%
- Est. flood insurance / yr
- $473 – $860
Fire risk 1/10 · Minimal
- Est. fire insurance / yr
- $511 – $949
Heat risk 3/10 · Minor
- Hot days now (above 96°F)
- 7 days/yr
- Hot days in 30 yrs
- 17 days/yr
Wind risk 1/10 · Minimal
- Chance of severe wind over 30 yrs
- —
Air-quality risk 2/10 · Minimal
- Unhealthy air days now
- 1 days/yr
- Unhealthy air days in 30 yrs
- 3 days/yr
Risk factors via First Street. Map © Google.
Why this score? — see what drove the C+ grade
The composite is a weighted blend of 9 inputs, each scored 0–100. Each bar is that input's sub-score; the figure is the points it added to the 100-point composite (weight × sub-score).
- Cash flow +30.0/30.0
- 1% rule +10.0/10.0
- DSCR +10.0/10.0
- Rent growth +5.0/5.0
- Livability +4.1/5.0
- Condition / age +2.5/5.0
- Schools +1.1/10.0
- ARV discount +0.0/15.0
- Appreciation +0.0/10.0
$59,000
🖨 Deal sheet 📄 Offer letter ✓ Due diligence
Listing remarks MLS
This 2-bedroom, 1-bath home offers a functional layout with everyday convenience and strong potential for both homeowners and investors. Inside, you’ll find first-floor laundry and a spacious eat-in kitchen, providing practical living and comfortable gathering space. The home features rear parking for added convenience and accessibility. A major improvement has already been completed with the roof replaced within the past three years, offering peace of mind for years to come. Ideally located in the City of New Castle with easy access to U. S. Route 422 and Interstate 376, this property provides convenient commuting options while being close to local shops, dining, and everyday amenities. Whether you're looking to expand your investment portfolio or purchase a place to call home, this property presents a great opportunity.
Key facts
- Rear parking
- Close to local shops
- First-floor laundry
Tags
Neighborhood map
What this means for you Summary
Snapshot
- This is a 2-bed/1.5-bath single-family listed at $59k.
Deal economics
- At list price, monthly cash flow is $594 ($7k/yr) — positive.
- The deal already cash-flows at list — no discount required.
- Meets the 1% rule at list price ($1k rent vs $59k).
- Recommended offer: $54k (9.0% below list) — sets the bar for market timing.
- Cap rate 18.4% vs local median 8.7% in New Castle — top-decile yield for the area; either an underpriced asset or a hidden risk that comps aren't pricing in. Stress-test before assuming the spread holds.
Location & tenants
- Location reads 82/100 on livability (#137 in PA, #1,120 nationally) — a professional / high-income tenant draw. Strengths: crime A+, commute A+, cost of living A+; Watch: amenities F, employment F.
- New Castle Area SD (town): math 9% / reading 19% proficiency, ranked #519 of 539 in PA (top 96%) — low school quality limits family demand, transient renter base, plan for 1-2y turnover; 66% free/reduced lunch — lower-income household profile, screen leases tightly.
- Market conditions: Rents rising fast (+20.1%/yr); 118 active listings in the ZIP; 7 comparable units currently listed for rent nearby; rentals lingering (median 44d on market — plan ~5-8 weeks vacancy on turnover, expect pricing pressure); 100% of comp listings sitting > 30 days — soft ceiling on asking rent; 51 units permitted in Lawrence County in 2024 (0 in 5+ unit buildings).
Forward outlook
- Local home prices are declining (-3.0%/yr); year-one equity from $408 of loan paydown is wiped out by about $2k of value loss. Plan a longer hold.
- Lawrence County population projected at -25% by 2050 — secular population decline; favor cash flow + early exit over multi-decade hold.
- At projected returns (-3.0% appreciation + 8.0% rent growth), your $17k cash investment doubles in ~3 years — after that, you're playing with house money.
Negotiation context
- It's been on market 109 days — a 9% lower offer ($54k) is reasonable based on typical stale-listing flexibility.
- 10 sale attempts since 23y ago with the ask held roughly flat each time — persistent listings suggest the price (not the market) is what's stuck; bring a comps-based counter.
- Current owner paid $12k; list at $59k implies a 395% gain — meaningful room to come down on a strong offer.
Risks & watch-outs
- Watch-outs: built in 1931 — expect roof / HVAC / electrical / plumbing capex.
Questions for the listing agent
- It's been on market 109 days. Have you received any prior offers? Is the seller open to a 9% concession, seller financing, or rate buy-down credit?
- Built in 1931 — when were the roof, HVAC, electrical panel, plumbing, and water heater last replaced?
- Why hasn't it sold? Are there any deal-killer items the seller is aware of (foundation, flood, title, zoning, code violations)?
- Is there a deadline driving the sale (1031 exchange, divorce, estate, relocation)? That informs how much negotiation room exists.
- What's the average days-on-market for RENTAL listings here right now (not sales)? A rising rental-DOM trend means longer vacancies and softer asking-rent achievability than the comps imply.
- What's the recent tenant-quality profile in this submarket — average credit score on applications, eviction rate, late-payment / NSF rate, and stable-employment percentage? A property-management company in the area should have these aggregated.
- How much new for-sale + rental construction is in the pipeline within 1–3 miles? Heavy new supply typically softens prices + rents 12–24 months out; constrained supply supports both.
Investment metrics
- 1% rule
- 2.15% ✓
- Cap rate
- 18.37%
- Cash-on-cash
- 43.13%
- DSCR
- 2.92
- GRM
- 3.9
CMA / ARV
- ARV (median comp)
- $46,200
- List price
- $59,000
- Delta
- 27.71%
- Verdict
- OVERPRICED
- Comps
- 20 within 1.0 mi
Show comp detail 12 sales within ~0.75 mi
| Address | Dist | Beds/Ba | Sqft | Sold | Price | $/sf | Match |
|---|---|---|---|---|---|---|---|
| 827 Morton St | 0.29mi | 3/1.0 (+1) | 1,123 (+2%) | 0mo | $40,000 | $36 | 77 |
| 418 E Division St | 0.51mi | 3/1.5 (+1) | 1,120 (+1%) | 0mo | $18,000 | $16 | 69 |
| 1023 Beckford St | 0.52mi | 3/1.0 (+1) | 1,104 (-0%) | 3mo | $25,000 | $23 | 66 |
| 509 E Lutton St | 0.48mi | 2/1.0 | 1,059 (-4%) | 6mo | $40,000 | $38 | 64 |
| 1218 Finch St | 0.52mi | 2/2.0 | 1,128 (+2%) | 9mo | $128,000 | $113 | 63 |
| 311 E Reynolds St | 0.71mi | 2/1.0 | 1,136 (+3%) | 0mo | $10,000 | $9 | 60 |
| 1019 Summit St | 0.50mi | 2/1.0 | 1,026 (-7%) | 6mo | $65,000 | $63 | 58 |
| 221 Friendship St | 0.63mi | 2/1.0 | 1,184 (+7%) | 0mo | $23,000 | $19 | 56 |
| 939 Warren Ave | 0.75mi | 3/1.0 (+1) | 1,123 (+2%) | 0mo | $135,000 | $120 | 55 |
| 1042 Maryland Ave | 0.52mi | 3/1.0 (+1) | 1,204 (+9%) | 2mo | $54,000 | $45 | 52 |
| 428 E Division St | 0.48mi | 3/1.0 (+1) | 1,260 (+14%) | 6mo | $60,000 | $48 | 43 |
| 504 Waldo St | 0.74mi | 2/1.0 | 1,248 (+13%) | 10mo | $42,000 | $34 | 33 |
Match score weights: distance 35% · size 25% · config 20% · recency 20%. Top-matched comps best support the ARV.
Projected returns pro-forma
-3.0% appreciation · 8.0% rent growth · sell at horizon
- IRR
- 45.5%
- Equity multiple
- 3.12×
- Total profit
- $34,967
- Equity at exit
- $8,797
- IRR
- 53.6%
- Equity multiple
- 7.64×
- Total profit
- $109,686
- Equity at exit
- $5,101
Cash invested: $16,520 (down + closing). Projections, not guarantees.
Landlord ↔ Tenant lean methodology
- Overall (STATE)
- 62 Landlord-Friendly
- State Pennsylvania
- 62 Landlord-Friendly · EVEN
- County
- — inherits STATE
- City
- — inherits STATE
ZIP-level market 16101
- Home prices YoY
- -26.3%
- Rents YoY
- 20.1%
- Active inventory
- 118
- Price-to-rent
- 3.9×
Monthly cashflow live
- Estimated rent
- $1,267 high interval (Pro) →
- Mortgage (P&I)
- −$309
- Tax from tax record
- −$73 /mo · $877/yr
- Insurance
- −$25
- HOA
- −$0
- Vacancy / Maint / Mgmt
- −$266
- Net cashflow
- $594
Break-even live
UW: 25.0% down · 7.5% · 30yr · 1.5% tax · 5.0% vac · 8.0% maint · 8.0% mgmt
Financing live
Cash to close
- Down payment
- $14,750
- Closing costs
- $1,770
- Reserves months
- —
- Total cash needed
- —
Loan-product check · same deal, 3 products live
Conventional
25% down · 7.5% · 30yr
- Down + closing
- —
- Monthly P&I
- —
- Monthly cashflow
- —
- DSCR
- —
- Eligible?
- —
Personal DTI + credit; lowest rate.
DSCR
20% down · 8.5% · 30yr
- Down + closing
- —
- Monthly P&I
- —
- Monthly cashflow
- —
- DSCR
- —
- Eligible?
- —
No personal income docs; deal must DSCR.
Hard money
10% down · 12.0% · 12mo
- Down + closing
- —
- Monthly P&I
- —
- Monthly cashflow
- —
- DSCR
- —
- Eligible?
- —
Short-term bridge; refi at stabilization.
Rent comps 7 comps
| Address | Beds | Baths | Sqft | Rent | $/sqft | DOM | Units | Dist |
|---|---|---|---|---|---|---|---|---|
| 932 Morton St New Castle, PA | 3.0 | 1.0 | 1440 | $1,375 | $0.95 | 43d | 1 | 0.22mi |
| 1112 Williams St New Castle, PA | 2.0 | 1.0 | 1026 | $1,400 | $1.36 | 43d | 1 | 0.40mi |
| 712 E Reynolds St New Castle, PA | 3.0 | 1.0 | 1182 | $975 | $0.82 | 43d | 1 | 0.46mi |
| 1056 Adams St New Castle, PA | 3.0 | 1.0 | 1116 | $1,500 | $1.34 | 43d | 1 | 0.64mi |
| 503 Galbreath St New Castle, PA | 2.0 | 1.0 | 1228 | $1,295 | $1.05 | 43d | 1 | 0.83mi |
| 1605 S Jefferson St New Castle, PA | 3.0 | 1.0 | 1500 | $1,500 | $1.00 | 43d | 1 | 1.10mi |
| 1708 Moravia St New Castle, PA | 3.0 | 2.0 | 1500 | $1,500 | $1.00 | 43d | 1 | 1.34mi |
Listing history 41 events
-
2026-06-19days on market $59,000 Active 109 DOM
-
2026-06-18days on market $59,000 Active 108 DOM
-
2026-06-17days on market $59,000 Active 107 DOM
-
2026-06-16days on market $59,000 Active 106 DOM
-
2026-06-15days on market $59,000 Active 105 DOM
-
2026-06-14days on market $59,000 Active 103 DOM
-
2026-06-12days on market $59,000 Active 102 DOM
-
2026-06-09days on market $59,000 Active 99 DOM
-
2026-06-08days on market $59,000 Active 98 DOM
-
2026-06-07days on market $59,000 Active 97 DOM
-
2026-06-03days on market $59,000 Active 93 DOM
-
2026-06-02days on market $59,000 Active 92 DOM
-
2026-06-01days on market $59,000 Active 91 DOM
-
2026-05-31days on market $59,000 Active 90 DOM
-
2026-05-30days on market $59,000 Active 89 DOM
-
2026-03-02$59,000 Active 839-char remark
Show marketing remark (839 chars)
This 2-bedroom, 1-bath home offers a functional layout with everyday convenience and strong potential for both homeowners and investors. Inside, you’ll find first-floor laundry and a spacious eat-in kitchen, providing practical living and comfortable gathering space. The home features rear parking for added convenience and accessibility. A major improvement has already been completed with the roof replaced within the past three years, offering peace of mind for years to come. Ideally located in the City of New Castle with easy access to U. S. Route 422 and Interstate 376, this property provides convenient commuting options while being close to local shops, dining, and everyday amenities. Whether you're looking to expand your investment portfolio or purchase a place to call home, this property presents a great opportunity.
-
2020-11-30soldstatus $11,925
-
2020-11-20soldstatus $11,925 Closed 127-char remark
Show marketing remark (127 chars)
2 bedroom, 1 bath. Attention all investors this property is currently tenant occupied and is a solid income producing property.
-
2020-10-27status Pending 127-char remark
Show marketing remark (127 chars)
2 bedroom, 1 bath. Attention all investors this property is currently tenant occupied and is a solid income producing property.
-
2020-09-25historical Contingent 127-char remark
Show marketing remark (127 chars)
2 bedroom, 1 bath. Attention all investors this property is currently tenant occupied and is a solid income producing property.
-
2020-08-08$15,900 Active 127-char remark
Show marketing remark (127 chars)
2 bedroom, 1 bath. Attention all investors this property is currently tenant occupied and is a solid income producing property.
-
2020-08-08historical
Show marketing remark (127 chars)
2 bedroom, 1 bath. Attention all investors this property is currently tenant occupied and is a solid income producing property.
-
2020-03-18status Active
-
2020-02-22status Under Contract
-
2019-08-08$15,900 Active
-
2019-07-30historical Expired
-
2019-04-22status Active
-
2019-04-05status Under Contract
-
2019-03-18status Active
-
2019-03-17status Under Contract
-
2018-12-07price $18,900
-
2018-07-30$19,900 Active
-
2018-07-19historical Expired
-
2018-03-16price $19,900
-
2018-02-13status Active
-
2017-10-24status Under Contract
-
2017-10-23historical Withdrawn
-
2017-07-21$25,000 Active
-
2003-09-11soldstatus $6,000
-
2003-03-20$6,500
-
1997-09-22soldstatus $13,128
ⓘ Source: listings_history table (triggers on properties + properties_extension) + one-shot
backfill from property_details.listing_events for pre-trigger history.
Tax reassessment forecast PA · Partial reset (capped growth)
- Current annual tax
- $877 · $73/mo
- Projected year-2 tax
- $905 · $75/mo
- Expected delta
- +$28/yr (+$2/mo · 3.1%)
ⓘ Screening estimate from a state-policy table — verify with the county assessor before closing.
Climate risk First Street
- Flood 1/10 Low FEMA zone X (unshaded) · 0% chance over 30 yrs
- Wildfire 1/10 Low
- Heat 3/10 Moderate 7 d/yr ≥96°F today · 17 d/yr by 30 yrs out
- Wind 1/10 Low
- Air quality 2/10 Low 1 unhealthy d/yr today · 3 by 30 yrs out
Nearby sold comps map
Loading sold comps map…
Walkable amenities ~0.75 mi
Loading nearby amenities…
Taxation est. · year 1
- Rental income
- $15,202
- − Mortgage interest
- −$3,305
- − Property taxes
- −$877
- − Insurance
- −$295
- − Repairs & maintenance
- −$1,216
- − Management
- −$1,216
- − Depreciation
- −$1,716
- Taxable income
- $6,576
- Est. tax owed @ 24.0%
- −$1,578
- After-tax cash flow
- $5,546/yr
For passive investors: Depreciation is non-cash, so a rental often shows a tax loss while cash-flowing — sheltering income. Rental losses are passive: they offset passive income freely, and up to $25,000/yr can offset ordinary (W-2) income if you actively participate and your MAGI is under $100k (phasing out to $0 by $150k); unused losses carry forward. On sale, claimed depreciation is recaptured at up to 25%, and gains may owe capital-gains tax (a 1031 exchange can defer both). Figures are a year-1 estimate at your 24.0% rate — not tax advice; consult a CPA.
Schools (NCES district)
- District
- New Castle Area SD
- NCES district ID
- 4216620
- Math proficiency
- 9% ▼ -13.00%
- Reading proficiency
- 19% ▼ -23.00%
- Median HH income
- $30,967
- Composite
- 11.08/100
- National rank
- #9736
- State rank
- #519 of 539 in PA
Livability — New Castle
- Score
- 82/100
- State rank
- #137
- US rank
- #1120
Category grades
Schools grade is shown separately in the Schools card above.
Census & demographics
- Census place
- New Castle, PA
- County
- Lawrence County · 30,767 people
- City population
- 30,767
- Metro
- New Castle, PA
- Population (ZIP)
- 30,767
- Household income
- $51,128
- Rent vs Own
- Severe rent burden
- 1047.0
Population outlook (Lawrence County) Hauer SSP2
- Today (2025)
- 81,781 people
- By 2030
- 77,978 · -4.7%
- By 2040
- 69,522 · -15.0%
- By 2050
- 61,344 · -25.0%
- By 2075
- 45,027 · -44.9%
- By 2100
- 31,305 · -61.7%
Race, ethnicity, and origin ACS 2023
- Neighborhood character
- Predominantly White (82%)
- Race & ethnicity
- White 82% Two or more races 8% Black 7% Hispanic / Latino 3%
- Common ancestry
- Romanian 7% Serbian 3% Iranian 1%
- Foreign-born
- 2% · Canada
- Languages at home
- 96% English-only · Spanish 2% Other Indo-European 1%
Political lean MEDSL · Lawrence
- 2024 margin
- Solid R (+33.8) · D 32.8% · R 66.5%
- 2008→2024 swing
- -28.7pp toward R · 2008: -5.1pp · 2024: -33.8pp
- All cycles
- 2024: R+33.8 2020: R+29.6 2016: R+28.1 2012: R+9.0 2008: R+5.1
Not yet ingested
- Civics
- —
Market trends
- HPI YoY
- ▼ -56.77%
- Current HPI
- 159.3091
- Rent YoY
- ▲ 20.05%
- Metro
- New Castle, PA
- State GDP YoY
- ▲ 1.68%
- F500 in state
- 34
Industry mix (Fortune 500 HQ in PA)
| Industry | F500 HQs | Revenue |
|---|---|---|
| Healthcare | 2 | $309B |
|
||
| Insurance | 2 | $27B |
|
||
| Telecommunications / Media | 1 | $124B |
|
||
| Industrial Distribution | 1 | $22B |
|
||
| Financial Services | 1 | $20B |
|
||
| Chemicals / Materials | 1 | $18B |
|
||
Price history
+349.4% since first listed26 events — show timeline
- 2026-03-02 Listed $59,000 West Penn MLS
- 2020-11-30 Sold (Public Records) $11,925 Public Records
- 2020-11-20 Sold (MLS) $11,925 West Penn MLS
- 2020-10-27 Pending — West Penn MLS
- 2020-09-25 Contingent — West Penn MLS
- 2020-08-08 Listed $15,900 West Penn MLS
- 2020-08-08 Delisted — West Penn MLS
- 2020-03-18 Relisted — West Penn MLS
- 2020-02-22 Pending — West Penn MLS
- 2019-08-08 Listed $15,900 West Penn MLS
- 2019-07-30 Delisted — West Penn MLS
- 2019-04-22 Relisted — West Penn MLS
- 2019-04-05 Pending — West Penn MLS
- 2019-03-18 Relisted — West Penn MLS
- 2019-03-17 Pending — West Penn MLS
- 2018-12-07 Price Changed $18,900 West Penn MLS
- 2018-07-30 Listed $19,900 West Penn MLS
- 2018-07-19 Delisted — West Penn MLS
- 2018-03-16 Price Changed $19,900 West Penn MLS
- 2018-02-13 Relisted — West Penn MLS
- 2017-10-24 Pending — West Penn MLS
- 2017-10-23 Delisted — West Penn MLS
- 2017-07-21 Listed $25,000 West Penn MLS
- 2003-09-11 Sold (MLS) $6,000 West Penn MLS
- 2003-03-20 Listed $6,500 West Penn MLS
- 1997-09-22 Sold (Public Records) $13,128 Public Records
Property tax history
+1.3%/yrLatest (2025): $877 · -0.5% YoY. Source: county tax records.
Cash-flow waterfall
monthlySold comps — $/sqft
last 12 mo · ≤1 miLoading sold comps…