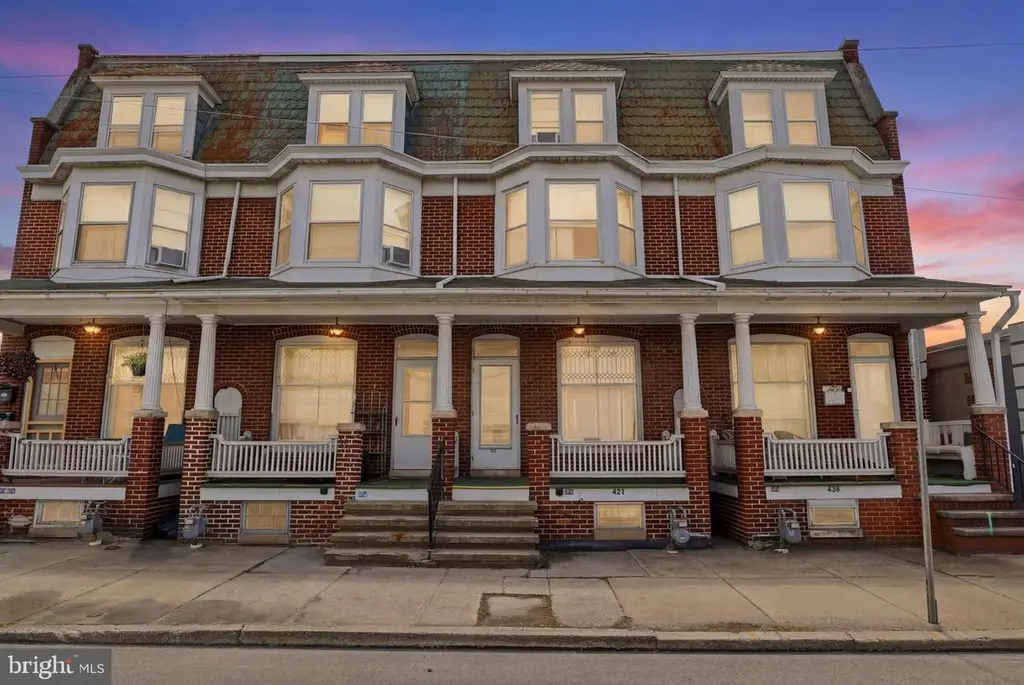
421 York St · Hanover, PA
Flood risk 1/10 · Minimal
- FEMA flood zone
- X (unshaded)
- Chance of flooding over 30 yrs
- 0.0%
- Est. flood insurance / yr
- $473 – $860
Fire risk 1/10 · Minimal
- Est. fire insurance / yr
- $511 – $949
Heat risk 6/10 · Moderate
- Hot days now (above 102°F)
- 7 days/yr
- Hot days in 30 yrs
- 15 days/yr
Wind risk 4/10 · Minor
- Chance of severe wind over 30 yrs
- 8.0%
Air-quality risk 2/10 · Minimal
- Unhealthy air days now
- 1 days/yr
- Unhealthy air days in 30 yrs
- 3 days/yr
Risk factors via First Street. Map © Google.
Why this score? — see what drove the B- grade
The composite is a weighted blend of 9 inputs, each scored 0–100. Each bar is that input's sub-score; the figure is the points it added to the 100-point composite (weight × sub-score).
- Cash flow +23.6/30.0
- ARV discount +15.0/15.0
- DSCR +7.6/10.0
- 1% rule +7.0/10.0
- Livability +3.8/5.0
- Rent growth +3.7/5.0
- Schools +3.7/10.0
- Condition / age +2.5/5.0
- Appreciation +0.0/10.0
$160,000
🖨 Deal sheet 📄 Offer letter ✓ Due diligence
Listing remarks MLS
Use your $8,000 tax credit to buy this spacious row home. Updated furnace, relative maintenance free. Washer/dryer main level. Partially finished basement, lots ofcharm. Seller will consider the possibility of holding the mortgage for qualified applicants.
Key facts
- Garage
- Built 1914
- Listed 5 days
Property features AI
Finance
- Financial info: Taxes reported for 2025–2026
Exterior
- Parking: Detached rear-entry garage (1 car)
- Utilities: Public water; Public sewer; Electric service available
- Home design: Semi-detached property; Fee simple ownership
- Construction: Brick construction; Brick/mortar foundation; Built information per assessor
- Exterior features: Not in a federal flood zone; Above-grade and below-grade structures
Interior
- Bedrooms: 4 bedrooms on the upper level
- Bathrooms: 1 full bathroom
- Heating & cooling: Hot water and central heating; Natural gas heating and natural gas hot water; Window AC units
- Interior features: Full basement
Neighborhood map
What this means for you Summary
Snapshot
- This is a 4-bed/1.0-bath townhouse listed at $160k.
Deal economics
- At list price, monthly cash flow is $303 ($4k/yr) — positive.
- The deal already cash-flows at list — no discount required.
- Meets the 1% rule at list price ($2k rent vs $160k).
- Cap rate 8.6% vs local median 3.9% in Hanover — top-decile yield for the area; either an underpriced asset or a hidden risk that comps aren't pricing in. Stress-test before assuming the spread holds.
Location & tenants
- Location reads 76/100 on livability (#373 in PA, #3,295 nationally) — a middle-class / working-renter tenant base. Strengths: cost of living A+, housing A+, health & safety A+; Watch: amenities C-, employment D, commute F.
- Hanover Public SD (urban): math 34% / reading 54% proficiency, ranked #294 of 539 in PA (top 54%) — families likely to look elsewhere, expect single-tenant / working-renter base with shorter leases.
- Market conditions: Rents rising fast (+4.7%/yr); 386 active listings in the ZIP; 16 comparable units currently listed for rent nearby; rentals lingering (median 44d on market — plan ~5-8 weeks vacancy on turnover, expect pricing pressure); 62% of comp listings sitting > 30 days — soft ceiling on asking rent; solid renter incomes; 1,328 units permitted in York County in 2024 (338 in 5+ unit buildings).
Forward outlook
- Local home prices are declining (-3.0%/yr); year-one equity from $1k of loan paydown is wiped out by about $5k of value loss. Plan a longer hold.
- At projected returns (-3.0% appreciation + 4.7% rent growth), your $45k cash investment doubles in ~10 years — after that, you're playing with house money.
Negotiation context
- Only 5 days on market — expect competitive offers; lowballing is unlikely to land.
- 2 sale attempts since 17y ago with the ask held roughly flat each time — persistent listings suggest the price (not the market) is what's stuck; bring a comps-based counter.
- Current owner paid $95k; list at $160k implies a 68% gain — meaningful room to come down on a strong offer.
Risks & watch-outs
- Watch-outs: built in 1914 — expect roof / HVAC / electrical / plumbing capex.
- Climate carrying-cost: extreme-heat days projected 7→15/yr by 2055 (HVAC capex compounding) — expect insurance premiums to compound above CPI over the hold.
Questions for the listing agent
- Built in 1914 — when were the roof, HVAC, electrical panel, plumbing, and water heater last replaced?
- Is there a deadline driving the sale (1031 exchange, divorce, estate, relocation)? That informs how much negotiation room exists.
- What's the average days-on-market for RENTAL listings here right now (not sales)? A rising rental-DOM trend means longer vacancies and softer asking-rent achievability than the comps imply.
- What's the recent tenant-quality profile in this submarket — average credit score on applications, eviction rate, late-payment / NSF rate, and stable-employment percentage? A property-management company in the area should have these aggregated.
- How much new for-sale + rental construction is in the pipeline within 1–3 miles? Heavy new supply typically softens prices + rents 12–24 months out; constrained supply supports both.
Investment metrics
- 1% rule
- 1.20% ✓
- Cap rate
- 8.57%
- Cash-on-cash
- 8.12%
- DSCR
- 1.36
- GRM
- 7.0
CMA / ARV
- ARV (median comp)
- $192,023
- List price
- $160,000
- Delta
- -16.68%
- Verdict
- UNDERPRICED
- Comps
- 20 within 1.0 mi
Show comp detail 12 sales within ~0.75 mi
| Address | Dist | Beds/Ba | Sqft | Sold | Price | $/sf | Match |
|---|---|---|---|---|---|---|---|
| 552 Locust St | 0.20mi | 3/2.5 (-1) | 1,820 (-5%) | 1mo | $257,900 | $142 | 70 |
| 56 Coop Ln | 0.70mi | 3/2.5 (-1) | 1,900 (-1%) | 0mo | $285,000 | $150 | 54 |
| 233 Frederick St | 0.64mi | 3/2.5 (-1) | 1,928 (+0%) | 6mo | $255,000 | $132 | 53 |
| 111 S Center St | 0.52mi | 3/2.5 (-1) | 1,790 (-7%) | 4mo | $280,000 | $156 | 50 |
| 31 S Center St | 0.45mi | 3/2.5 (-1) | 1,710 (-11%) | 4mo | $300,000 | $175 | 46 |
| 222 N Franklin St | 0.75mi | 3/1.5 (-1) | 1,795 (-7%) | 2mo | $209,000 | $116 | 46 |
| 517 Charles Ave | 0.55mi | 3/2.5 (-1) | 1,696 (-12%) | 2mo | $297,900 | $176 | 42 |
| 524 Charles Ave | 0.52mi | 3/2.5 (-1) | 1,730 (-10%) | 9mo | $255,000 | $147 | 41 |
| 418 Springbrook Ct | 0.54mi | 3/2.0 (-1) | 1,648 (-14%) | 4mo | $254,900 | $155 | 39 |
| 54 Coop Ln | 0.70mi | 3/2.5 (-1) | 1,720 (-11%) | 0mo | $290,000 | $169 | 38 |
| 97 Overlook Dr | 0.72mi | 4/2.5 | 1,696 (-12%) | 3mo | $275,000 | $162 | 38 |
| 144 Overlook Dr | 0.65mi | 3/2.5 (-1) | 1,690 (-12%) | 1mo | $295,000 | $175 | 38 |
Match score weights: distance 35% · size 25% · config 20% · recency 20%. Top-matched comps best support the ARV.
Projected returns pro-forma
-3.0% appreciation · 4.67% rent growth · sell at horizon
- IRR
- -1.9%
- Equity multiple
- 0.93×
- Total profit
- $-3,260
- Equity at exit
- $23,857
- IRR
- 9.7%
- Equity multiple
- 1.81×
- Total profit
- $36,293
- Equity at exit
- $13,834
Cash invested: $44,800 (down + closing). Projections, not guarantees.
Landlord ↔ Tenant lean methodology
- Overall (STATE)
- 62 Landlord-Friendly
- State Pennsylvania
- 62 Landlord-Friendly · EVEN
- County
- — inherits STATE
- City
- — inherits STATE
ZIP-level market 17331
- Home prices YoY
- -33.8%
- Rents YoY
- 4.7%
- Active inventory
- 386
- Price-to-rent
- 7.0×
Monthly cashflow live
- Estimated rent
- $1,917 high interval (Pro) →
- Mortgage (P&I)
- −$839
- Tax from tax record
- −$305 /mo · $3,665/yr
- Insurance
- −$67
- HOA
- −$0
- Vacancy / Maint / Mgmt
- −$403
- Net cashflow
- $303
Break-even live
UW: 25.0% down · 7.5% · 30yr · 1.5% tax · 5.0% vac · 8.0% maint · 8.0% mgmt
Financing live
Cash to close
- Down payment
- $40,000
- Closing costs
- $4,800
- Reserves months
- —
- Total cash needed
- —
Loan-product check · same deal, 3 products live
Conventional
25% down · 7.5% · 30yr
- Down + closing
- —
- Monthly P&I
- —
- Monthly cashflow
- —
- DSCR
- —
- Eligible?
- —
Personal DTI + credit; lowest rate.
DSCR
20% down · 8.5% · 30yr
- Down + closing
- —
- Monthly P&I
- —
- Monthly cashflow
- —
- DSCR
- —
- Eligible?
- —
No personal income docs; deal must DSCR.
Hard money
10% down · 12.0% · 12mo
- Down + closing
- —
- Monthly P&I
- —
- Monthly cashflow
- —
- DSCR
- —
- Eligible?
- —
Short-term bridge; refi at stabilization.
Rent comps 16 comps
| Address | Beds | Baths | Sqft | Rent | $/sqft | DOM | Units | Dist |
|---|---|---|---|---|---|---|---|---|
| 76 Brookside Ave Hanover, PA | 3.0 | 2.5 | 1625 | $1,963 | $1.21 | 21d | 1 | 0.55mi |
| 76 Brookside Ave Hanover, PA | 3.0 | 2.5 | 1625 | $1,906 | $1.17 | 43d | 1 | 0.55mi |
| 88 Brookside Ave Hanover, PA | 3.0 | 2.5 | 1625 | $1,906 | $1.17 | 43d | 1 | 0.56mi |
| 88 Brookside Ave Hanover, PA | 3.0 | 2.5 | 1625 | $1,963 | $1.21 | 21d | 1 | 0.56mi |
| 28 McCosh St Hanover, PA | 3.0 | 1.0 | 1800 | $2,050 | $1.14 | 13d | 1 | 0.70mi |
| 261 N Franklin St Unit 302 Hanover, PA | 3.0 | 2.0 | 1398 | $1,130 | $0.81 | 43d | 1 | 0.71mi |
| 409 Carlisle St Unit A Hanover, PA | 3.0 | 1.0 | 2372 | $1,200 | $0.51 | 13d | 1 | 0.79mi |
| 51 Overlook Dr Unit J Hanover, PA | 3.0 | 2.5 | 1820 | $2,120 | $1.16 | 43d | 1 | 0.86mi |
| 51 Overlook Dr Unit F Hanover, PA | 3.0 | 2.5 | 1820 | $1,983 | $1.09 | 43d | 1 | 0.86mi |
| 101 Pacer Dr Unit L Hanover, PA | 3.0 | 2.5 | 1252 | $1,901 | $1.52 | 13d | 1 | 0.86mi |
| 101 Pacer Dr Unit K Hanover, PA | 3.0 | 2.5 | 1252 | $1,846 | $1.47 | 43d | 1 | 0.86mi |
| 101 Pacer Dr Unit M Hanover, PA | 3.0 | 2.5 | 1252 | $1,751 | $1.40 | 43d | 1 | 0.86mi |
| 22 Mustang Dr Hanover, PA | 3.0 | 2.5 | 1625 | $1,843 | $1.13 | 43d | 1 | 0.86mi |
| 40 Mustang Dr Hanover, PA | 4.0 | 2.5 | 1625 | $1,843 | $1.13 | 43d | 1 | 0.87mi |
| 20 Mustang Dr Hanover, PA | 4.0 | 2.5 | 1625 | $1,931 | $1.19 | 43d | 1 | 0.88mi |
| 34 Overlook Dr Hanover, PA | 3.0 | 2.5 | 1749 | $2,000 | $1.14 | 13d | 1 | 0.88mi |
Listing history 7 events
-
2026-05-18$160,000 Active 759-char remark
-
2026-04-27historical $160,000 759-char remark
-
2010-07-08soldstatus $95,000
-
2010-06-30soldstatus $95,000 256-char remark
Show marketing remark (256 chars)
Use your $8,000 tax credit to buy this spacious row home. Updated furnace, relative maintenance free. Washer/dryer main level. Partially finished basement, lots ofcharm. Seller will consider the possibility of holding the mortgage for qualified applicants.
-
2010-04-30historical 256-char remark
Show marketing remark (256 chars)
Use your $8,000 tax credit to buy this spacious row home. Updated furnace, relative maintenance free. Washer/dryer main level. Partially finished basement, lots ofcharm. Seller will consider the possibility of holding the mortgage for qualified applicants.
-
2009-07-03$97,900 256-char remark
Show marketing remark (256 chars)
Use your $8,000 tax credit to buy this spacious row home. Updated furnace, relative maintenance free. Washer/dryer main level. Partially finished basement, lots ofcharm. Seller will consider the possibility of holding the mortgage for qualified applicants.
-
2008-10-01soldstatus $68,000
ⓘ Source: listings_history table (triggers on properties + properties_extension) + one-shot
backfill from property_details.listing_events for pre-trigger history.
Tax reassessment forecast PA · Partial reset (capped growth)
- Current annual tax
- $3,665 · $305/mo
- Projected year-2 tax
- $3,665 · $305/mo
- Expected delta
- $0/yr ($0/mo · 0.0%)
ⓘ Screening estimate from a state-policy table — verify with the county assessor before closing.
Climate risk First Street
- Flood 1/10 Low FEMA zone X (unshaded) · 0% chance over 30 yrs
- Wildfire 1/10 Low
- Heat 6/10 Major 7 d/yr ≥102°F today · 15 d/yr by 30 yrs out
- Wind 4/10 Moderate 8% chance of damaging wind over 30 yrs
- Air quality 2/10 Low 1 unhealthy d/yr today · 3 by 30 yrs out
Nearby sold comps map
Loading sold comps map…
Walkable amenities ~0.75 mi
Loading nearby amenities…
Taxation est. · year 1
- Rental income
- $23,000
- − Mortgage interest
- −$8,962
- − Property taxes
- −$3,665
- − Insurance
- −$800
- − Repairs & maintenance
- −$1,840
- − Management
- −$1,840
- − Depreciation
- −$4,655
- Taxable income
- $1,238
- Est. tax owed @ 24.0%
- −$297
- After-tax cash flow
- $3,339/yr
For passive investors: Depreciation is non-cash, so a rental often shows a tax loss while cash-flowing — sheltering income. Rental losses are passive: they offset passive income freely, and up to $25,000/yr can offset ordinary (W-2) income if you actively participate and your MAGI is under $100k (phasing out to $0 by $150k); unused losses carry forward. On sale, claimed depreciation is recaptured at up to 25%, and gains may owe capital-gains tax (a 1031 exchange can defer both). Figures are a year-1 estimate at your 24.0% rate — not tax advice; consult a CPA.
Schools (NCES district)
- District
- Hanover Public SD
- NCES district ID
- 4211450
- Math proficiency
- 34% ▼ -11.00%
- Reading proficiency
- 54% ▼ -8.00%
- Median HH income
- $45,022
- Composite
- 37.26/100
- National rank
- #4457
- State rank
- #294 of 539 in PA
Livability — Hanover
- Score
- 76/100
- State rank
- #373
- US rank
- #3295
Category grades
Schools grade is shown separately in the Schools card above.
Census & demographics
- Census place
- Hanover, PA
- County
- York County · 278,806 people
- City population
- 56,443
- Metro
- York-Hanover, PA
- Population (ZIP)
- 56,443
- Household income
- $79,488
- Rent vs Own
- Severe rent burden
- 1076.0
Population outlook (York County) Hauer SSP2
- Today (2025)
- 454,205 people
- By 2030
- 457,407 · +0.7%
- By 2040
- 457,529 · +0.7%
- By 2050
- 448,261 · -1.3%
- By 2075
- 427,388 · -5.9%
- By 2100
- 384,218 · -15.4%
Race, ethnicity, and origin ACS 2023
- Neighborhood character
- Predominantly White (86%)
- Race & ethnicity
- White 86% Hispanic / Latino 7% Two or more races 7% Black 3% Asian 1%
- Hispanic origin (detail)
- Mexican 3% Puerto Rican 2%
- Common ancestry
- Romanian 3% Lithuanian 2% Slovak 2%
- Foreign-born
- 4% · Canada
- Languages at home
- 95% English-only · Spanish 3%
Political lean MEDSL · York
- 2024 margin
- Strong R (+25.3) · D 36.9% · R 62.1%
- 2008→2024 swing
- -11.7pp toward R · 2008: -13.6pp · 2024: -25.3pp
- All cycles
- 2024: R+25.3 2020: R+24.6 2016: R+29.3 2012: R+21.2 2008: R+13.6
Not yet ingested
- Civics
- —
Market trends
- HPI YoY
- ▼ -128.48%
- Current HPI
- 251.8974
- Rent YoY
- ▲ 4.67%
- Metro
- York-Hanover, PA
- State GDP YoY
- ▲ 1.68%
- F500 in state
- 34
Industry mix (Fortune 500 HQ in PA)
| Industry | F500 HQs | Revenue |
|---|---|---|
| Healthcare | 2 | $309B |
|
||
| Insurance | 2 | $27B |
|
||
| Telecommunications / Media | 1 | $124B |
|
||
| Industrial Distribution | 1 | $22B |
|
||
| Financial Services | 1 | $20B |
|
||
| Chemicals / Materials | 1 | $18B |
|
||
Price history
+135.3% since first listed8 events — show timeline
- 2026-05-22 Pending — BRIGHT MLS
- 2026-05-18 Listed $160,000 BRIGHT MLS
- 2026-04-27 Coming Soon $160,000 BRIGHT MLS
- 2010-07-08 Sold (Public Records) $95,000 Public Records
- 2010-06-30 Sold (MLS) $95,000 BRIGHT MLS
- 2010-04-30 Listing Removed — BRIGHT MLS
- 2009-07-03 Listed $97,900 BRIGHT MLS
- 2008-10-01 Sold (Public Records) $68,000 Public Records
Property tax history
+1.9%/yrLatest (2026): $3,665 · +1.8% YoY. Source: county tax records.
Cash-flow waterfall
monthlySold comps — $/sqft
last 12 mo · ≤1 miLoading sold comps…