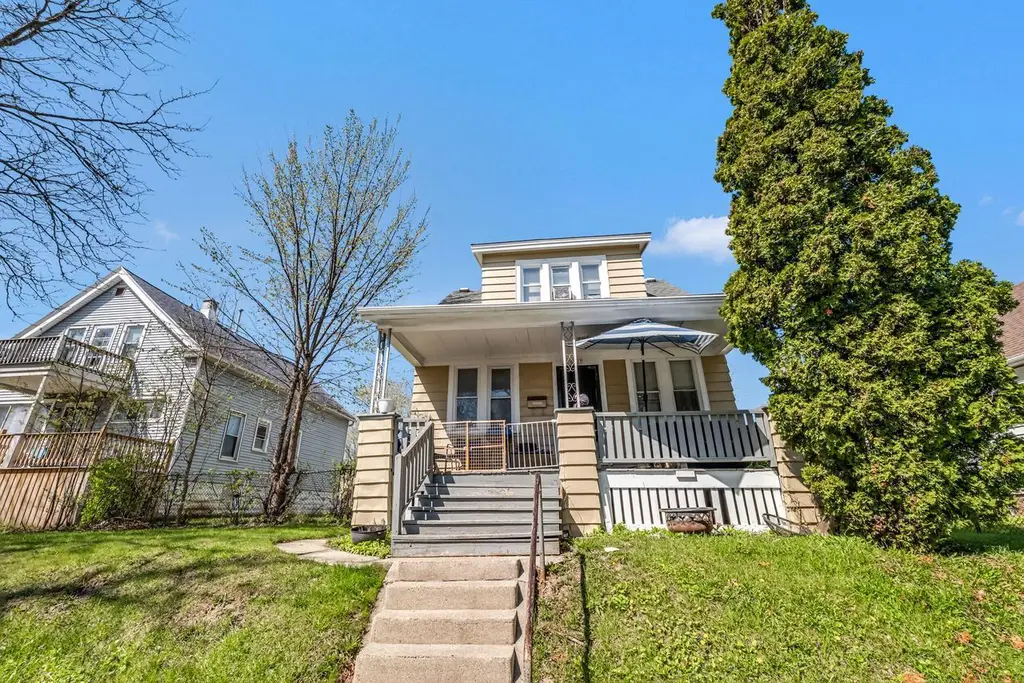
5017 N 38th St · Milwaukee, WI
Flood risk 1/10 · Minimal
- FEMA flood zone
- X (unshaded)
- Chance of flooding over 30 yrs
- 0.0%
- Est. flood insurance / yr
- $473 – $860
Fire risk 1/10 · Minimal
- Est. fire insurance / yr
- $636 – $1,182
Heat risk 2/10 · Minimal
- Hot days now (above 98°F)
- 7 days/yr
- Hot days in 30 yrs
- 13 days/yr
Wind risk 2/10 · Minimal
- Chance of severe wind over 30 yrs
- —
Air-quality risk 2/10 · Minimal
- Unhealthy air days now
- 2 days/yr
- Unhealthy air days in 30 yrs
- 2 days/yr
Risk factors via First Street. Map © Google.
Why this score? — see what drove the D grade
The composite is a weighted blend of 9 inputs, each scored 0–100. Each bar is that input's sub-score; the figure is the points it added to the 100-point composite (weight × sub-score).
- Cash flow +19.0/30.0
- DSCR +6.0/10.0
- 1% rule +5.0/10.0
- Rent growth +4.7/5.0
- Livability +4.0/5.0
- Condition / age +2.5/5.0
- Schools +1.2/10.0
- ARV discount +0.0/15.0
- Appreciation +0.0/10.0
$169,900
🖨 Deal sheet 📄 Offer letter ✓ Due diligence
Listing remarks MLS
This 4 bedroom single family home is the perfect investment. Currently rented for $1,100 per month, this property is a fantastic investment opportunity. Schedule a showing today!
Key facts
- Oak leaf trail
- 3,484 sq ft lot
- 2 garage spots
Tags
Property features AI
Exterior
- Parking: Detached 2-car garage
- Utilities: Municipal water; Municipal sewer
- Home design: 1.5-story single-family home; Lot under 1/2 acre (approximately 0.08 acre); Zoning: RT3
- Construction: Built (year source: assessor/public record)
- Exterior features: Vinyl exterior; Sidewalks
Interior
- Kitchen: Main-level kitchen (approx. 10 x 10)
- Bedrooms: Master bedroom on main level (approx. 10 x 10); Second bedroom on main level (approx. 10 x 10); Third bedroom on upper level (approx. 10 x 10); Fourth bedroom on upper level (approx. 10 x 10)
- Bathrooms: One full bathroom
- Heating & cooling: Forced air heating; Natural gas heat
- Interior features: Full basement; Main-level living room
- Laundry & utility: Forced air heating (natural gas)
Neighborhood map
What this means for you Summary
Snapshot
- This is a 4-bed/1.0-bath single-family listed at $170k.
Deal economics
- At list price, monthly cash flow is $176 ($2k/yr) — positive.
- The deal already cash-flows at list — no discount required.
- Meets the 1% rule at list price ($2k rent vs $170k).
- Recommended offer: $165k (3.0% below list) — sets the bar for market timing.
- Cap rate 7.5% vs local median 5.1% in Milwaukee — top-decile yield for the area; either an underpriced asset or a hidden risk that comps aren't pricing in. Stress-test before assuming the spread holds.
Location & tenants
- Location reads 81/100 on livability (#55 in WI, #1,534 nationally) — a professional / high-income tenant draw. Strengths: amenities A+, commute A+, cost of living A+; Watch: employment D+, schools F, crime F.
- Milwaukee School District (urban): math 10% / reading 18% proficiency, ranked #337 of 342 in WI (top 98%) — low school quality limits family demand, transient renter base, plan for 1-2y turnover; 77% free/reduced lunch — lower-income household profile, screen leases tightly.
- Market conditions: Rents rising fast (+8.6%/yr); 168 active listings in the ZIP; 14 comparable units currently listed for rent nearby; rentals at typical pace (median 24d on market — plan ~3-4 weeks tenant-placement turnaround); 1,017 units permitted in Milwaukee County in 2024 (803 in 5+ unit buildings).
- This rent runs 42% of the median local income ($48k/yr) — at the standard rent-burdened threshold; future hikes will face affordability resistance.
Forward outlook
- Local home prices are declining (-3.0%/yr); year-one equity from $1k of loan paydown is wiped out by about $5k of value loss. Plan a longer hold.
- Milwaukee County population projected at +4% by 2050 — modest demand growth; plan on rents tracking national, not racing it.
- At projected returns (-3.0% appreciation + 8.0% rent growth), your $48k cash investment doubles in ~10 years — after that, you're playing with house money.
Negotiation context
- It's been on market 56 days — a 3% lower offer ($165k) is reasonable based on typical stale-listing flexibility.
- 4 sale attempts since 5y ago with the ask held roughly flat each time — persistent listings suggest the price (not the market) is what's stuck; bring a comps-based counter.
Risks & watch-outs
- Watch-outs: built in 1919 — expect roof / HVAC / electrical / plumbing capex.
Questions for the listing agent
- It's been on market 56 days. Have you received any prior offers? Is the seller open to a 3% concession, seller financing, or rate buy-down credit?
- Built in 1919 — when were the roof, HVAC, electrical panel, plumbing, and water heater last replaced?
- Is there a deadline driving the sale (1031 exchange, divorce, estate, relocation)? That informs how much negotiation room exists.
- Schools are F-rated, which usually means shorter tenancies and higher turnover. Who's the typical renter profile here, and what's been the actual vacancy rate?
- Crime grade is F in this area — have there been break-ins, vandalism, or insurance claims at this property in the last 3 years? What carrier currently insures it and at what premium?
- The area grade is low — what's the realistic commute time and amenity access for the typical tenant pool here? Any planned neighborhood developments (good or bad) we should know about?
- What's the average days-on-market for RENTAL listings here right now (not sales)? A rising rental-DOM trend means longer vacancies and softer asking-rent achievability than the comps imply.
- What's the recent tenant-quality profile in this submarket — average credit score on applications, eviction rate, late-payment / NSF rate, and stable-employment percentage? A property-management company in the area should have these aggregated.
- How much new for-sale + rental construction is in the pipeline within 1–3 miles? Heavy new supply typically softens prices + rents 12–24 months out; constrained supply supports both.
Investment metrics
- 1% rule
- 1.00% ✓
- Cap rate
- 7.54%
- Cash-on-cash
- 4.45%
- DSCR
- 1.20
- GRM
- 8.3
CMA / ARV
- ARV (median comp)
- $137,274
- List price
- $169,900
- Delta
- 23.77%
- Verdict
- OVERPRICED
- Comps
- 20 within 1.0 mi
Show comp detail 12 sales within ~0.75 mi
| Address | Dist | Beds/Ba | Sqft | Sold | Price | $/sf | Match |
|---|---|---|---|---|---|---|---|
| 4926 N 37th St | 0.14mi | 3/1.0 (-1) | 1,357 (-1%) | 2mo | $138,500 | $102 | 84 |
| 4025 W Fairmount Ave | 0.16mi | 4/2.0 | 1,350 (-2%) | 4mo | $151,000 | $112 | 82 |
| 3223 W Fairmount Ave | 0.35mi | 4/1.0 | 1,358 (-1%) | 3mo | $124,000 | $91 | 80 |
| 5324 N 34th St | 0.48mi | 4/1.0 | 1,324 (-4%) | 2mo | $75,000 | $57 | 70 |
| 5378 N 36th St | 0.49mi | 4/2.0 | 1,345 (-2%) | 1mo | $165,000 | $123 | 69 |
| 5331 N 37th St | 0.40mi | 3/1.0 (-1) | 1,306 (-5%) | 0mo | $133,000 | $102 | 68 |
| 4633 N 30th St | 0.69mi | 4/1.0 | 1,407 (+2%) | 1mo | $141,000 | $100 | 63 |
| 5460 N 37th St | 0.57mi | 3/1.0 (-1) | 1,436 (+5%) | 2mo | $125,000 | $87 | 59 |
| 5403 N 37th St | 0.49mi | 4/1.5 | 1,498 (+9%) | 4mo | $129,000 | $86 | 57 |
| 4650 N 38th St | 0.47mi | 3/1.0 (-1) | 1,237 (-10%) | 0mo | $145,000 | $117 | 56 |
| 4557 N 42nd St | 0.64mi | 3/1.0 (-1) | 1,228 (-11%) | 3mo | $185,000 | $151 | 45 |
| 5549 N 33rd St | 0.75mi | 3/2.5 (-1) | 1,241 (-10%) | 3mo | $176,000 | $142 | 36 |
Match score weights: distance 35% · size 25% · config 20% · recency 20%. Top-matched comps best support the ARV.
Projected returns pro-forma
-3.0% appreciation · 8.0% rent growth · sell at horizon
- IRR
- -3.9%
- Equity multiple
- 0.85×
- Total profit
- $-7,271
- Equity at exit
- $25,333
- IRR
- 10.8%
- Equity multiple
- 2.03×
- Total profit
- $49,205
- Equity at exit
- $14,690
Cash invested: $47,572 (down + closing). Projections, not guarantees.
Landlord ↔ Tenant lean methodology
- Overall (STATE)
- 73 Landlord-Friendly
- State Wisconsin
- 73 Landlord-Friendly · R+2
- County
- — inherits STATE
- City
- — inherits STATE
ZIP-level market 53209
- Rents YoY
- 8.6%
- Active inventory
- 168
- Price-to-rent
- 8.3×
Monthly cashflow live
- Estimated rent
- $1,704 high interval (Pro) →
- Mortgage (P&I)
- −$891
- Tax from tax record
- −$208 /mo · $2,493/yr
- Insurance
- −$71
- HOA
- −$0
- Vacancy / Maint / Mgmt
- −$358
- Net cashflow
- $176
Break-even live
UW: 25.0% down · 7.5% · 30yr · 1.5% tax · 5.0% vac · 8.0% maint · 8.0% mgmt
Financing live
Cash to close
- Down payment
- $42,475
- Closing costs
- $5,097
- Reserves months
- —
- Total cash needed
- —
Loan-product check · same deal, 3 products live
Conventional
25% down · 7.5% · 30yr
- Down + closing
- —
- Monthly P&I
- —
- Monthly cashflow
- —
- DSCR
- —
- Eligible?
- —
Personal DTI + credit; lowest rate.
DSCR
20% down · 8.5% · 30yr
- Down + closing
- —
- Monthly P&I
- —
- Monthly cashflow
- —
- DSCR
- —
- Eligible?
- —
No personal income docs; deal must DSCR.
Hard money
10% down · 12.0% · 12mo
- Down + closing
- —
- Monthly P&I
- —
- Monthly cashflow
- —
- DSCR
- —
- Eligible?
- —
Short-term bridge; refi at stabilization.
Rent comps 14 comps
| Address | Beds | Baths | Sqft | Rent | $/sqft | DOM | Units | Dist |
|---|---|---|---|---|---|---|---|---|
| 5032 N 32nd St Milwaukee, WI | 3.0 | 2.0 | 1089 | $1,750 | $1.61 | 12d | 1 | 0.38mi |
| 4334 W Eggert Pl Milwaukee, WI | 4.0 | 1.0 | 1077 | $1,695 | $1.57 | 23d | 1 | 0.41mi |
| 4340 W Eggert Pl Milwaukee, WI | 4.0 | 1.0 | 1066 | $1,695 | $1.59 | 23d | 1 | 0.42mi |
| 5165-5167 N 45th St Unit 5165 Milwaukee, WI | 3.0 | 1.0 | 1020 | $1,200 | $1.18 | 16d | 1 | 0.49mi |
| 4702 N 44th St Milwaukee, WI | 3.0 | 2.0 | 1050 | $1,850 | $1.76 | 43d | 1 | 0.59mi |
| 4703 N 45th St Milwaukee, WI | 3.0 | 1.0 | 1031 | $1,695 | $1.64 | 23d | 1 | 0.65mi |
| 5073 N 48th St Milwaukee, WI | 4.0 | 1.0 | 1152 | $1,595 | $1.38 | 14d | 1 | 0.66mi |
| 5541 N 35th St #5543 Milwaukee, WI | 3.0 | 1.0 | 1130 | $1,195 | $1.06 | 4d | 1 | 0.67mi |
| 4727 N 46th St Milwaukee, WI | 3.0 | 1.0 | 936 | $1,700 | $1.82 | 43d | 1 | 0.68mi |
| 5696 N 42nd St Milwaukee, WI | 4.0 | 1.0 | 1023 | $1,495 | $1.46 | 23d | 1 | 0.88mi |
| 4900 N 58th St Milwaukee, WI | 3.0 | 1.0 | 1455 | $1,450 | $1.00 | 4d | 1 | 1.27mi |
| 3931 W Kaul Ave Milwaukee, WI | 3.0 | 1.0 | 1400 | $1,695 | $1.21 | 43d | 1 | 1.37mi |
| 4139 N 50th St Milwaukee, WI | 3.0 | 1.0 | 1275 | $1,600 | $1.25 | 43d | 1 | 1.40mi |
| 3925 N 42nd St Milwaukee, WI | 3.0 | 1.0 | 1300 | $1,675 | $1.29 | 43d | 1 | 1.43mi |
Listing history 25 events
-
2026-06-18days on market $169,900 Active 56 DOM
-
2026-06-17days on market $169,900 Active 55 DOM
-
2026-06-16days on market $169,900 Active 54 DOM
-
2026-06-15days on market $169,900 Active 53 DOM
-
2026-06-13days on market $169,900 Active 51 DOM
-
2026-06-13days on market $169,900 Active 50 DOM
-
2026-06-09days on market $169,900 Active 47 DOM
-
2026-06-08days on market $169,900 Active 46 DOM
-
2026-06-07days on market $169,900 Active 45 DOM
-
2026-06-05days on market $169,900 Active 42 DOM
-
2026-06-03days on market $169,900 Active 41 DOM
-
2026-06-02days on market $169,900 Active 40 DOM
-
2026-06-01days on market $169,900 Active 39 DOM
-
2026-05-31days on market $169,900 Active 38 DOM
-
2026-04-23$169,900 Active 775-char remark
-
2024-02-14historical 178-char remark
Show marketing remark (178 chars)
This 4 bedroom single family home is the perfect investment. Currently rented for $1,100 per month, this property is a fantastic investment opportunity. Schedule a showing today!
-
2023-09-27$119,900 Active 178-char remark
Show marketing remark (178 chars)
This 4 bedroom single family home is the perfect investment. Currently rented for $1,100 per month, this property is a fantastic investment opportunity. Schedule a showing today!
-
2023-05-23historical
Show marketing remark (204 chars)
Cash Flowing single family home rented for 1250/mo. Don't miss out on this investment opportunity. Seller also has other properties that could be a package deal mls #'s 1823815, 1823814, 1823810, 1823811.
-
2023-02-03$119,900 Active
Show marketing remark (204 chars)
Cash Flowing single family home rented for 1250/mo. Don't miss out on this investment opportunity. Seller also has other properties that could be a package deal mls #'s 1823815, 1823814, 1823810, 1823811.
-
2022-08-01price $1,250
-
2022-03-30historical
-
2022-03-07price $125,900
-
2021-12-02$99,900 Active
-
2021-10-13soldstatus $570,000
-
1994-09-01soldstatus $41,500
ⓘ Source: listings_history table (triggers on properties + properties_extension) + one-shot
backfill from property_details.listing_events for pre-trigger history.
Tax reassessment forecast WI · Partial reset (capped growth)
- Current annual tax
- $2,493 · $208/mo
- Projected year-2 tax
- $2,818 · $235/mo
- Expected delta
- +$325/yr (+$27/mo · 13.0%)
ⓘ Screening estimate from a state-policy table — verify with the county assessor before closing.
Climate risk First Street
- Flood 1/10 Low FEMA zone X (unshaded) · 0% chance over 30 yrs
- Wildfire 1/10 Low
- Heat 2/10 Low 7 d/yr ≥98°F today · 13 d/yr by 30 yrs out
- Wind 2/10 Low
- Air quality 2/10 Low 2 unhealthy d/yr today · 2 by 30 yrs out
Nearby sold comps map
Loading sold comps map…
Walkable amenities ~0.75 mi
Loading nearby amenities…
Taxation est. · year 1
- Rental income
- $20,444
- − Mortgage interest
- −$9,517
- − Property taxes
- −$2,493
- − Insurance
- −$850
- − Repairs & maintenance
- −$1,636
- − Management
- −$1,636
- − Depreciation
- −$4,943
- Taxable loss
- −$629
- Est. tax savings @ 24.0%
- +$151
- After-tax cash flow
- $2,268/yr
For passive investors: Depreciation is non-cash, so a rental often shows a tax loss while cash-flowing — sheltering income. Rental losses are passive: they offset passive income freely, and up to $25,000/yr can offset ordinary (W-2) income if you actively participate and your MAGI is under $100k (phasing out to $0 by $150k); unused losses carry forward. On sale, claimed depreciation is recaptured at up to 25%, and gains may owe capital-gains tax (a 1031 exchange can defer both). Figures are a year-1 estimate at your 24.0% rate — not tax advice; consult a CPA.
Schools (NCES district)
- District
- Milwaukee School District
- NCES district ID
- 5509600
- Math proficiency
- 10% ▼ -5.00%
- Reading proficiency
- 18% ▬ 0.00%
- Median HH income
- $36,339
- Composite
- 11.61/100
- National rank
- #9696
- State rank
- #337 of 342 in WI
Livability — Milwaukee
- Score
- 81/100
- State rank
- #55
- US rank
- #1534
Category grades
Schools grade is shown separately in the Schools card above.
Census & demographics
- Census place
- Milwaukee, WI
- County
- Milwaukee County · 926,379 people
- City population
- 573,768
- Metro
- Milwaukee-Waukesha, WI
- Population (ZIP)
- 45,170
- Household income
- $48,486
- Rent vs Own
- Severe rent burden
- 3390.0
Population outlook (Milwaukee County) Hauer SSP2
- Today (2025)
- 995,758 people
- By 2030
- 1,009,124 · +1.3%
- By 2040
- 1,028,128 · +3.3%
- By 2050
- 1,040,066 · +4.4%
- By 2075
- 1,057,849 · +6.2%
- By 2100
- 1,039,774 · +4.4%
Race, ethnicity, and origin ACS 2023
- Neighborhood character
- Predominantly Black (66%)
- Race & ethnicity
- Black 66% White 22% Hispanic / Latino 5% Two or more races 5% Asian 2%
- Hispanic origin (detail)
- Mexican 2% Puerto Rican 3%
- Common ancestry
- Romanian 3% Portuguese 1% Iranian 1%
- Foreign-born
- 3% · Canada
- Languages at home
- 92% English-only · Spanish 4% Other Asian/Pacific 1% Russian/Polish/Slavic 1%
Political lean MEDSL · Milwaukee
- 2024 margin
- Solid D (+38.5) · D 68.3% · R 29.8% · Other 1.8%
- 2008→2024 swing
- +2.7pp toward D · 2008: 35.9pp · 2024: 38.5pp
- All cycles
- 2024: D+38.5 2020: D+39.9 2016: D+37.5 2012: D+34.6 2008: D+35.9
Not yet ingested
- Civics
- —
Market trends
- HPI YoY
- ▼ -194.98%
- Current HPI
- 172.4275
- Rent YoY
- ▲ 8.61%
- Metro
- Milwaukee-Waukesha, WI
- State GDP YoY
- ▲ 2.10%
- F500 in state
- 20
Industry mix (Fortune 500 HQ in WI)
| Industry | F500 HQs | Revenue |
|---|---|---|
| Industrial Machinery | 4 | $23B |
|
||
| Industrial Technology | 2 | $36B |
|
||
| Insurance | 1 | $36B |
|
||
| Professional Services | 1 | $19B |
|
||
| Utilities | 1 | $9B |
|
||
| Consumer Goods | 1 | $3B |
|
||
Price history
+309.4% since first listed11 events — show timeline
- 2026-04-23 Listed $169,900 METROMLS
- 2024-02-14 Listing Removed — METROMLS
- 2023-09-27 Listed $119,900 METROMLS
- 2023-05-23 Listing Removed — METROMLS
- 2023-02-03 Listed $119,900 METROMLS
- 2022-08-01 Price Changed $1,250 RENT.
- 2022-03-30 Listing Removed — METROMLS
- 2022-03-07 Price Changed $125,900 METROMLS
- 2021-12-02 Listed $99,900 METROMLS
- 2021-10-13 Sold (Public Records) $570,000 Public Records
- 1994-09-01 Sold (Public Records) $41,500 Public Records
Property tax history
+2.6%/yrLatest (2024): $2,493 · -15.5% YoY. Source: county tax records.
Cash-flow waterfall
monthlySold comps — $/sqft
last 12 mo · ≤1 miLoading sold comps…