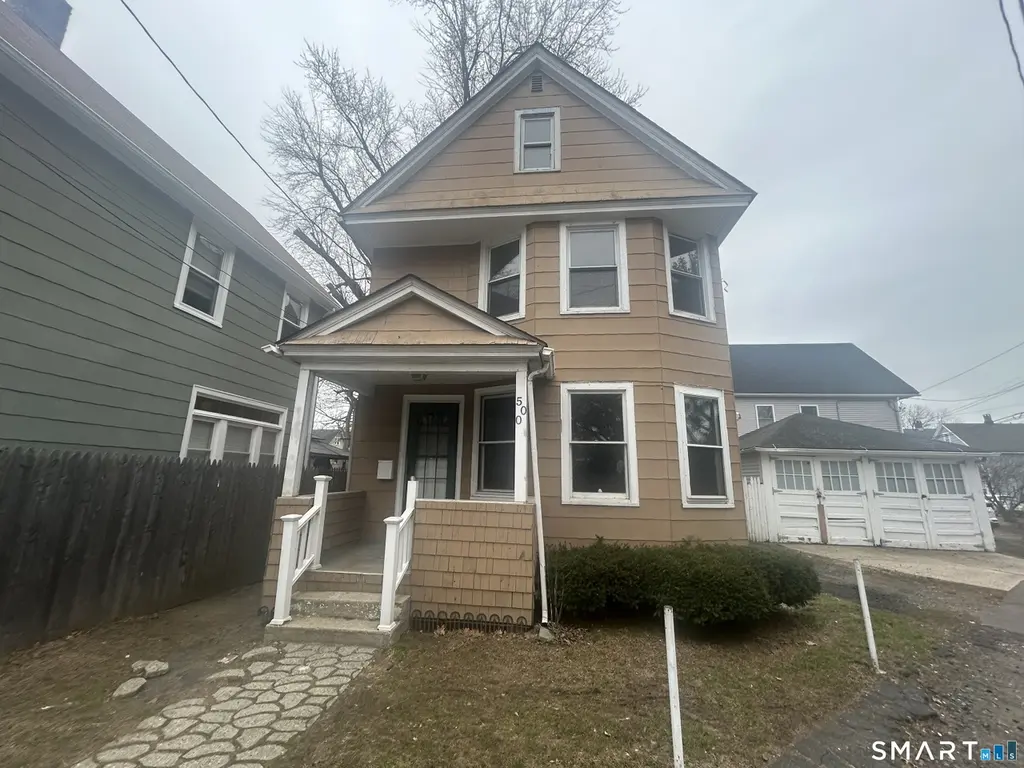
500 Dewey St · Bridgeport, CT
Flood risk 1/10 · Minimal
- FEMA flood zone
- X (unshaded)
- Chance of flooding over 30 yrs
- 0.0%
- Est. flood insurance / yr
- $473 – $860
Fire risk 1/10 · Minimal
- Est. fire insurance / yr
- $829 – $1,539
Heat risk 6/10 · Moderate
- Hot days now (above 97°F)
- 7 days/yr
- Hot days in 30 yrs
- 15 days/yr
Wind risk 6/10 · Moderate
- Chance of severe wind over 30 yrs
- 66.0%
Air-quality risk 4/10 · Minor
- Unhealthy air days now
- 5 days/yr
- Unhealthy air days in 30 yrs
- 7 days/yr
Risk factors via First Street. Map © Google.
Why this score? — see what drove the B- grade
The composite is a weighted blend of 9 inputs, each scored 0–100. Each bar is that input's sub-score; the figure is the points it added to the 100-point composite (weight × sub-score).
- Cash flow +29.7/30.0
- DSCR +10.0/10.0
- 1% rule +9.3/10.0
- ARV discount +7.5/15.0
- Livability +4.0/5.0
- Rent growth +3.0/5.0
- Condition / age +2.5/5.0
- Schools +1.2/10.0
- Appreciation +0.0/10.0
$175,000
🖨 Deal sheet 📄 Offer letter ✓ Due diligence
Listing remarks
Don't miss this exceptional opportunity to own this Colonial-style home brimming with potential. Built in 1910, this residence offers over 1,400 square feet of living space, featuring three bedrooms and one full bathroom. Ideal layout for comfortable everyday living. The property boasts the convenience of off-street parking and is complemented by a fenced back yard, providing both privacy and versatility. Enjoy outdoor living in the spacious backyard with a deck perfect for entertaining, relaxing, or hosting gatherings. Conveniently located in a prime, commuter-friendly area, you'll appreciate easy access to major highways, public transportation, shopping centers, dining, and entertainment
Key facts
- Fenced back yard
- Spacious backyard
- Off-street parking
Tags
Neighborhood map
What this means for you Summary
Snapshot
- This is a 3-bed/1.0-bath single-family listed at $175k.
Deal economics
- At list price, monthly cash flow is $638 ($8k/yr) — positive.
- The deal already cash-flows at list — no discount required.
- Meets the 1% rule at list price ($3k rent vs $175k).
- Recommended offer: $172k (1.5% below list) — sets the bar for market timing.
- Cap rate 10.7% vs local median 5.0% in Bridgeport — top-decile yield for the area; either an underpriced asset or a hidden risk that comps aren't pricing in. Stress-test before assuming the spread holds.
Location & tenants
- Location reads 81/100 on livability (#15 in CT, #1,374 nationally) — a professional / high-income tenant draw. Strengths: amenities A+, commute A+, health & safety A+; Watch: crime C-, employment D+, schools D-.
- Bridgeport School District (urban): math 9% / reading 19% proficiency, ranked #151 of 153 in CT (top 99%) — low school quality limits family demand, transient renter base, plan for 1-2y turnover; 97% free/reduced lunch — lower-income household profile, screen leases tightly.
- Market conditions: Rents rising (+1.8%/yr); 47 active listings in the ZIP; 40 comparable units currently listed for rent nearby; rentals at typical pace (median 24d on market — plan ~3-4 weeks tenant-placement turnaround); 40% of comp listings sitting > 30 days — soft ceiling on asking rent; 852 units permitted in Greater Bridgeport Planning Region in 2024 (698 in 5+ unit buildings).
- At $2,508/mo this rent would consume 54% of the median local household income ($56k/yr) (locally 2367% of renters already pay >50% of income on rent) — very limited rent-growth headroom before tenants either downsize or default.
Forward outlook
- Local home prices are declining (-3.0%/yr); year-one equity from $1k of loan paydown is wiped out by about $5k of value loss. Plan a longer hold.
- At projected returns (-3.0% appreciation + 1.8% rent growth), your $49k cash investment doubles in ~9 years — after that, you're playing with house money.
Negotiation context
- It's been on market 20 days — a 2% lower offer ($172k) is reasonable based on typical stale-listing flexibility.
- 6 sale attempts since 25y ago with the ask held roughly flat each time — persistent listings suggest the price (not the market) is what's stuck; bring a comps-based counter.
- Current owner paid $99k; list at $175k implies a 77% gain — meaningful room to come down on a strong offer.
Risks & watch-outs
- Watch-outs: built in 1910 — expect roof / HVAC / electrical / plumbing capex.
- Climate carrying-cost: major wind risk, 66% chance of damaging wind over 30y; extreme-heat days projected 7→15/yr by 2055 (HVAC capex compounding) — expect insurance premiums to compound above CPI over the hold.
Questions for the listing agent
- Built in 1910 — when were the roof, HVAC, electrical panel, plumbing, and water heater last replaced?
- Is there a deadline driving the sale (1031 exchange, divorce, estate, relocation)? That informs how much negotiation room exists.
- Schools are D-rated, which usually means shorter tenancies and higher turnover. Who's the typical renter profile here, and what's been the actual vacancy rate?
- What's the average days-on-market for RENTAL listings here right now (not sales)? A rising rental-DOM trend means longer vacancies and softer asking-rent achievability than the comps imply.
- What's the recent tenant-quality profile in this submarket — average credit score on applications, eviction rate, late-payment / NSF rate, and stable-employment percentage? A property-management company in the area should have these aggregated.
- How much new for-sale + rental construction is in the pipeline within 1–3 miles? Heavy new supply typically softens prices + rents 12–24 months out; constrained supply supports both.
Investment metrics
- 1% rule
- 1.43% ✓
- Cap rate
- 10.67%
- Cash-on-cash
- 15.62%
- DSCR
- 1.70
- GRM
- 5.8
CMA / ARV
- ARV (on-the-fly)
- $467,200
- Comps found
- 12
Show comp detail 12 sales within ~0.75 mi
| Address | Dist | Beds/Ba | Sqft | Sold | Price | $/sf | Match |
|---|---|---|---|---|---|---|---|
| 500 Dewey St | 0.00mi | 3/1.0 | 1,460 (0%) | 0mo | $229,000 | $157 | 100 |
| 155 Moody Ave | 0.32mi | 3/1.5 | 1,510 (+3%) | 1mo | $462,500 | $306 | 77 |
| 25 Essex St | 0.42mi | 3/1.0 | 1,402 (-4%) | 0mo | $430,000 | $307 | 74 |
| 64 Moody Ave | 0.35mi | 3/1.5 | 1,301 (-11%) | 1mo | $505,000 | $388 | 62 |
| 7 Melville Ave | 0.47mi | 3/2.0 | 1,529 (+5%) | 10mo | $590,000 | $386 | 58 |
| 322 Greenfield St | 0.71mi | 3/1.5 | 1,500 (+3%) | 10mo | $575,000 | $383 | 52 |
| 54 2nd St | 0.58mi | 3/2.0 | 1,407 (-4%) | 17mo | $465,000 | $330 | 49 |
| 135 Laurel Pl | 0.70mi | 3/1.5 | 1,612 (+10%) | 0mo | $490,000 | $304 | 47 |
| 24 Carthage St | 0.61mi | 3/1.0 | 1,370 (-6%) | 18mo | $400,000 | $292 | 46 |
| 16 Exchange Pl | 0.61mi | 2/2.0 (-1) | 1,331 (-9%) | 8mo | $460,000 | $346 | 41 |
| 75 Berkeley Rd | 0.74mi | 4/1.0 (+1) | 1,500 (+3%) | 18mo | $480,000 | $320 | 40 |
| 91 Laurel Pl | 0.73mi | 3/2.5 | 1,604 (+10%) | 19mo | $400,000 | $249 | 28 |
Match score weights: distance 35% · size 25% · config 20% · recency 20%. Top-matched comps best support the ARV.
Projected returns pro-forma
-3.0% appreciation · 1.81% rent growth · sell at horizon
- IRR
- 5.0%
- Equity multiple
- 1.19×
- Total profit
- $9,428
- Equity at exit
- $26,093
- IRR
- 13.3%
- Equity multiple
- 2.00×
- Total profit
- $49,129
- Equity at exit
- $15,131
Cash invested: $49,000 (down + closing). Projections, not guarantees.
Landlord ↔ Tenant lean methodology
- Overall (STATE)
- 27 Tenant-Leaning
- State Connecticut
- 27 Tenant-Leaning · D+7
- County
- — inherits STATE
- City
- — inherits STATE
ZIP-level market 06605
- Home prices YoY
- -14.5%
- Rents YoY
- 1.8%
- Active inventory
- 47
- Price-to-rent
- 5.8×
Monthly cashflow live
- Estimated rent
- $2,508 high interval (Pro) →
- Mortgage (P&I)
- −$918
- Tax from tax record
- −$353 /mo · $4,233/yr
- Insurance
- −$73
- HOA
- −$0
- Vacancy / Maint / Mgmt
- −$527
- Net cashflow
- $638
Break-even live
UW: 25.0% down · 7.5% · 30yr · 1.5% tax · 5.0% vac · 8.0% maint · 8.0% mgmt
Financing live
Cash to close
- Down payment
- $43,750
- Closing costs
- $5,250
- Reserves months
- —
- Total cash needed
- —
Loan-product check · same deal, 3 products live
Conventional
25% down · 7.5% · 30yr
- Down + closing
- —
- Monthly P&I
- —
- Monthly cashflow
- —
- DSCR
- —
- Eligible?
- —
Personal DTI + credit; lowest rate.
DSCR
20% down · 8.5% · 30yr
- Down + closing
- —
- Monthly P&I
- —
- Monthly cashflow
- —
- DSCR
- —
- Eligible?
- —
No personal income docs; deal must DSCR.
Hard money
10% down · 12.0% · 12mo
- Down + closing
- —
- Monthly P&I
- —
- Monthly cashflow
- —
- DSCR
- —
- Eligible?
- —
Short-term bridge; refi at stabilization.
Rent comps 40 comps
| Address | Beds | Baths | Sqft | Rent | $/sqft | DOM | Units | Dist |
|---|---|---|---|---|---|---|---|---|
| 1257 Howard Ave Bridgeport, CT | 3.0 | 1.0 | 1000 | $2,004 | $2.00 | 2d | 1 | 0.17mi |
| 1158 Howard Ave Unit 1 Bridgeport, CT | 2.0 | 1.0 | 1000 | $2,100 | $2.10 | 23d | 1 | 0.18mi |
| 928 Hancock Ave Unit 3L Bridgeport, CT | 3.0 | 1.0 | 1200 | $2,000 | $1.67 | 23d | 1 | 0.24mi |
| 898 Hancock Ave Unit 3 Bridgeport, CT | 3.0 | 1.0 | 1068 | $2,500 | $2.34 | 43d | 1 | 0.26mi |
| 166 Dewey St Unit 1 Bridgeport, CT | 3.0 | 1.0 | 1100 | $2,100 | $1.91 | 3d | 1 | 0.30mi |
| 557 Colorado Ave Unit Second Floor Bridgeport, CT | 3.0 | 1.0 | 1309 | $2,800 | $2.14 | 43d | 1 | 0.30mi |
| 689 Maplewood Ave Bridgeport, CT | 3.0 | 1.0 | 1050 | $2,150 | $2.05 | 43d | 1 | 0.31mi |
| 1662 Fairfield Ave Unit 2nd fl Bridgeport, CT | 2.0 | 1.0 | 1200 | $2,200 | $1.83 | 14d | 1 | 0.34mi |
| 784 Howard Ave Unit 2 Bridgeport, CT | 3.0 | 1.0 | 1765 | $1,900 | $1.08 | 23d | 1 | 0.42mi |
| 784 Howard Ave Unit 2nd Floor Bridgeport, CT | 3.0 | 1.0 | 1765 | $1,950 | $1.10 | 43d | 1 | 0.42mi |
| 125 Tunxis Hill Rd Fairfield, CT | 2.0 | 2.0 | 1014 | $2,650 | $2.61 | 2d | 1 | 0.44mi |
| 540 Villa Ave Unit 542 Fairfield, CT | 2.0 | 1.0 | 1175 | $2,750 | $2.34 | 43d | 1 | 0.49mi |
| 32 Hazelwood Ave Unit 1st floor Bridgeport, CT | 2.0 | 1.5 | 900 | $2,000 | $2.22 | 44d | 1 | 0.58mi |
| 184 Pacific St Bridgeport, CT | 4.0 | 1.0 | 1200 | $2,500 | $2.08 | 21d | 1 | 0.59mi |
| 23 Elmwood Ave Unit 3 Bridgeport, CT | 3.0 | 1.0 | 1025 | $1,750 | $1.71 | 14d | 1 | 0.60mi |
| 414 Wood Ave Bridgeport, CT | 2.0 | 1.0 | 1000 | $2,200 | $2.20 | 43d | 1 | 0.62mi |
| 137 Sherwood Ave Bridgeport, CT | 4.0 | 1.0 | 1200 | $2,500 | $2.08 | 3d | 1 | 0.65mi |
| 165 Lee Ave Unit 2R Bridgeport, CT | 2.0 | 1.0 | 1000 | $1,850 | $1.85 | 23d | 1 | 0.67mi |
| 471 Marlborough Ter Unit 2 Fairfield, CT | 4.0 | 1.0 | 1150 | $3,100 | $2.70 | 43d | 1 | 0.71mi |
| 764 Ellsworth St Unit 3 Bridgeport, CT | 2.0 | 1.0 | 1060 | $1,700 | $1.60 | 43d | 1 | 0.73mi |
| 259 Laurel Ave Unit 2 Bridgeport, CT | 4.0 | 1.0 | 1432 | $3,200 | $2.23 | 2d | 1 | 0.74mi |
| 114 Waldorf Ave Unit 2 Bridgeport, CT | 3.0 | 1.0 | 1200 | $2,400 | $2.00 | 3d | 1 | 0.79mi |
| 1496 Iranistan Ave Bridgeport, CT | 3.0 | 1.0 | 1200 | $2,300 | $1.92 | 14d | 1 | 0.81mi |
| 1494 Iranistan Ave Unit 1 Bridgeport, CT | 3.0 | 1.0 | 1200 | $2,300 | $1.92 | 3d | 1 | 0.81mi |
| 228 Jennings Rd Fairfield, CT | 3.0 | 2.0 | 1412 | $3,650 | $2.58 | 14d | 1 | 0.81mi |
| 228 Jennings Rd Fairfield, CT | 3.0 | 2.0 | 1412 | $3,750 | $2.66 | 43d | 1 | 0.81mi |
| 348 Halley Ave Fairfield, CT | 3.0 | 2.5 | 1530 | $4,200 | $2.75 | 2d | 1 | 0.83mi |
| 1577 Park Ave Bridgeport, CT | 3.0 | 1.0 | 1409 | $2,400 | $1.70 | 23d | 1 | 0.83mi |
| 446 Old Stratfield Rd Fairfield, CT | 2.0 | 1.0 | 1065 | $2,750 | $2.58 | 43d | 1 | 0.84mi |
| 285 Hanover St Unit 1 Bridgeport, CT | 3.0 | 2.0 | 1338 | $2,200 | $1.64 | 14d | 1 | 0.84mi |
| 44 Lorraine Ter Unit 2 Bridgeport, CT | 2.0 | 1.0 | 1100 | $2,100 | $1.91 | 11d | 1 | 0.85mi |
| 63 Eaton St Unit 3 Bridgeport, CT | 2.0 | 1.0 | 1000 | $2,200 | $2.20 | 43d | 1 | 0.86mi |
| 42 Poe Ct Fairfield, CT | 3.0 | 2.5 | 1600 | $4,100 | $2.56 | 2d | 1 | 0.86mi |
| 206 Scofield Ave Bridgeport, CT | 2.0 | 1.0 | 1100 | $2,200 | $2.00 | 43d | 1 | 0.88mi |
| 709 Tunxis Hill Rd Fairfield, CT | 3.0 | 1.5 | 1109 | $3,900 | $3.52 | 2d | 1 | 0.92mi |
| 300 Soundview Ave Fairfield, CT | 2.0 | 1.0 | 1050 | $3,000 | $2.86 | 43d | 1 | 0.92mi |
| 125 Tunxis Hill Cut Unit 2 Fairfield, CT | 2.0 | 2.0 | 1014 | $2,650 | $2.61 | 43d | 1 | 0.94mi |
| 732 Tunxis Hill Rd Fairfield, CT | 4.0 | 2.0 | 1380 | $3,000 | $2.17 | 2d | 1 | 0.94mi |
| 95 Shell St Bridgeport, CT | 3.0 | 1.5 | 1220 | $2,800 | $2.30 | 23d | 1 | 0.96mi |
| 720 Knapps Hwy Fairfield, CT | 2.0 | 1.0 | 1176 | $2,300 | $1.96 | 43d | 1 | 0.97mi |
Listing history 13 events
-
2026-04-09status Under Contract
-
2026-03-18$175,000 Active
-
2026-01-15historical
-
2026-01-05status Active
-
2026-01-03historical
-
2025-10-04$250,000 Active
-
2025-10-01historical
-
2025-03-26$250,000 Active
-
2024-09-25historical
-
2024-09-11$250,000 Active
-
2001-04-05soldstatus $99,000
-
2001-04-04soldstatus $99,000
-
2001-01-20$99,000
ⓘ Source: listings_history table (triggers on properties + properties_extension) + one-shot
backfill from property_details.listing_events for pre-trigger history.
Tax reassessment forecast CT · Partial reset (capped growth)
- Current annual tax
- $4,233 · $353/mo
- Projected year-2 tax
- $4,233 · $353/mo
- Expected delta
- $0/yr ($0/mo · 0.0%)
ⓘ Screening estimate from a state-policy table — verify with the county assessor before closing.
Climate risk First Street
- Flood 1/10 Low FEMA zone X (unshaded) · 0% chance over 30 yrs
- Wildfire 1/10 Low
- Heat 6/10 Major 7 d/yr ≥97°F today · 15 d/yr by 30 yrs out
- Wind 6/10 Major 66% chance of damaging wind over 30 yrs
- Air quality 4/10 Moderate 5 unhealthy d/yr today · 7 by 30 yrs out
Nearby sold comps map
Loading sold comps map…
Walkable amenities ~0.75 mi
Loading nearby amenities…
Taxation est. · year 1
- Rental income
- $30,097
- − Mortgage interest
- −$9,803
- − Property taxes
- −$4,233
- − Insurance
- −$875
- − Repairs & maintenance
- −$2,408
- − Management
- −$2,408
- − Depreciation
- −$5,091
- Taxable income
- $5,280
- Est. tax owed @ 24.0%
- −$1,267
- After-tax cash flow
- $6,389/yr
For passive investors: Depreciation is non-cash, so a rental often shows a tax loss while cash-flowing — sheltering income. Rental losses are passive: they offset passive income freely, and up to $25,000/yr can offset ordinary (W-2) income if you actively participate and your MAGI is under $100k (phasing out to $0 by $150k); unused losses carry forward. On sale, claimed depreciation is recaptured at up to 25%, and gains may owe capital-gains tax (a 1031 exchange can defer both). Figures are a year-1 estimate at your 24.0% rate — not tax advice; consult a CPA.
Schools (NCES district)
- District
- Bridgeport School District
- NCES district ID
- 0900450
- Math proficiency
- 9% ▼ -7.00%
- Reading proficiency
- 19% ▼ -10.00%
- Median HH income
- $41,507
- Composite
- 12.09/100
- National rank
- #9656
- State rank
- #151 of 153 in CT
Livability — Bridgeport
- Score
- 81/100
- State rank
- #15
- US rank
- #1374
Category grades
Schools grade is shown separately in the Schools card above.
Census & demographics
- Census place
- Bridgeport, CT
- County
- Fairfield County · 765,532 people
- City population
- 149,153
- Metro
- Bridgeport-Stamford-Norwalk, CT
- Population (ZIP)
- 25,929
- Household income
- $56,179
- Rent vs Own
- Severe rent burden
- 2367.0
Population outlook (Greater Bridgeport County) Hauer SSP2
- By 2040
- 365,581
Race, ethnicity, and origin ACS 2023
- Neighborhood character
- Diverse neighborhood (Simpson 0.70)
- Race & ethnicity
- Hispanic / Latino 39% White 33% Black 19% Two or more races 12% Asian 5% Native American 1%
- Hispanic origin (detail)
- Mexican 6% Puerto Rican 17% Cuban 3% Dominican 3%
- Common ancestry
- Romanian 4% Hispanic 3% Scotch-Irish 2%
- Foreign-born
- 25% · Canada, Guatemala, China
- Languages at home
- 54% English-only · Spanish 32% Other Indo-European 4% French/Haitian/Cajun 3%
Political lean MEDSL · Greater Bridgeport
- 2024 margin
- Strong D (+23.3) · D 60.9% · R 37.6% · Other 1.5%
- All cycles
- 2024: D+23.3
Not yet ingested
- Civics
- —
Market trends
- HPI YoY
- ▼ -40.42%
- Current HPI
- 238.1786
- Rent YoY
- ▲ 1.81%
- Metro
- Bridgeport-Stamford-Norwalk, CT
- State GDP YoY
- ▲ 1.06%
- F500 in state
- 38
Industry mix (Fortune 500 HQ in CT)
| Industry | F500 HQs | Revenue |
|---|---|---|
| Industrial Machinery | 4 | $38B |
|
||
| Insurance | 3 | $71B |
|
||
| Financial Services | 2 | $25B |
|
||
| Transportation / Logistics | 2 | $18B |
|
||
| Healthcare | 1 | $247B |
|
||
| Telecommunications | 1 | $55B |
|
||
Price history
+76.8% since first listed13 events — show timeline
- 2026-04-09 Pending — Smart MLS
- 2026-03-18 Listed $175,000 Smart MLS
- 2026-01-15 Listing Removed — Smart MLS
- 2026-01-05 Relisted — Smart MLS
- 2026-01-03 Listing Removed — Smart MLS
- 2025-10-04 Listed $250,000 Smart MLS
- 2025-10-01 Listing Removed — Smart MLS
- 2025-03-26 Listed $250,000 Smart MLS
- 2024-09-25 Listing Removed — Smart MLS
- 2024-09-11 Listed $250,000 Smart MLS
- 2001-04-05 Sold (Public Records) $99,000 Public Records
- 2001-04-04 Sold (MLS) $99,000 Smart MLS
- 2001-01-20 Listed $99,000 Smart MLS
Property tax history
-0.6%/yrLatest (2023): $4,233 · +0.0% YoY. Source: county tax records.
Cash-flow waterfall
monthlySold comps — $/sqft
last 12 mo · ≤1 miLoading sold comps…