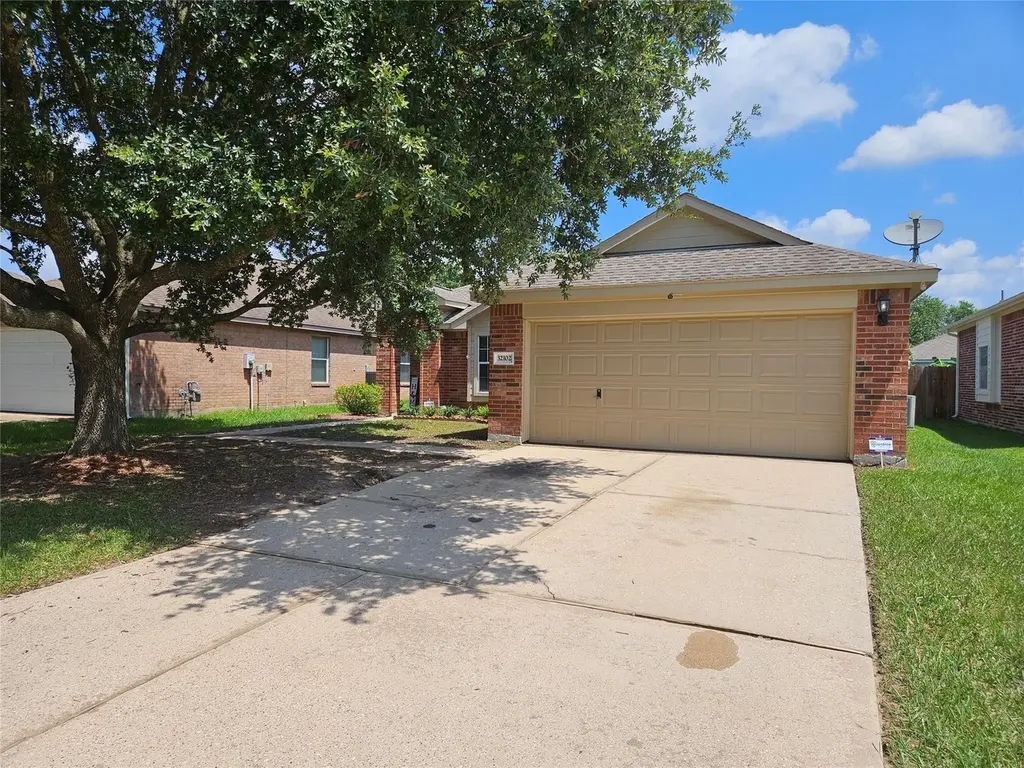
32102 Annice Ln · Tomball, TX
Flood risk 1/10 · Minimal
- FEMA flood zone
- X (unshaded)
- Chance of flooding over 30 yrs
- 0.0%
- Est. flood insurance / yr
- $507 – $1,088
Fire risk 4/10 · Minor
- Est. fire insurance / yr
- $1,222 – $2,270
Heat risk 9/10 · Severe
- Hot days now (above 110°F)
- 7 days/yr
- Hot days in 30 yrs
- 24 days/yr
Wind risk 8/10 · Major
- Chance of severe wind over 30 yrs
- 99.0%
Air-quality risk 2/10 · Minimal
- Unhealthy air days now
- 2 days/yr
- Unhealthy air days in 30 yrs
- 2 days/yr
Risk factors via First Street. Map © Google.
Why this score? — see what drove the D- grade
The composite is a weighted blend of 9 inputs, each scored 0–100. Each bar is that input's sub-score; the figure is the points it added to the 100-point composite (weight × sub-score).
- Cash flow +12.5/30.0
- Schools +5.8/10.0
- ARV discount +4.8/15.0
- 1% rule +3.9/10.0
- Livability +3.8/5.0
- DSCR +3.7/10.0
- Rent growth +2.5/5.0
- Condition / age +2.5/5.0
- Appreciation +0.0/10.0
$264,900
🖨 Deal sheet (PDF) 📄 Offer letter ✓ Due diligence
Listing remarks
Move-in ready and thoughtfully updated, this charming single-story, 4-bedroom, 2-bath home is situated in the peaceful VODO community. With 1,756 square feet of well-designed living space, this home offers comfort, style, and everyday practicality. New Roof Replaced in 2026. Step inside to an open and welcoming floor plan filled with natural light and finished in neutral tones that suit any décor. The spacious living area features a cozy fireplace, making it a perfect spot for relaxing evenings or entertaining guests. The updated kitchen is a highlight, showcasing quartz countertops, a farmhouse sink, ample cabinetry, and generous counter space—ideal for daily meals and host
Key facts
- Open floor plan
- Quartz countertops
- Farmhouse sink
Tags
Property features AI
Finance
- HOA & community: Association: CMI; Annual association fee of $504 covering common areas
Exterior
- Parking: Attached garage; 2 garage spaces
- Utilities: Public water; Public sewer
- Home design: Residential property; Faces south; Built in 2003; Entry on slab foundation
- Construction: Wood siding construction; Composition roof; Slab foundation
- Exterior features: Subdivision lot setting
Interior
- Kitchen: Dishwasher; Gas cooktop; Gas oven; Microwave; Disposal
- Bedrooms: 6 total rooms (includes bedrooms and living spaces)
- Bathrooms: 2 full bathrooms
- Heating & cooling: Central heating (gas); Central electric air conditioning
- Interior features: Gas fireplace (1); Seller provided disclosure available
- Laundry & utility: Washer hookup; Electric dryer hookup; Gas dryer hookup
Neighborhood map
What this means for you Summary
Snapshot
- This is a 4-bed/2.0-bath single-family listed at $265k.
Deal economics
- At list price, monthly cash flow is $-38 ($-460/yr) — negative.
- To cash-flow at today's rent, offer at most $258k (2.6% below list).
- To meet the 1% rule (rent ≥ 1% of price), the offer needs to be $237k (10.7% below list).
- Recommended offer: $237k (10.7% below list) — sets the bar for 1% rule.
- Cap rate 6.1% vs local median 2.7% in Tomball — top-decile yield for the area; either an underpriced asset or a hidden risk that comps aren't pricing in. Stress-test before assuming the spread holds.
Location & tenants
- Location reads 75/100 on livability (#155 in TX, #4,239 nationally) — a middle-class / working-renter tenant base. Strengths: cost of living A+, housing A+, health & safety B+; Watch: amenities F, commute F.
- Tomball ISD (suburban): math 66% / reading 63% proficiency, ranked #25 of 826 in TX (top 3%) — acceptable for families but not a draw, mixed tenant base, ~2y average lease.
- Zoned schools: Decker Prairie El (math 29% / reading 34%, grade F, #2,396 of 4,322 statewide, top 56%, 755 students, 40% FRL); Tomball H S (math 74% / reading 69%, grade B+, #111 of 1,632 statewide, top 7%, 2,801 students, 34% FRL).
- Zoned-school proficiency averages 52% at this address vs 64% district-wide (-13 pts) — the specific schools serving this property underperform the Tomball ISD average; the district grade overstates school quality for this exact location.
- Market conditions: 170 active listings in the ZIP; 13,259 units permitted in Montgomery County in 2024 (1,402 in 5+ unit buildings).
Forward outlook
- Local home prices are declining (-3.0%/yr); year-one equity from $2k of loan paydown is wiped out by about $8k of value loss. Plan a longer hold.
- Montgomery County population projected at +65% by 2050 — long-run rental-demand tailwind backs the buy-and-hold thesis.
Negotiation context
- It's been on market 35 days — a 3% lower offer ($257k) is reasonable based on typical stale-listing flexibility.
- 8 sale attempts since 6y ago with the ask held roughly flat each time — persistent listings suggest the price (not the market) is what's stuck; bring a comps-based counter.
Risks & watch-outs
- Climate carrying-cost: severe wind risk, 99% chance of damaging wind over 30y; extreme-heat days projected 7→24/yr by 2055 (HVAC capex compounding) — expect insurance premiums to compound above CPI over the hold.
Questions for the listing agent
- What do current leases actually rent for vs. the listed asking? Can we see a recent rent roll and the last 12 months of T-12 income?
- It's been on market 35 days. Have you received any prior offers? Is the seller open to a 11% concession, seller financing, or rate buy-down credit?
- What does the HOA fee cover, when was the last increase, and are there any pending special assessments or reserve-fund shortfalls?
- Is there a deadline driving the sale (1031 exchange, divorce, estate, relocation)? That informs how much negotiation room exists.
- Schools are B-rated — typically a magnet for longer-tenancy family renters. What's the average tenant stay here, and is there a school-zone premium baked into asking?
- The area grade is low — what's the realistic commute time and amenity access for the typical tenant pool here? Any planned neighborhood developments (good or bad) we should know about?
- What's the average days-on-market for RENTAL listings here right now (not sales)? A rising rental-DOM trend means longer vacancies and softer asking-rent achievability than the comps imply.
- What's the recent tenant-quality profile in this submarket — average credit score on applications, eviction rate, late-payment / NSF rate, and stable-employment percentage? A property-management company in the area should have these aggregated.
- How much new for-sale + rental construction is in the pipeline within 1–3 miles? Heavy new supply typically softens prices + rents 12–24 months out; constrained supply supports both.
Investment metrics
- 1% rule
- 0.89% ✗
- Cap rate
- 6.12%
- Cash-on-cash
- -0.62%
- DSCR
- 0.97
- GRM
- 9.3
CMA / ARV
- ARV (median comp)
- $250,068
- List price
- $264,900
- Delta
- 5.93%
- Verdict
- FAIR
- Comps
- 20 within 1.0 mi
Show comp detail 12 sales within ~0.75 mi
| Address | Dist | Beds/Ba | Sqft | Sold | Price | $/sf | Match |
|---|---|---|---|---|---|---|---|
| 32102 Decker Oaks Dr | 0.05mi | 4/2.0 | 1,626 (-5%) | 9mo | $249,900 | $154 | 81 |
| 32126 Annice Ln | 0.05mi | 3/2.0 (-1) | 1,817 (+6%) | 4mo | $263,000 | $145 | 80 |
| 32211 Decker Oaks Dr | 0.08mi | 3/2.0 (-1) | 1,556 (-9%) | 2mo | $249,300 | $160 | 74 |
| 32214 Annice Ln | 0.11mi | 3/2.0 (-1) | 1,530 (-11%) | 6mo | $240,000 | $157 | 67 |
| 11843 Belle Ct | 0.20mi | 3/2.0 (-1) | 1,534 (-11%) | 2mo | $249,900 | $163 | 66 |
| 12203 Hickory Hollow Ln | 0.64mi | 3/2.0 (-1) | 1,716 (+0%) | 1mo | $269,900 | $157 | 64 |
| 32002 Sue Ln | 0.17mi | 3/2.0 (-1) | 1,464 (-15%) | 6mo | $260,000 | $178 | 58 |
| 12038 Powderhorn Ln | 0.41mi | 3/2.0 (-1) | 1,556 (-9%) | 5mo | $265,000 | $170 | 56 |
| 12050 Quartersawn Ln | 0.51mi | 3/2.0 (-1) | 1,556 (-9%) | 0mo | $269,000 | $173 | 55 |
| 12035 Powderhorn Ln | 0.38mi | 3/2.0 (-1) | 1,556 (-9%) | 9mo | $260,000 | $167 | 55 |
| 32016 S Wiggins St | 0.68mi | 4/2.0 | 1,485 (-13%) | 3mo | $275,000 | $185 | 43 |
| 32051 S Wiggins St | 0.58mi | 3/2.0 (-1) | 1,946 (+14%) | 9mo | $315,000 | $162 | 38 |
Match score weights: distance 35% · size 25% · config 20% · recency 20%. Top-matched comps best support the ARV.
Projected returns pro-forma
-3.0% appreciation · 3.0% rent growth · sell at horizon
- IRR
- -17.3%
- Equity multiple
- 0.39×
- Total profit
- $-45,284
- Equity at exit
- $39,497
- IRR
- -9.2%
- Equity multiple
- 0.43×
- Total profit
- $-42,241
- Equity at exit
- $22,904
Cash invested: $74,172 (down + closing). Projections, not guarantees.
Landlord ↔ Tenant lean methodology
- Overall (STATE)
- 87 Strongly Landlord-Friendly
- State Texas
- 87 Strongly Landlord-Friendly · R+5
- County
- — inherits STATE
- City
- — inherits STATE
ZIP-level market 77362
- Home prices YoY
- -29.1%
- Active inventory
- 170
- Price-to-rent
- 9.3×
Monthly cashflow live
- Estimated rent
- $2,366 medium interval (Pro) →
- Mortgage (P&I)
- −$1,389
- Tax from tax record
- −$366 /mo · $4,390/yr
- Insurance
- −$110
- HOA
- −$42
- Vacancy / Maint / Mgmt
- −$497
- Net cashflow
- $-38
Break-even live
Sensitivity live
| Price | -10% $112 | -5% $37 | +0% $-38 | +5% $-113 | +10% $-188 |
|---|---|---|---|---|---|
| Rent | -10% $-225 | -5% $-132 | +0% $-38 | +5% $55 | +10% $149 |
| Rate | -1.0pp $95 | -0.5pp $29 | base $-38 | +0.5pp $-107 | +1.0pp $-177 |
UW: 25.0% down · 7.5% · 30yr · 1.5% tax · 5.0% vac · 8.0% maint · 8.0% mgmt
Financing live
Cash to close
- Down payment
- $66,225
- Closing costs
- $7,947
- Reserves months
- —
- Total cash needed
- —
Loan-product check · same deal, 3 products live
Conventional
25% down · 7.5% · 30yr
- Down + closing
- —
- Monthly P&I
- —
- Monthly cashflow
- —
- DSCR
- —
- Eligible?
- —
Personal DTI + credit; lowest rate.
DSCR
20% down · 8.5% · 30yr
- Down + closing
- —
- Monthly P&I
- —
- Monthly cashflow
- —
- DSCR
- —
- Eligible?
- —
No personal income docs; deal must DSCR.
Hard money
10% down · 12.0% · 12mo
- Down + closing
- —
- Monthly P&I
- —
- Monthly cashflow
- —
- DSCR
- —
- Eligible?
- —
Short-term bridge; refi at stabilization.
HOA detail
- Monthly dues
- $42 · $504/yr
Listing history 36 events
-
2026-06-18days on market $264,900 Active 35 DOM
-
2026-06-17days on market $264,900 Active 34 DOM
-
2026-06-16days on market $264,900 Active 33 DOM
-
2026-06-15days on market $264,900 Active 32 DOM
-
2026-06-13days on market $264,900 Active 30 DOM
-
2026-06-13days on market $264,900 Active 29 DOM
-
2026-06-09days on market $264,900 Active 26 DOM
-
2026-06-08days on market $264,900 Active 25 DOM
-
2026-06-07days on market $264,900 Active 24 DOM
-
2026-06-04days on market $264,900 Active 21 DOM
-
2026-06-03days on market $264,900 Active 20 DOM
-
2026-06-02days on market $264,900 Active 19 DOM
-
2026-06-01days on market $264,900 Active 18 DOM
-
2026-05-31days on market $264,900 Active 17 DOM
-
2026-05-14$269,900 Active 928-char remark
-
2026-05-11historical
-
2026-04-30status Active
-
2026-04-28historical
-
2026-03-12status Active
-
2026-03-06status Pending
-
2026-03-03status Active
-
2026-03-03price $269,900
-
2026-03-03status Pending
-
2026-02-23status Pending
-
2026-01-15$274,900 Active
-
2025-08-17historical
-
2025-08-11price $266,000
-
2025-08-10status Active
-
2025-08-01status Pending
-
2025-07-05price $269,000
-
2025-05-08$274,900 Active
-
2020-08-03soldstatus
-
2020-07-27soldstatus Sold
-
2020-07-15status Pending
-
2020-07-09status Option Pending
-
2020-07-03$205,000 Active
ⓘ Source: listings_history table (triggers on properties + properties_extension) + one-shot
backfill from property_details.listing_events for pre-trigger history.
Tax reassessment forecast TX · Resets to sale price
- Current annual tax
- $4,390 · $366/mo
- Projected year-2 tax
- $4,848 · $404/mo
- Expected delta
- +$458/yr (+$38/mo · 10.4%)
ⓘ Screening estimate from a state-policy table — verify with the county assessor before closing.
Climate risk First Street
- Flood 1/10 Low FEMA zone X (unshaded) · 0% chance over 30 yrs
- Wildfire 4/10 Moderate
- Heat 9/10 Extreme 7 d/yr ≥110°F today · 24 d/yr by 30 yrs out
- Wind 8/10 Severe 99% chance of damaging wind over 30 yrs
- Air quality 2/10 Low 2 unhealthy d/yr today · 2 by 30 yrs out
Nearby sold comps map
Loading sold comps map…
Walkable amenities ~0.75 mi
Loading nearby amenities…
Taxation est. · year 1
- Rental income
- $28,390
- − Mortgage interest
- −$14,839
- − Property taxes
- −$4,390
- − Insurance
- −$1,324
- − Repairs & maintenance
- −$2,271
- − Management
- −$2,271
- − HOA
- −$504
- − Depreciation
- −$7,706
- Taxable loss
- −$4,915
- Est. tax savings @ 24.0%
- +$1,180
- After-tax cash flow
- $720/yr
For passive investors: Depreciation is non-cash, so a rental often shows a tax loss while cash-flowing — sheltering income. Rental losses are passive: they offset passive income freely, and up to $25,000/yr can offset ordinary (W-2) income if you actively participate and your MAGI is under $100k (phasing out to $0 by $150k); unused losses carry forward. On sale, claimed depreciation is recaptured at up to 25%, and gains may owe capital-gains tax (a 1031 exchange can defer both). Figures are a year-1 estimate at your 24.0% rate — not tax advice; consult a CPA.
Schools (NCES district)
- District
- Tomball ISD
- NCES district ID
- 4842960
- Math proficiency
- 66% ▼ -6.00%
- Reading proficiency
- 63% ▼ -4.00%
- Median HH income
- $86,552
- Composite
- 58.32/100
- National rank
- #1014
- State rank
- #25 of 826 in TX
Livability — Tomball
- Score
- 75/100
- State rank
- #155
- US rank
- #4239
Category grades
Schools grade is shown separately in the Schools card above.
Census & demographics
- City population
- 113,991
- Population (ZIP)
- 7,474
Population outlook (Montgomery County) Hauer SSP2
- Today (2025)
- 713,896 people
- By 2030
- 805,263 · +12.8%
- By 2040
- 992,708 · +39.1%
- By 2050
- 1,179,590 · +65.2%
- By 2075
- 1,628,084 · +128.1%
- By 2100
- 1,937,880 · +171.5%
Race, ethnicity, and origin ACS 2023
- Neighborhood character
- Predominantly White (68%)
- Race & ethnicity
- White 68% Hispanic / Latino 20% Two or more races 10% Black 7% Asian 3%
- Hispanic origin (detail)
- Mexican 15%
- Common ancestry
- Lithuanian 4% Slovak 4% Serbian 2%
- Foreign-born
- 10% · Canada, Jamaica
- Languages at home
- 78% English-only · Spanish 18% Other Indo-European 2%
Political lean MEDSL · Montgomery
- 2024 margin
- Solid R (+45.5) · D 26.8% · R 72.3%
- 2008→2024 swing
- +7.2pp toward D · 2008: -52.7pp · 2024: -45.5pp
- All cycles
- 2024: R+45.5 2020: R+43.8 2016: R+51.4 2012: R+60.7 2008: R+52.7
Not yet ingested
- Civics
- —
Market trends
- HPI YoY
- ▼ -116.65%
- Current HPI
- 284.6412
- Rent YoY
- —
- Metro
- —
- State GDP YoY
- ▲ 3.95%
- F500 in state
- 110
Industry mix (Fortune 500 HQ in TX)
| Industry | F500 HQs | Revenue |
|---|---|---|
| Energy | 16 | $1,198B |
|
||
| Technology | 5 | $198B |
|
||
| Engineering / Construction | 4 | $72B |
|
||
| Energy Services | 3 | $60B |
|
||
| Utilities | 3 | $41B |
|
||
| Healthcare | 2 | $330B |
|
||
Price history
+29.2% since first listed23 events — show timeline
- 2026-05-28 Price Changed $264,900 HARMLS
- 2026-05-14 Listed $269,900 HARMLS
- 2026-05-11 Listing Removed — HARMLS
- 2026-04-30 Relisted — HARMLS
- 2026-04-28 Listing Removed — HARMLS
- 2026-03-12 Relisted — HARMLS
- 2026-03-06 Pending — HARMLS
- 2026-03-03 Relisted — HARMLS
- 2026-03-03 Price Changed $269,900 HARMLS
- 2026-03-03 Pending — HARMLS
- 2026-02-23 Pending — HARMLS
- 2026-01-15 Listed $274,900 HARMLS
- 2025-08-17 Listing Removed — HARMLS
- 2025-08-11 Price Changed $266,000 HARMLS
- 2025-08-10 Relisted — HARMLS
- 2025-08-01 Pending — HARMLS
- 2025-07-05 Price Changed $269,000 HARMLS
- 2025-05-08 Listed $274,900 HARMLS
- 2020-08-03 Sold (Public Records) — Public Records
- 2020-07-27 Sold (MLS) — HARMLS
- 2020-07-15 Pending — HARMLS
- 2020-07-09 Pending — HARMLS
- 2020-07-03 Listed $205,000 HARMLS
Property tax history
+11.9%/yrLatest (2025): $4,390 · +4.2% YoY. Source: county tax records.
Cash-flow waterfall
monthlySold comps — $/sqft
last 12 mo · ≤1 miLoading sold comps…