 Triplex
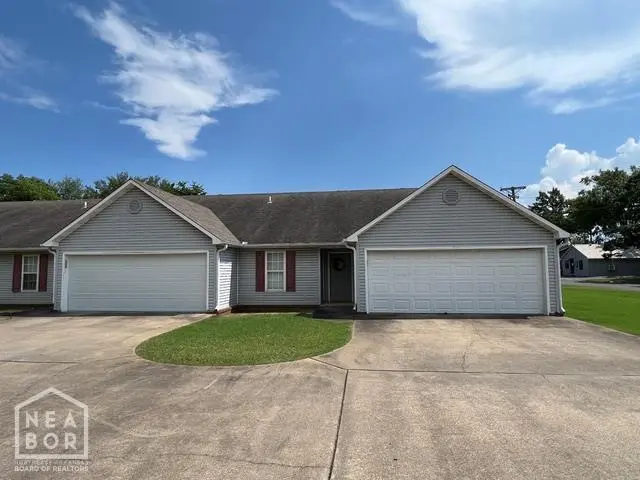
106 Leggett St · Jonesboro, AR
Flood risk 1/10 · Minimal
- FEMA flood zone
- X
- Chance of flooding over 30 yrs
- 0.0%
- Est. flood insurance / yr
- $507 – $1,088
Fire risk 3/10 · Minor
- Est. fire insurance / yr
- $1,499 – $2,785
Heat risk 6/10 · Moderate
- Hot days now (above 109°F)
- 7 days/yr
- Hot days in 30 yrs
- 21 days/yr
Wind risk 3/10 · Minor
- Chance of severe wind over 30 yrs
- 6.0%
Air-quality risk 1/10 · Minimal
- Unhealthy air days now
- 0 days/yr
- Unhealthy air days in 30 yrs
- 0 days/yr
Risk factors via First Street. Map © Google.
Why this score? — see what drove the D- grade
The composite is a weighted blend of 9 inputs, each scored 0–100. Each bar is that input's sub-score; the figure is the points it added to the 100-point composite (weight × sub-score).
- Cash flow +13.4/30.0
- DSCR +4.0/10.0
- 1% rule +3.8/10.0
- Condition / age +3.8/5.0
- Rent growth +3.4/5.0
- ARV discount +3.3/15.0
- Livability +3.2/5.0
- Schools +2.3/10.0
- Appreciation +0.0/10.0
$399,900
🖨 Deal sheet 📄 Offer letter ✓ Due diligence
Multi-family units
County records classify this as Multi-Family (2-4 Unit). Listing-text estimate: 3 units. confirmed
Listing remarks
Investor Alert! This fully occupied triplex in Jonesboro, Arkansas, offers immediate rental income and long-term potential in one of the region's fastest-growing markets. Each of the three units features approx. 1,200 sq ft with 2 bedrooms, 2 full bathrooms, open layouts, and a private 2-car garage, providing modern comfort and functionality that keeps tenants long-term. The property is in a prime location within walking distance to Arkansas State University, making it a consistent favorite for students, faculty, and staff. With shopping, dining, and local hotspots just minutes away and downtown only a quick drive. This location guarantees steady demand and high occupancy rates. Jonesboro i
Key facts
- Triplex
- Prime location
- 3773 acre lot
Tags
Property features AI
Finance
- Other: Taxes and maintenance/lawn care, management, and water/sewer are included in expenses; Tenants are responsible for cable, electric, and gas
- Financial info: Potential financing: FHA, Conventional, or Cash; Property set up as three units (each ~1,200 sq ft); Typical 2-bedroom rent listed at $1,000 per month
- HOA & community: HOA frequency: Monthly
Exterior
- Parking: 2-car garage
- Utilities: Public sewer; Public water; Municipal electric; Natural gas; Cable TV available; Private telephone service
- Home design: Metal/vinyl siding exterior; Zoned R-3
- Construction: Architectural shingle roof; Slab foundation
- Exterior features: Guttering; Patio; Paved road access; Level lot; Not in a subdivision; Located inside city limits
Interior
- Kitchen: Free-standing stove; Dishwasher; Refrigerator stays
- Bedrooms: Three 2-bedroom units (each unit has 2 bedrooms)
- Flooring: Tile; Wall-to-wall carpet
- Bathrooms: Three 2-bath units (each unit has 2 bathrooms)
- Heating & cooling: Central heat (gas); Central cooling (electric)
- Interior features: Washer and dryer stay; Smoke detector; Ceiling fans; Window treatments; Sheetrock ceilings
- Laundry & utility: Washer stays; Dryer stays
Neighborhood map
What this means for you Summary
Snapshot
- This is a 3 × 2-bed/2.0-bath units multifamily listed at $400k. Condition is rated good.
Deal economics
- At list price, monthly cash flow is $9 ($111/yr) — positive. Per door: $3/mo.
- The deal already cash-flows at list — no discount required.
- To meet the 1% rule (rent ≥ 1% of price), the offer needs to be $351k (12.2% below list).
- Recommended offer: $351k (12.2% below list) — sets the bar for 1% rule.
- Cap rate 6.3% vs local median 4.4% in Jonesboro — top-decile yield for the area; either an underpriced asset or a hidden risk that comps aren't pricing in. Stress-test before assuming the spread holds.
Location & tenants
- Location reads 65/100 on livability (#145 in AR) — a middle-class / working-renter tenant base. Strengths: cost of living A+, housing A+, health & safety A+; Watch: crime F, amenities F, commute F.
- Jonesboro School District (urban): math 28% / reading 28% proficiency, ranked #169 of 238 in AR (top 71%) — low school quality limits family demand, transient renter base, plan for 1-2y turnover; 67% free/reduced lunch — lower-income household profile, screen leases tightly.
- Zoned schools: The Academies At Jonesboro High School (math 16% / reading 27%, grade F, #225 of 292 statewide, top 78%, 1,386 students, 100% FRL) — zoned schools average 100% FRL vs 67% district-wide (33 pts higher); higher-poverty schools than district average — tighter screening recommended.
- Market conditions: Rents rising (+3.6%/yr); 295 active listings in the ZIP; 926 units permitted in Craighead County in 2024 (69 in 5+ unit buildings).
- At $3,510/mo this rent would consume 93% of the median local household income ($45k/yr) (locally 2606% of renters already pay >50% of income on rent) — very limited rent-growth headroom before tenants either downsize or default.
Forward outlook
- Local home prices are declining (-3.0%/yr); year-one equity from $3k of loan paydown is wiped out by about $12k of value loss. Plan a longer hold.
- Craighead County population projected at +38% by 2050 — long-run rental-demand tailwind backs the buy-and-hold thesis.
Negotiation context
- It's been on market 37 days — a 3% lower offer ($388k) is reasonable based on typical stale-listing flexibility.
- 9 sale attempts with the ask held roughly flat each time — persistent listings suggest the price (not the market) is what's stuck; bring a comps-based counter.
Risks & watch-outs
- Climate carrying-cost: extreme-heat days projected 7→21/yr by 2055 (HVAC capex compounding) — expect insurance premiums to compound above CPI over the hold.
Questions for the listing agent
- It's been on market 37 days. Have you received any prior offers? Is the seller open to a 12% concession, seller financing, or rate buy-down credit?
- Can we see the unit-by-unit rent roll, current vacancy, and any below-market leases? What's the average tenancy length?
- What capital expenditures (roof, boiler, parking lot, exteriors) have been made in the last 5 years, and what's planned in the next 2?
- Is there a deadline driving the sale (1031 exchange, divorce, estate, relocation)? That informs how much negotiation room exists.
- Schools are D-rated, which usually means shorter tenancies and higher turnover. Who's the typical renter profile here, and what's been the actual vacancy rate?
- Crime grade is F in this area — have there been break-ins, vandalism, or insurance claims at this property in the last 3 years? What carrier currently insures it and at what premium?
- The area grade is low — what's the realistic commute time and amenity access for the typical tenant pool here? Any planned neighborhood developments (good or bad) we should know about?
- What's the average days-on-market for RENTAL listings here right now (not sales)? A rising rental-DOM trend means longer vacancies and softer asking-rent achievability than the comps imply.
- What's the recent tenant-quality profile in this submarket — average credit score on applications, eviction rate, late-payment / NSF rate, and stable-employment percentage? A property-management company in the area should have these aggregated.
- How much new apartment / multifamily construction is in the pipeline within 1–3 miles? Heavy new supply (>2% of stock underway) typically softens rents 12–24 months out; light construction supports rent growth.
Investment metrics
- 1% rule
- 0.88% ✗
- Cap rate
- 6.32%
- Cash-on-cash
- 0.10%
- DSCR
- 1.00
- GRM
- 9.5
CMA / ARV
- ARV (on-the-fly)
- $365,981
- Comps found
- 1
Show comp detail 1 sale within ~0.75 mi
| Address | Dist | Beds/Ba | Sqft | Sold | Price | $/sf | Match |
|---|---|---|---|---|---|---|---|
| 106 Leggett St | 0.00mi | 6/6.0 | 3,773 (0%) | 1mo | $364,900 | $97 | 99 |
Match score weights: distance 35% · size 25% · config 20% · recency 20%. Top-matched comps best support the ARV.
Projected returns pro-forma
-3.0% appreciation · 3.64% rent growth · sell at horizon
- IRR
- -15.4%
- Equity multiple
- 0.45×
- Total profit
- $-61,882
- Equity at exit
- $59,626
- IRR
- -5.8%
- Equity multiple
- 0.61×
- Total profit
- $-43,454
- Equity at exit
- $34,576
Cash invested: $111,972 (down + closing). Projections, not guarantees.
Landlord ↔ Tenant lean methodology
- Overall (STATE)
- 92 Strongly Landlord-Friendly
- State Arkansas
- 92 Strongly Landlord-Friendly · R+14
- County
- — inherits STATE
- City
- — inherits STATE
ZIP-level market 72401
- Home prices YoY
- -34.2%
- Rents YoY
- 3.6%
- Active inventory
- 295
- Price-to-rent
- 28.5×
Monthly cashflow live
- Estimated rent
- $3,510 medium interval (Pro) →
- Mortgage (P&I)
- −$2,097
- Tax est. 1.5%
- −$500 /mo · $5,998/yr
- Insurance
- −$167
- HOA
- −$0
- Vacancy / Maint / Mgmt
- −$737
- Net cashflow
- $9
Break-even live
3-unit breakdown (identical units grouped — click to expand)
| Units | Beds | Baths | Est. rent |
|---|---|---|---|
| 3× units | 2 | 2 | $3,510 |
| #1 | 2 | 2 | $1,170 |
| #2 | 2 | 2 | $1,170 |
| #3 | 2 | 2 | $1,170 |
| Total (3 units) | $3,510 | ||
UW: 25.0% down · 7.5% · 30yr · 1.5% tax · 5.0% vac · 8.0% maint · 8.0% mgmt
Financing live
Cash to close
- Down payment
- $99,975
- Closing costs
- $11,997
- Reserves months
- —
- Total cash needed
- —
Loan-product check · same deal, 3 products live
Conventional
25% down · 7.5% · 30yr
- Down + closing
- —
- Monthly P&I
- —
- Monthly cashflow
- —
- DSCR
- —
- Eligible?
- —
Personal DTI + credit; lowest rate.
DSCR
20% down · 8.5% · 30yr
- Down + closing
- —
- Monthly P&I
- —
- Monthly cashflow
- —
- DSCR
- —
- Eligible?
- —
No personal income docs; deal must DSCR.
Hard money
10% down · 12.0% · 12mo
- Down + closing
- —
- Monthly P&I
- —
- Monthly cashflow
- —
- DSCR
- —
- Eligible?
- —
Short-term bridge; refi at stabilization.
Listing history 15 events
-
2026-04-22status Under Contract
-
2026-03-13$399,900 New Listing
-
2026-02-13historical
-
2025-11-13$399,900 Active
-
2025-11-13$399,900 New Listing
-
2025-10-21historical
-
2025-08-26$399,900 Active
-
2025-08-26$399,900 New Listing
-
2025-08-24historical
-
2025-03-31status Active
-
2025-03-31status Back on Market
-
2025-03-21historical
-
2025-03-20status Under Contract
-
2025-02-24$399,900 Active
-
2025-02-24$399,900 New Listing
ⓘ Source: listings_history table (triggers on properties + properties_extension) + one-shot
backfill from property_details.listing_events for pre-trigger history.
Climate risk First Street
- Flood 1/10 Low FEMA zone X · 0% chance over 30 yrs
- Wildfire 3/10 Moderate
- Heat 6/10 Major 7 d/yr ≥109°F today · 21 d/yr by 30 yrs out
- Wind 3/10 Moderate 6% chance of damaging wind over 30 yrs
- Air quality 1/10 Low 0 unhealthy d/yr today · 0 by 30 yrs out
Nearby sold comps map
Loading sold comps map…
Walkable amenities ~0.75 mi
Loading nearby amenities…
Taxation est. · year 1
- Rental income
- $42,120
- − Mortgage interest
- −$22,401
- − Property taxes
- −$5,998
- − Insurance
- −$2,000
- − Repairs & maintenance
- −$3,370
- − Management
- −$3,370
- − Depreciation
- −$11,633
- Taxable loss
- −$6,651
- Est. tax savings @ 24.0%
- +$1,596
- After-tax cash flow
- $1,708/yr
For passive investors: Depreciation is non-cash, so a rental often shows a tax loss while cash-flowing — sheltering income. Rental losses are passive: they offset passive income freely, and up to $25,000/yr can offset ordinary (W-2) income if you actively participate and your MAGI is under $100k (phasing out to $0 by $150k); unused losses carry forward. On sale, claimed depreciation is recaptured at up to 25%, and gains may owe capital-gains tax (a 1031 exchange can defer both). Figures are a year-1 estimate at your 24.0% rate — not tax advice; consult a CPA.
Condition & rehab AI · 7 photos
This fully occupied triplex in Jonesboro, Arkansas, is in good condition with minimal repairs needed. It offers immediate rental income and long-term potential in a prime location.
Value-add opportunities
- Both Paint exterior siding — Fresh paint can enhance curb appeal and property value.
- Both Clean and maintain gutters — Clean gutters improve drainage and prevent water damage, enhancing property value and reducing maintenance costs.
Renovation cost estimate screening
Value-add ROI direction
- Both Paint exterior siding — Fresh paint can enhance curb appeal and property value. ↑
- Both Clean and maintain gutters — Clean gutters improve drainage and prevent water damage, enhancing property value and reducing maintenance costs. ↑
ⓘ Cost ranges are severity-bucket heuristics (US national rule-of-thumb). Get contractor quotes + a written scope before underwriting a rehab budget.
Schools (NCES district)
- District
- Jonesboro School District
- NCES district ID
- 0508280
- Math proficiency
- 28% ▼ -9.00%
- Reading proficiency
- 28% ▼ -8.00%
- Median HH income
- $34,347
- Composite
- 23.06/100
- National rank
- #7967
- State rank
- #169 of 238 in AR
Livability — Jonesboro
- Score
- 65/100
- State rank
- #145
- US rank
- #12692
Category grades
Schools grade is shown separately in the Schools card above.
Census & demographics
- Census place
- Jonesboro, AR
- County
- Craighead County · 97,185 people
- City population
- 91,245
- Metro
- Jonesboro, AR
- Population (ZIP)
- 42,602
- Household income
- $45,329
- Rent vs Own
- Severe rent burden
- 2606.0
Population outlook (Craighead County) Hauer SSP2
- Today (2025)
- 122,235 people
- By 2030
- 131,338 · +7.4%
- By 2040
- 149,862 · +22.6%
- By 2050
- 168,034 · +37.5%
- By 2075
- 208,094 · +70.2%
- By 2100
- 233,251 · +90.8%
Race, ethnicity, and origin ACS 2023
- Neighborhood character
- Diverse neighborhood (Simpson 0.56)
- Race & ethnicity
- White 60% Black 26% Hispanic / Latino 9% Two or more races 7%
- Hispanic origin (detail)
- Mexican 8%
- Common ancestry
- Slovak 2% Italian 1% Lithuanian 1%
- Foreign-born
- 4% · Canada
- Languages at home
- 92% English-only · Spanish 7%
Political lean MEDSL · Craighead
- 2024 margin
- Solid R (+37.4) · D 30.1% · R 67.5% · Other 2.4%
- 2008→2024 swing
- -12.9pp toward R · 2008: -24.5pp · 2024: -37.4pp
- All cycles
- 2024: R+37.4 2020: R+35.4 2016: R+35.2 2012: R+31.1 2008: R+24.5
Not yet ingested
- Civics
- —
Market trends
- HPI YoY
- ▼ -108.25%
- Current HPI
- 208.2079
- Rent YoY
- ▲ 3.64%
- Metro
- Jonesboro, AR
- State GDP YoY
- ▲ 3.80%
- F500 in state
- 10
Industry mix (Fortune 500 HQ in AR)
| Industry | F500 HQs | Revenue |
|---|---|---|
| Retail | 1 | $681B |
|
||
| Food / Agriculture | 1 | $53B |
|
||
| Retail / Energy | 1 | $22B |
|
||
| Transportation / Logistics | 1 | $12B |
|
||
| Energy | 1 | $4B |
|
||
Price history
+0.0% since first listed15 events — show timeline
- 2026-04-22 Pending — CARMLS
- 2026-03-13 Listed $399,900 CARMLS
- 2026-02-13 Listing Removed — CARMLS
- 2025-11-13 Listed $399,900 NEABOR MLS
- 2025-11-13 Listed $399,900 CARMLS
- 2025-10-21 Listing Removed — CARMLS
- 2025-08-26 Listed $399,900 CARMLS
- 2025-08-26 Listed $399,900 NEABOR MLS
- 2025-08-24 Listing Removed — CARMLS
- 2025-03-31 Relisted — NEABOR MLS
- 2025-03-31 Relisted — CARMLS
- 2025-03-21 Delisted — NEABOR MLS
- 2025-03-20 Pending — CARMLS
- 2025-02-24 Listed $399,900 NEABOR MLS
- 2025-02-24 Listed $399,900 CARMLS
Cash-flow waterfall
monthlySold comps — $/sqft
last 12 mo · ≤1 miLoading sold comps…