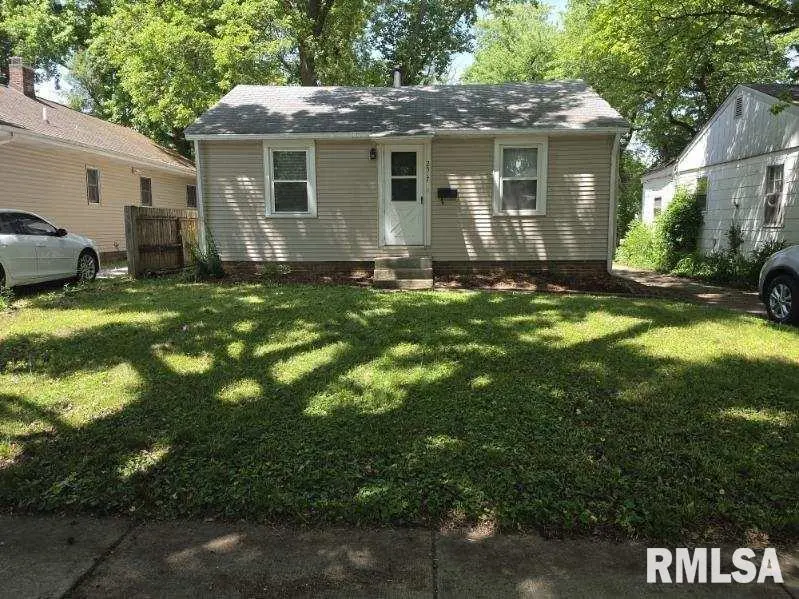
2517 Holmes Ave · Springfield, IL
Flood risk 1/10 · Minimal
- FEMA flood zone
- X (unshaded)
- Chance of flooding over 30 yrs
- 0.0%
- Est. flood insurance / yr
- $473 – $860
Fire risk 1/10 · Minimal
- Est. fire insurance / yr
- $804 – $1,492
Heat risk 4/10 · Minor
- Hot days now (above 105°F)
- 7 days/yr
- Hot days in 30 yrs
- 20 days/yr
Wind risk 2/10 · Minimal
- Chance of severe wind over 30 yrs
- 1.0%
Air-quality risk 2/10 · Minimal
- Unhealthy air days now
- 1 days/yr
- Unhealthy air days in 30 yrs
- 2 days/yr
Risk factors via First Street. Map © Google.
Why this score? — see what drove the B- grade
The composite is a weighted blend of 9 inputs, each scored 0–100. Each bar is that input's sub-score; the figure is the points it added to the 100-point composite (weight × sub-score).
- Cash flow +24.9/30.0
- ARV discount +15.0/15.0
- DSCR +8.1/10.0
- 1% rule +7.3/10.0
- Rent growth +4.1/5.0
- Livability +4.0/5.0
- Condition / age +2.5/5.0
- Schools +1.7/10.0
- Appreciation +0.0/10.0
$100,000
🖨 Deal sheet (PDF) 📄 Offer letter ✓ Due diligence
Listing remarks
Perfect starter home or investment property or even someone that travels in town occasionally and wants to rent out main level. This bungalow has 2 bedrooms and 1 bath and the main level. The basement is partially finished with a kitchenette, family room and a office/guest space and 2nd bath. Makes for a great area to entertain or space for a guest. Downstairs can be blocked off for private basement entrance. Two car detached garage is just outside the large fenced-in back yard. Backyard also has large concrete stamped patio. Replacement windows. Currently rented month to month for $1,550.00 and tenant would like to stay.
Key facts
- Kitchenette
- Main level
- Office guest space
Tags
Property features AI
Exterior
- Parking: Detached 2-car garage; Shared driveway
- Utilities: Public water; Public sewer
- Home design: Single family residence; Built in 1940
- Construction: Shingle roof; Full basement (partially finished)
- Exterior features: Level lot; Paved road access
Interior
- Kitchen: Microwave; Refrigerator
- Bedrooms: 2 bedrooms (bedrooms located on main level)
- Flooring: Carpet in bedrooms and living areas; Vinyl flooring in kitchen and additional rooms
- Bathrooms: 2 full bathrooms
- Heating & cooling: Central air; Forced air heating; Gas water heater
- Interior features: Ceiling fans
- Laundry & utility: Laundry room in basement
Neighborhood map
What this means for you Summary
Snapshot
- This is a 2-bed/2.0-bath single-family listed at $100k.
Deal economics
- At list price, monthly cash flow is $215 ($3k/yr) — positive.
- The deal already cash-flows at list — no discount required.
- Meets the 1% rule at list price ($1k rent vs $100k).
- Cap rate 8.9% vs local median 4.9% in Springfield — top-decile yield for the area; either an underpriced asset or a hidden risk that comps aren't pricing in. Stress-test before assuming the spread holds.
Location & tenants
- Location reads 79/100 on livability (#122 in IL, #2,138 nationally) — a middle-class / working-renter tenant base. Strengths: amenities A+, commute A+, cost of living A+; Watch: schools D+, crime F.
- Springfield SD 186 (urban): math 17% / reading 22% proficiency, ranked #438 of 620 in IL (top 71%) — low school quality limits family demand, transient renter base, plan for 1-2y turnover; 64% free/reduced lunch — lower-income household profile, screen leases tightly.
- Market conditions: Rents rising fast (+6.3%/yr); 177 active listings in the ZIP; 15 comparable units currently listed for rent nearby; rentals at typical pace (median 22d on market — plan ~3-4 weeks tenant-placement turnaround); 40% of comp listings sitting > 30 days — soft ceiling on asking rent; 225 units permitted in Sangamon County in 2024 (48 in 5+ unit buildings).
Forward outlook
- Local home prices are declining (-3.0%/yr); year-one equity from $691 of loan paydown is wiped out by about $3k of value loss. Plan a longer hold.
- Sangamon County population projected to shrink 9% by 2050 — rents likely to lag national; underwrite the cash flow, not the appreciation.
- At projected returns (-3.0% appreciation + 6.3% rent growth), your $28k cash investment doubles in ~9 years — after that, you're playing with house money.
Negotiation context
- Only 6 days on market — expect competitive offers; lowballing is unlikely to land.
- 3 sale attempts since 6y ago with the ask held roughly flat each time — persistent listings suggest the price (not the market) is what's stuck; bring a comps-based counter.
- Current owner paid $74k; 35% above their basis — modest negotiation headroom, anchor on the comps not their cost.
Risks & watch-outs
- Watch-outs: built in 1940 — expect roof / HVAC / electrical / plumbing capex.
Questions for the listing agent
- Built in 1940 — when were the roof, HVAC, electrical panel, plumbing, and water heater last replaced?
- Is there a deadline driving the sale (1031 exchange, divorce, estate, relocation)? That informs how much negotiation room exists.
- Schools are D-rated, which usually means shorter tenancies and higher turnover. Who's the typical renter profile here, and what's been the actual vacancy rate?
- Crime grade is F in this area — have there been break-ins, vandalism, or insurance claims at this property in the last 3 years? What carrier currently insures it and at what premium?
- What's the average days-on-market for RENTAL listings here right now (not sales)? A rising rental-DOM trend means longer vacancies and softer asking-rent achievability than the comps imply.
- What's the recent tenant-quality profile in this submarket — average credit score on applications, eviction rate, late-payment / NSF rate, and stable-employment percentage? A property-management company in the area should have these aggregated.
- How much new for-sale + rental construction is in the pipeline within 1–3 miles? Heavy new supply typically softens prices + rents 12–24 months out; constrained supply supports both.
Investment metrics
- 1% rule
- 1.23% ✓
- Cap rate
- 8.87%
- Cash-on-cash
- 9.20%
- DSCR
- 1.41
- GRM
- 6.8
CMA / ARV
- ARV (on-the-fly)
- $124,899
- Comps found
- 12
Show comp detail 12 sales within ~0.75 mi
| Address | Dist | Beds/Ba | Sqft | Sold | Price | $/sf | Match |
|---|---|---|---|---|---|---|---|
| 2830 S State St | 0.38mi | 2/1.5 | 1,346 (+0%) | 1mo | $139,000 | $103 | 79 |
| 2501 S College St | 0.29mi | 3/2.0 (+1) | 1,473 (+10%) | 2mo | $159,900 | $109 | 64 |
| 2609 S Lowell Ave | 0.13mi | 1/1.0 (-1) | 1,148 (-14%) | 2mo | $47,000 | $41 | 59 |
| 2425 S State St | 0.24mi | 3/1.5 (+1) | 1,510 (+12%) | 3mo | $170,000 | $113 | 59 |
| 2408 S 4th St | 0.62mi | 2/1.0 | 1,316 (-2%) | 7mo | $86,900 | $66 | 58 |
| 29 Belle Pl | 0.55mi | 3/2.0 (+1) | 1,392 (+4%) | 7mo | $130,000 | $93 | 58 |
| 1927 S College St | 0.56mi | 3/1.5 (+1) | 1,304 (-3%) | 6mo | $130,000 | $100 | 57 |
| 49 Ruth Ct | 0.57mi | 2/1.0 | 1,260 (-6%) | 5mo | $98,000 | $78 | 55 |
| 1929 S Walnut St | 0.49mi | 3/1.0 (+1) | 1,416 (+5%) | 6mo | $206,000 | $145 | 54 |
| 66 Ruth Ct | 0.55mi | 3/1.0 (+1) | 1,244 (-7%) | 6mo | $92,000 | $74 | 48 |
| 512 Broad Pl | 0.73mi | 2/1.0 | 1,450 (+8%) | 1mo | $119,900 | $83 | 48 |
| 9 Ruth Ct | 0.56mi | 3/1.0 (+1) | 1,223 (-9%) | 5mo | $93,000 | $76 | 46 |
Match score weights: distance 35% · size 25% · config 20% · recency 20%. Top-matched comps best support the ARV.
Projected returns pro-forma
-3.0% appreciation · 6.32% rent growth · sell at horizon
- IRR
- 1.6%
- Equity multiple
- 1.06×
- Total profit
- $1,758
- Equity at exit
- $14,910
- IRR
- 14.4%
- Equity multiple
- 2.36×
- Total profit
- $37,975
- Equity at exit
- $8,646
Cash invested: $28,000 (down + closing). Projections, not guarantees.
Landlord ↔ Tenant lean methodology
- Overall (STATE)
- 43 Moderately Tenant-Leaning
- State Illinois
- 43 Moderately Tenant-Leaning · D+7
- County
- — inherits STATE
- City
- — inherits STATE
ZIP-level market 62704
- Home prices YoY
- -31.1%
- Rents YoY
- 6.3%
- Active inventory
- 177
- Price-to-rent
- 6.8×
Monthly cashflow live
- Estimated rent
- $1,227 high interval (Pro) →
- Mortgage (P&I)
- −$524
- Tax from tax record
- −$189 /mo · $2,264/yr
- Insurance
- −$42
- HOA
- −$0
- Vacancy / Maint / Mgmt
- −$258
- Net cashflow
- $215
Break-even live
Sensitivity live
| Price | -10% $271 | -5% $243 | +0% $215 | +5% $186 | +10% $158 |
|---|---|---|---|---|---|
| Rent | -10% $118 | -5% $166 | +0% $215 | +5% $263 | +10% $312 |
| Rate | -1.0pp $265 | -0.5pp $240 | base $215 | +0.5pp $189 | +1.0pp $162 |
UW: 25.0% down · 7.5% · 30yr · 1.5% tax · 5.0% vac · 8.0% maint · 8.0% mgmt
Financing live
Cash to close
- Down payment
- $25,000
- Closing costs
- $3,000
- Reserves months
- —
- Total cash needed
- —
Loan-product check · same deal, 3 products live
Conventional
25% down · 7.5% · 30yr
- Down + closing
- —
- Monthly P&I
- —
- Monthly cashflow
- —
- DSCR
- —
- Eligible?
- —
Personal DTI + credit; lowest rate.
DSCR
20% down · 8.5% · 30yr
- Down + closing
- —
- Monthly P&I
- —
- Monthly cashflow
- —
- DSCR
- —
- Eligible?
- —
No personal income docs; deal must DSCR.
Hard money
10% down · 12.0% · 12mo
- Down + closing
- —
- Monthly P&I
- —
- Monthly cashflow
- —
- DSCR
- —
- Eligible?
- —
Short-term bridge; refi at stabilization.
Rent comps 15 comps
| Address | Beds | Baths | Sqft | Rent | $/sqft | DOM | Units | Dist |
|---|---|---|---|---|---|---|---|---|
| 2715 S MacArthur Blvd Unit 01 Springfield, IL | 2.0 | 1.5 | 935 | $975 | $1.04 | 44d | 1 | 0.47mi |
| 1501 S Spring St Springfield, IL | 2.0 | 1.0 | 1000 | $1,000 | $1.00 | 21d | 1 | 0.88mi |
| 12 Douglas Ct Springfield, IL | 3.0 | 1.0 | 1000 | $1,300 | $1.30 | 21d | 1 | 0.97mi |
| 2257 S 10th St Springfield, IL | 2.0 | 1.0 | 1100 | $1,150 | $1.05 | 44d | 1 | 1.03mi |
| 2328 S 10th St Springfield, IL | 3.0 | 1.0 | 1100 | $1,200 | $1.09 | 44d | 1 | 1.06mi |
| 1726 S 6th St Springfield, IL | 3.0 | 1.5 | 1408 | $1,500 | $1.07 | 44d | 1 | 1.07mi |
| 1729 W Iles Ave Springfield, IL | 3.0 | 1.0 | 1162 | $1,500 | $1.29 | 21d | 1 | 1.10mi |
| 1600 S 6th St Unit 1 Springfield, IL | 3.0 | 2.0 | 1100 | $1,250 | $1.14 | 21d | 1 | 1.14mi |
| 525 E Pine St Unit 4 Springfield, IL | 2.0 | 2.0 | 1250 | $1,200 | $0.96 | 21d | 1 | 1.19mi |
| 525 E Pine St Springfield, IL | 2.0 | 2.0 | 1250 | $1,200 | $0.96 | 44d | 1 | 1.19mi |
| 229 W Allen St Springfield, IL | 3.0 | 1.5 | 1050 | $1,305 | $1.24 | 21d | 1 | 1.19mi |
| 1213 E Ash St Springfield, IL | 3.0 | 2.0 | 1861 | $2,030 | $1.09 | 21d | 1 | 1.35mi |
| 1666 Seven Pines Rd Springfield, IL | 1.0–4.0 | 1.0–1.5 | 1025 | $1,167 | $1.14 | 21d | 1 | 1.39mi |
| 1214 S 7th St Unit C Springfield, IL | 3.0 | 1.0 | 1200 | $1,350 | $1.12 | 44d | 1 | 1.40mi |
| 423 W Lawrence Ave Unit 2 Springfield, IL | 2.0 | 1.0 | 900 | $1,050 | $1.17 | 21d | 1 | 1.50mi |
Listing history 14 events
-
2026-06-05days on market $100,000 Active 6 DOM
-
2026-06-03days on market $100,000 Active 5 DOM
-
2026-06-02days on market $100,000 Active 4 DOM
-
2026-06-01days on market $100,000 Active 3 DOM
-
2026-05-31days on market $100,000 Active 2 DOM
-
2026-05-28$100,000 Active
-
2021-08-06historical
-
2021-08-06historical
-
2020-10-16soldstatus $74,000
-
2020-10-09soldstatus $74,000
-
2020-10-09soldstatus $74,000
-
2020-08-24$78,500
-
2020-08-24$78,500
-
2009-11-05soldstatus $70,000
ⓘ Source: listings_history table (triggers on properties + properties_extension) + one-shot
backfill from property_details.listing_events for pre-trigger history.
Tax reassessment forecast IL · Partial reset (capped growth)
- Current annual tax
- $2,264 · $189/mo
- Projected year-2 tax
- $2,267 · $189/mo
- Expected delta
- +$3/yr ($0/mo · 0.1%)
ⓘ Screening estimate from a state-policy table — verify with the county assessor before closing.
Climate risk First Street
- Flood 1/10 Low FEMA zone X (unshaded) · 0% chance over 30 yrs
- Wildfire 1/10 Low
- Heat 4/10 Moderate 7 d/yr ≥105°F today · 20 d/yr by 30 yrs out
- Wind 2/10 Low 100% chance of damaging wind over 30 yrs
- Air quality 2/10 Low 1 unhealthy d/yr today · 2 by 30 yrs out
Nearby sold comps map
Loading sold comps map…
Walkable amenities ~0.75 mi
Loading nearby amenities…
Taxation est. · year 1
- Rental income
- $14,724
- − Mortgage interest
- −$5,602
- − Property taxes
- −$2,264
- − Insurance
- −$500
- − Repairs & maintenance
- −$1,178
- − Management
- −$1,178
- − Depreciation
- −$2,909
- Taxable income
- $1,094
- Est. tax owed @ 24.0%
- −$263
- After-tax cash flow
- $2,313/yr
For passive investors: Depreciation is non-cash, so a rental often shows a tax loss while cash-flowing — sheltering income. Rental losses are passive: they offset passive income freely, and up to $25,000/yr can offset ordinary (W-2) income if you actively participate and your MAGI is under $100k (phasing out to $0 by $150k); unused losses carry forward. On sale, claimed depreciation is recaptured at up to 25%, and gains may owe capital-gains tax (a 1031 exchange can defer both). Figures are a year-1 estimate at your 24.0% rate — not tax advice; consult a CPA.
Schools (NCES district)
- District
- Springfield SD 186
- NCES district ID
- 1737080
- Math proficiency
- 17% ▼ -7.00%
- Reading proficiency
- 22% ▼ -5.00%
- Median HH income
- $43,744
- Composite
- 16.89/100
- National rank
- #9142
- State rank
- #438 of 620 in IL
Livability — Springfield
- Score
- 79/100
- State rank
- #122
- US rank
- #2138
Category grades
Schools grade is shown separately in the Schools card above.
Census & demographics
- Census place
- Springfield, IL
- County
- Sangamon County · 115,414 people
- City population
- 59,955
- Metro
- Springfield, IL
- Population (ZIP)
- 40,046
- Household income
- $69,976
- Rent vs Own
- Severe rent burden
- 1529.0
Population outlook (Sangamon County) Hauer SSP2
- Today (2025)
- 198,317 people
- By 2030
- 196,127 · -1.1%
- By 2040
- 188,664 · -4.9%
- By 2050
- 179,624 · -9.4%
- By 2075
- 155,027 · -21.8%
- By 2100
- 122,588 · -38.2%
Race, ethnicity, and origin ACS 2023
- Neighborhood character
- Predominantly White (74%)
- Race & ethnicity
- White 74% Black 15% Two or more races 5% Hispanic / Latino 4% Asian 4%
- Common ancestry
- Lithuanian 2% Romanian 2% Slovak 2%
- Foreign-born
- 6% · Canada, China, Vietnam
- Languages at home
- 92% English-only · Spanish 2% Other Indo-European 1% Tagalog/Filipino 1%
Political lean MEDSL · Sangamon
- 2024 margin
- Toss-up / Even · D 46.6% · R 51.6% · Other 1.8%
- 2008→2024 swing
- -9.3pp toward R · 2008: 4.4pp · 2024: -5.0pp
- All cycles
- 2024: R+5.0 2020: R+4.4 2016: R+9.4 2012: R+8.7 2008: D+4.4
Not yet ingested
- Civics
- —
Market trends
- HPI YoY
- ▼ -70.79%
- Current HPI
- 156.7086
- Rent YoY
- ▲ 6.32%
- Metro
- Springfield, IL
- State GDP YoY
- ▲ 1.59%
- F500 in state
- 60
Industry mix (Fortune 500 HQ in IL)
| Industry | F500 HQs | Revenue |
|---|---|---|
| Insurance | 4 | $201B |
|
||
| Consumer Goods | 4 | $87B |
|
||
| Industrial Machinery | 3 | $64B |
|
||
| Healthcare | 2 | $55B |
|
||
| Retail / Pharmacy | 1 | $148B |
|
||
| Agriculture / Food | 1 | $86B |
|
||
Price history
+42.9% since first listed9 events — show timeline
- 2026-05-28 Listed $100,000 RMLSA as Distributed by MLS Grid
- 2021-08-06 Listing Removed — RMLSA as Distributed by MLS Grid
- 2021-08-06 Listing Removed — RMLSA as Distributed by MLS Grid
- 2020-10-16 Sold (Public Records) $74,000 Public Records
- 2020-10-09 Sold (MLS) $74,000 MRED as Distributed by MLS Grid
- 2020-10-09 Sold (MLS) $74,000 RMLSA as Distributed by MLS Grid
- 2020-08-24 Listed $78,500 MRED as Distributed by MLS Grid
- 2020-08-24 Listed $78,500 RMLSA as Distributed by MLS Grid
- 2009-11-05 Sold (Public Records) $70,000 Public Records
Property tax history
+4.0%/yrLatest (2025): $2,264 · +5.0% YoY. Source: county tax records.
Cash-flow waterfall
monthlySold comps — $/sqft
last 12 mo · ≤1 miLoading sold comps…