1207 County Road 3776 · Atlanta, TX
Flood risk 1/10 · Minimal
- FEMA flood zone
- X (unshaded)
- Chance of flooding over 30 yrs
- 0.0%
- Est. flood insurance / yr
- $507 – $1,088
Fire risk 6/10 · Moderate
- Est. fire insurance / yr
- $1,222 – $2,270
Heat risk 6/10 · Moderate
- Hot days now (above 112°F)
- 7 days/yr
- Hot days in 30 yrs
- 22 days/yr
Wind risk 6/10 · Moderate
- Chance of severe wind over 30 yrs
- 27.0%
Air-quality risk 1/10 · Minimal
- Unhealthy air days now
- 0 days/yr
- Unhealthy air days in 30 yrs
- 0 days/yr
Risk factors via First Street. Map © Google.
Why this score? — see what drove the D grade
The composite is a weighted blend of 9 inputs, each scored 0–100. Each bar is that input's sub-score; the figure is the points it added to the 100-point composite (weight × sub-score).
- Cash flow +9.2/30.0
- ARV discount +7.5/15.0
- Appreciation +6.8/10.0
- Schools +3.6/10.0
- Livability +3.4/5.0
- DSCR +2.6/10.0
- Rent growth +2.5/5.0
- Condition / age +2.5/5.0
- 1% rule +2.4/10.0
$175,000
🖨 Deal sheet 📄 Offer letter ✓ Due diligence
Listing remarks MLS
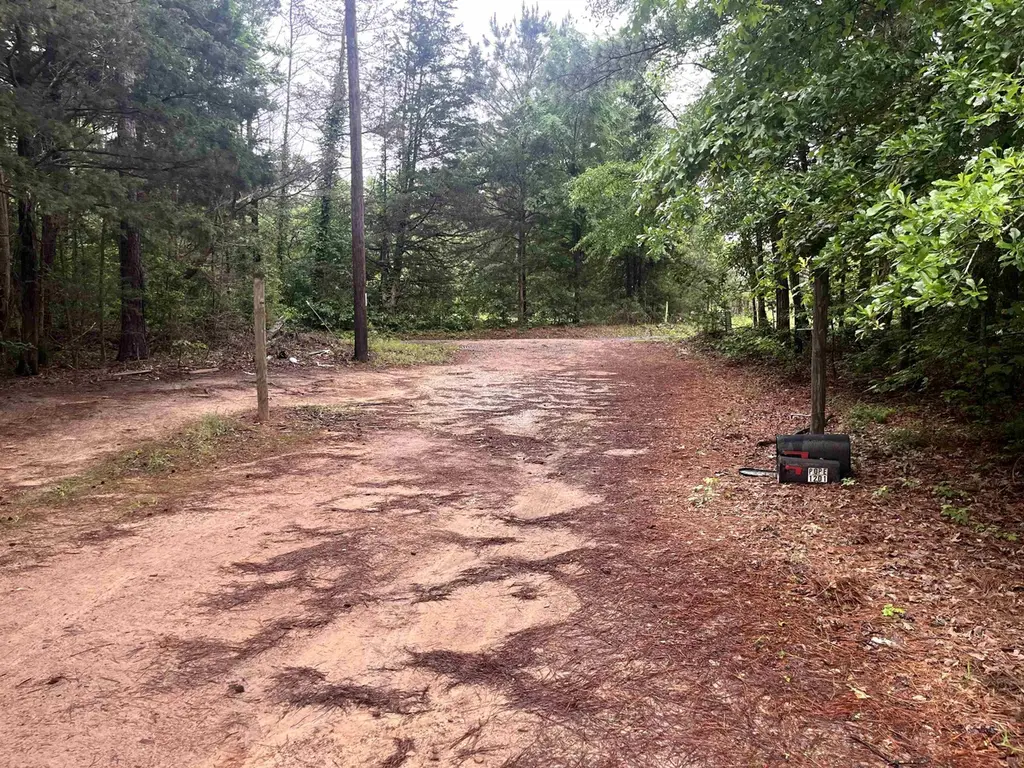
3/2 Triple wide mobile home on almost 7 wooded acres . 30 X 40 shop with 10,000 lb car lift. Deep well
Key facts
- Floored shop
- Large back porch
- 6.94 acre lot
Tags
Property features AI
Exterior
- Utilities: Propane
- Home design: Manufactured home; Residential property
- Exterior features: Sloped lot; Workshop (other structure)
Interior
- Kitchen: Includes dishwasher and refrigerator
- Bedrooms: Total rooms: 5
- Bathrooms: 2 full bathrooms
- Heating & cooling: Central heating (electric); Central air conditioning
- Interior features: Dishwasher; Refrigerator; Electric water heater; Wood-burning fireplace (1)
- Laundry & utility: Electric water heater
Neighborhood map
What this means for you Summary
Snapshot
- This is a 3-bed/2.0-bath manufactured listed at $175k.
Deal economics
- At list price, monthly cash flow is $-131 ($-2k/yr) — negative.
- To cash-flow at today's rent, offer at most $152k (13.2% below list).
- To meet the 1% rule (rent ≥ 1% of price), the offer needs to be $130k (26.0% below list).
- Recommended offer: $130k (26.0% below list) — sets the bar for 1% rule.
Location & tenants
- Location reads 68/100 on livability (#500 in TX) — a middle-class / working-renter tenant base. Strengths: cost of living A+, housing A+, health & safety A+; Watch: schools D+, employment D, amenities F.
- Queen City ISD (rural): math 39% / reading 45% proficiency, ranked #355 of 826 in TX (top 43%) — families likely to look elsewhere, expect single-tenant / working-renter base with shorter leases.
- Market conditions: 65 active listings in the ZIP; 12 units permitted in Cass County in 2024 (0 in 5+ unit buildings).
Forward outlook
- In year one you build about $8k of equity ($1k loan paydown + $6k appreciation (3.7% local appreciation)).
- Cass County population projected to shrink 9% by 2050 — rents likely to lag national; underwrite the cash flow, not the appreciation.
- By year 5, paydown + projected appreciation supports a ~$33k cash-out refi (75% LTV) — recoverable capital for the next deal without selling this one.
Negotiation context
- It's been on market 23 days — a 2% lower offer ($172k) is reasonable based on typical stale-listing flexibility.
- 3 sale attempts since 5y ago with the ask held roughly flat each time — persistent listings suggest the price (not the market) is what's stuck; bring a comps-based counter.
- Current owner paid $118k; 48% above their basis — modest negotiation headroom, anchor on the comps not their cost.
Risks & watch-outs
- Climate carrying-cost: major wind risk, 27% chance of damaging wind over 30y; major wildfire risk; extreme-heat days projected 7→22/yr by 2055 (HVAC capex compounding) — expect insurance premiums to compound above CPI over the hold.
Questions for the listing agent
- What do current leases actually rent for vs. the listed asking? Can we see a recent rent roll and the last 12 months of T-12 income?
- Is there a deadline driving the sale (1031 exchange, divorce, estate, relocation)? That informs how much negotiation room exists.
- Schools are D-rated, which usually means shorter tenancies and higher turnover. Who's the typical renter profile here, and what's been the actual vacancy rate?
- The area grade is low — what's the realistic commute time and amenity access for the typical tenant pool here? Any planned neighborhood developments (good or bad) we should know about?
- What's the average days-on-market for RENTAL listings here right now (not sales)? A rising rental-DOM trend means longer vacancies and softer asking-rent achievability than the comps imply.
- What's the recent tenant-quality profile in this submarket — average credit score on applications, eviction rate, late-payment / NSF rate, and stable-employment percentage? A property-management company in the area should have these aggregated.
- How much new for-sale + rental construction is in the pipeline within 1–3 miles? Heavy new supply typically softens prices + rents 12–24 months out; constrained supply supports both.
Investment metrics
- 1% rule
- 0.74% ✗
- Cap rate
- 5.40%
- Cash-on-cash
- -3.20%
- DSCR
- 0.86
- GRM
- 11.3
CMA / ARV
No comps found within radius.
Projected returns pro-forma
3.69% appreciation · 3.0% rent growth · sell at horizon
- IRR
- 6.6%
- Equity multiple
- 1.39×
- Total profit
- $19,184
- Equity at exit
- $85,541
- IRR
- 9.1%
- Equity multiple
- 2.47×
- Total profit
- $72,224
- Equity at exit
- $137,426
Cash invested: $49,000 (down + closing). Projections, not guarantees.
Landlord ↔ Tenant lean methodology
- Overall (STATE)
- 87 Strongly Landlord-Friendly
- State Texas
- 87 Strongly Landlord-Friendly · R+5
- County
- — inherits STATE
- City
- — inherits STATE
ZIP-level market 75572
- Home prices YoY
- 2.6%
- Active inventory
- 65
- Price-to-rent
- 11.3×
Monthly cashflow live
- Estimated rent
- $1,295 medium interval (Pro) →
- Mortgage (P&I)
- −$918
- Tax from tax record
- −$163 /mo · $1,958/yr
- Insurance
- −$73
- HOA
- −$0
- Vacancy / Maint / Mgmt
- −$272
- Net cashflow
- $-131
Break-even live
UW: 25.0% down · 7.5% · 30yr · 1.5% tax · 5.0% vac · 8.0% maint · 8.0% mgmt
Financing live
Cash to close
- Down payment
- $43,750
- Closing costs
- $5,250
- Reserves months
- —
- Total cash needed
- —
Loan-product check · same deal, 3 products live
Conventional
25% down · 7.5% · 30yr
- Down + closing
- —
- Monthly P&I
- —
- Monthly cashflow
- —
- DSCR
- —
- Eligible?
- —
Personal DTI + credit; lowest rate.
DSCR
20% down · 8.5% · 30yr
- Down + closing
- —
- Monthly P&I
- —
- Monthly cashflow
- —
- DSCR
- —
- Eligible?
- —
No personal income docs; deal must DSCR.
Hard money
10% down · 12.0% · 12mo
- Down + closing
- —
- Monthly P&I
- —
- Monthly cashflow
- —
- DSCR
- —
- Eligible?
- —
Short-term bridge; refi at stabilization.
Listing history 25 events
-
2026-06-19days on market $175,000 Active 23 DOM
-
2026-06-18days on market $175,000 Active 22 DOM
-
2026-06-17days on market $175,000 Active 21 DOM
-
2026-06-16days on market $175,000 Active 20 DOM
-
2026-06-15days on market $175,000 Active 19 DOM
-
2026-06-14days on market $175,000 Active 17 DOM
-
2026-06-13days on market $175,000 Active 16 DOM
-
2026-06-10days on market $175,000 Active 14 DOM
-
2026-06-09days on market $175,000 Active 13 DOM
-
2026-06-08days on market $175,000 Active 12 DOM
-
2026-06-07days on market $175,000 Active 11 DOM
-
2026-06-03days on market $175,000 Active 7 DOM
-
2026-06-02days on market $175,000 Active 6 DOM
-
2026-06-01days on market $175,000 Active 5 DOM
-
2026-05-31days on market $175,000 Active 4 DOM
-
2026-05-30days on market $175,000 Active 3 DOM
-
2026-05-28$175,000 Active
-
2021-03-16historical 102-char remark
Show marketing remark (102 chars)
3/2 Triple wide mobile home on almost 7 wooded acres . 30 X 40 shop with 10,000 lb car lift. Deep well
-
2021-03-15soldstatus $118,000 Sold 102-char remark
Show marketing remark (102 chars)
3/2 Triple wide mobile home on almost 7 wooded acres . 30 X 40 shop with 10,000 lb car lift. Deep well
-
2021-03-15soldstatus 102-char remark
Show marketing remark (102 chars)
3/2 Triple wide mobile home on almost 7 wooded acres . 30 X 40 shop with 10,000 lb car lift. Deep well
-
2021-01-25$135,000 Active 102-char remark
Show marketing remark (102 chars)
3/2 Triple wide mobile home on almost 7 wooded acres . 30 X 40 shop with 10,000 lb car lift. Deep well
-
2021-01-25$135,000 102-char remark
Show marketing remark (102 chars)
3/2 Triple wide mobile home on almost 7 wooded acres . 30 X 40 shop with 10,000 lb car lift. Deep well
-
2011-11-17soldstatus
-
2005-03-28soldstatus
-
2005-03-28soldstatus
ⓘ Source: listings_history table (triggers on properties + properties_extension) + one-shot
backfill from property_details.listing_events for pre-trigger history.
Tax reassessment forecast TX · Resets to sale price
- Current annual tax
- $1,958 · $163/mo
- Projected year-2 tax
- $3,202 · $267/mo
- Expected delta
- +$1,245/yr (+$104/mo · 63.6%)
ⓘ Screening estimate from a state-policy table — verify with the county assessor before closing.
Climate risk First Street
- Flood 1/10 Low FEMA zone X (unshaded) · 0% chance over 30 yrs
- Wildfire 6/10 Major
- Heat 6/10 Major 7 d/yr ≥112°F today · 22 d/yr by 30 yrs out
- Wind 6/10 Major 27% chance of damaging wind over 30 yrs
- Air quality 1/10 Low 0 unhealthy d/yr today · 0 by 30 yrs out
Nearby sold comps map
Loading sold comps map…
Walkable amenities ~0.75 mi
Loading nearby amenities…
Taxation est. · year 1
- Rental income
- $15,540
- − Mortgage interest
- −$9,803
- − Property taxes
- −$1,958
- − Insurance
- −$875
- − Repairs & maintenance
- −$1,243
- − Management
- −$1,243
- − Depreciation
- −$5,091
- Taxable loss
- −$4,672
- Est. tax savings @ 24.0%
- +$1,121
- After-tax cash flow
- $-447/yr
For passive investors: Depreciation is non-cash, so a rental often shows a tax loss while cash-flowing — sheltering income. Rental losses are passive: they offset passive income freely, and up to $25,000/yr can offset ordinary (W-2) income if you actively participate and your MAGI is under $100k (phasing out to $0 by $150k); unused losses carry forward. On sale, claimed depreciation is recaptured at up to 25%, and gains may owe capital-gains tax (a 1031 exchange can defer both). Figures are a year-1 estimate at your 24.0% rate — not tax advice; consult a CPA.
Schools (NCES district)
- District
- Queen City ISD
- NCES district ID
- 4836210
- Math proficiency
- 39% ▼ -3.00%
- Reading proficiency
- 45% ▼ -4.00%
- Median HH income
- $43,663
- Composite
- 35.53/100
- National rank
- #4908
- State rank
- #355 of 826 in TX
Livability — Atlanta
- Score
- 68/100
- State rank
- #500
- US rank
- #9952
Category grades
Schools grade is shown separately in the Schools card above.
Census & demographics
- Population (ZIP)
- 2,942
Population outlook (Cass County) Hauer SSP2
- Today (2025)
- 29,998 people
- By 2030
- 29,583 · -1.4%
- By 2040
- 28,512 · -5.0%
- By 2050
- 27,230 · -9.2%
- By 2075
- 24,917 · -16.9%
- By 2100
- 21,582 · -28.1%
Race, ethnicity, and origin ACS 2023
- Neighborhood character
- Predominantly White (80%)
- Race & ethnicity
- White 80% Black 16% Two or more races 3%
- Common ancestry
- Serbian 1% Slovak 1% Iranian 1%
- Foreign-born
- 2%
- Languages at home
- 93% English-only · German/W. Germanic 6% Arabic 1%
Political lean MEDSL · Cass
- 2024 margin
- Solid R (+65.7) · D 17.0% · R 82.7%
- 2008→2024 swing
- -25.2pp toward R · 2008: -40.4pp · 2024: -65.7pp
- All cycles
- 2024: R+65.7 2020: R+59.1 2016: R+59.7 2012: R+49.5 2008: R+40.4
Not yet ingested
- Civics
- —
Market trends
- HPI YoY
- ▲ 3.69%
- Current HPI
- 143.673
- Rent YoY
- —
- Metro
- —
- State GDP YoY
- ▲ 3.95%
- F500 in state
- 110
Industry mix (Fortune 500 HQ in TX)
| Industry | F500 HQs | Revenue |
|---|---|---|
| Energy | 16 | $1,198B |
|
||
| Technology | 5 | $198B |
|
||
| Engineering / Construction | 4 | $72B |
|
||
| Energy Services | 3 | $60B |
|
||
| Utilities | 3 | $41B |
|
||
| Healthcare | 2 | $330B |
|
||
Price history
+29.6% since first listed9 events — show timeline
- 2026-05-28 Listed $175,000 LAAR
- 2021-03-16 Listing Removed — CARMLS
- 2021-03-15 Sold (MLS) — TBOR
- 2021-03-15 Sold (MLS) $118,000 CARMLS
- 2021-01-25 Listed $135,000 TBOR
- 2021-01-25 Listed $135,000 CARMLS
- 2011-11-17 Sold (Public Records) — Public Records
- 2005-03-28 Sold (Public Records) — Public Records
- 2005-03-28 Sold (Public Records) — Public Records
Property tax history
+4.6%/yrLatest (2025): $1,958 · -2.7% YoY. Source: county tax records.
Cash-flow waterfall
monthlySold comps — $/sqft
last 12 mo · ≤1 miLoading sold comps…