 🏗️ New Construction
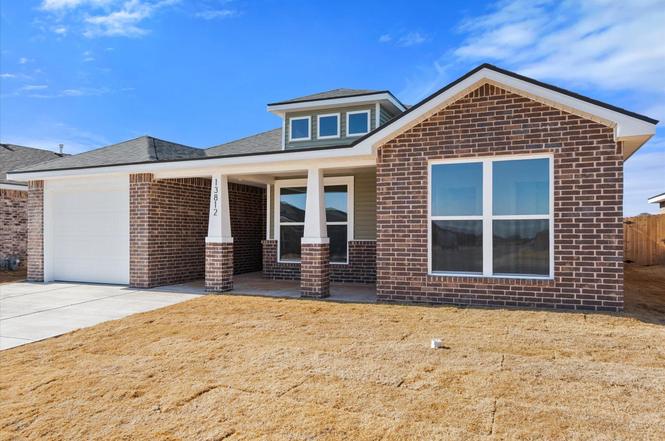
13812 Flint Ave · Lubbock, TX
Flood risk No data
- FEMA flood zone
- —
- Chance of flooding over 30 yrs
- —
- Est. flood insurance / yr
- —
Fire risk No data
- Est. fire insurance / yr
- —
Heat risk No data
- Hot days now (above threshold)
- —
- Hot days in 30 yrs
- —
Wind risk No data
- Chance of severe wind over 30 yrs
- —
Air-quality risk No data
- Unhealthy air days now
- —
- Unhealthy air days in 30 yrs
- —
Risk factors via First Street. Map © Google.
Why this score? — see what drove the C grade
The composite is a weighted blend of 9 inputs, each scored 0–100. Each bar is that input's sub-score; the figure is the points it added to the 100-point composite (weight × sub-score).
- Cash flow +22.2/30.0
- ARV discount +7.5/15.0
- DSCR +7.1/10.0
- Schools +4.8/10.0
- 1% rule +4.7/10.0
- Livability +4.0/5.0
- Rent growth +3.0/5.0
- Condition / age +2.5/5.0
- Appreciation +0.0/10.0
$196,000
🖨 Deal sheet 📄 Offer letter ✓ Due diligence
Listing remarks
Buy NOW and get up to $7,000 Use-It-Your-Way Cash! This inviting home combines style and function with a brick and vinyl exterior and a welcoming covered front entry. Inside, luxury vinyl plank flooring enhances the common areas, while the open-concept design connects the kitchen, living, and dining spaces. The kitchen features granite or quartz countertops, a spacious island with bar seating, stainless steel appliances, and an enclosed pantry. The secluded master suite offers a walk-in closet for your convenience.
Key facts
- Open-concept design
- Spacious island
- Covered front entry
Tags
Neighborhood map
What this means for you Summary
Snapshot
- This is a 3-bed/2.0-bath other listed at $196k.
Deal economics
- At list price, monthly cash flow is $320 ($4k/yr) — positive.
- The deal already cash-flows at list — no discount required.
- To meet the 1% rule (rent ≥ 1% of price), the offer needs to be $190k (3.1% below list).
- Recommended offer: $184k (6.0% below list) — sets the bar for market timing.
Location & tenants
- Location reads 80/100 on livability (#37 in TX, #1,749 nationally) — a professional / high-income tenant draw. Strengths: commute A+, cost of living A+, housing A+; Watch: employment C-, crime F.
- Lubbock-Cooper ISD (rural): math 54% / reading 52% proficiency, ranked #98 of 826 in TX (top 12%) — acceptable for families but not a draw, mixed tenant base, ~2y average lease.
- Zoned schools: Lubbock-Cooper East El (math 45% / reading 37%, grade F, #1,462 of 4,322 statewide, top 34%, 759 students, 55% FRL); Lubbock-Cooper Middle (math 46% / reading 45%, grade D+, #470 of 1,662 statewide, top 29%, 914 students, 37% FRL); Lubbock-Cooper H S (math 67% / reading 65%, grade B, #189 of 1,632 statewide, top 12%, 2,117 students, 31% FRL).
- Market conditions: Rents rising (+2.1%/yr); 663 active listings in the ZIP; 37 comparable units currently listed for rent nearby; rentals at typical pace (median 21d on market — plan ~3-4 weeks tenant-placement turnaround); solid renter incomes; 2,219 units permitted in Lubbock County in 2024 (252 in 5+ unit buildings).
Forward outlook
- Local home prices are declining (-3.0%/yr); year-one equity from $1k of loan paydown is wiped out by about $6k of value loss. Plan a longer hold.
- Lubbock County population projected at +39% by 2050 — long-run rental-demand tailwind backs the buy-and-hold thesis.
Negotiation context
- It's been on market 76 days — a 6% lower offer ($184k) is reasonable based on typical stale-listing flexibility.
Questions for the listing agent
- It's been on market 76 days. Have you received any prior offers? Is the seller open to a 6% concession, seller financing, or rate buy-down credit?
- What does the HOA fee cover, when was the last increase, and are there any pending special assessments or reserve-fund shortfalls?
- Why hasn't it sold? Are there any deal-killer items the seller is aware of (foundation, flood, title, zoning, code violations)?
- Is there a deadline driving the sale (1031 exchange, divorce, estate, relocation)? That informs how much negotiation room exists.
- Schools are D-rated, which usually means shorter tenancies and higher turnover. Who's the typical renter profile here, and what's been the actual vacancy rate?
- Crime grade is F in this area — have there been break-ins, vandalism, or insurance claims at this property in the last 3 years? What carrier currently insures it and at what premium?
- What's the average days-on-market for RENTAL listings here right now (not sales)? A rising rental-DOM trend means longer vacancies and softer asking-rent achievability than the comps imply.
- What's the recent tenant-quality profile in this submarket — average credit score on applications, eviction rate, late-payment / NSF rate, and stable-employment percentage? A property-management company in the area should have these aggregated.
- How much new for-sale + rental construction is in the pipeline within 1–3 miles? Heavy new supply typically softens prices + rents 12–24 months out; constrained supply supports both.
Investment metrics
- 1% rule
- 0.97% ✗
- Cap rate
- 8.25%
- Cash-on-cash
- 7.00%
- DSCR
- 1.31
- GRM
- 8.6
CMA / ARV
No comps found within radius.
Projected returns pro-forma
-3.0% appreciation · 2.13% rent growth · sell at horizon
- IRR
- -6.5%
- Equity multiple
- 0.76×
- Total profit
- $-13,086
- Equity at exit
- $29,224
- IRR
- 2.1%
- Equity multiple
- 1.14×
- Total profit
- $7,908
- Equity at exit
- $16,946
Cash invested: $54,880 (down + closing). Projections, not guarantees.
Landlord ↔ Tenant lean methodology
- Overall (STATE)
- 87 Strongly Landlord-Friendly
- State Texas
- 87 Strongly Landlord-Friendly · R+5
- County
- — inherits STATE
- City
- — inherits STATE
ZIP-level market 79423
- Rents YoY
- 2.1%
- Active inventory
- 663
- Price-to-rent
- 8.6×
Monthly cashflow live
- Estimated rent
- $1,900 high interval (Pro) →
- Mortgage (P&I)
- −$1,028
- Tax from tax record
- −$42 /mo · $507/yr
- Insurance
- −$82
- HOA
- −$29
- Vacancy / Maint / Mgmt
- −$399
- Net cashflow
- $320
Break-even live
UW: 25.0% down · 7.5% · 30yr · 1.5% tax · 5.0% vac · 8.0% maint · 8.0% mgmt
Financing live
Cash to close
- Down payment
- $49,000
- Closing costs
- $5,880
- Reserves months
- —
- Total cash needed
- —
Loan-product check · same deal, 3 products live
Conventional
25% down · 7.5% · 30yr
- Down + closing
- —
- Monthly P&I
- —
- Monthly cashflow
- —
- DSCR
- —
- Eligible?
- —
Personal DTI + credit; lowest rate.
DSCR
20% down · 8.5% · 30yr
- Down + closing
- —
- Monthly P&I
- —
- Monthly cashflow
- —
- DSCR
- —
- Eligible?
- —
No personal income docs; deal must DSCR.
Hard money
10% down · 12.0% · 12mo
- Down + closing
- —
- Monthly P&I
- —
- Monthly cashflow
- —
- DSCR
- —
- Eligible?
- —
Short-term bridge; refi at stabilization.
Rent comps 37 comps
| Address | Beds | Baths | Sqft | Rent | $/sqft | DOM | Units | Dist |
|---|---|---|---|---|---|---|---|---|
| 3015 138th Pl Lubbock, TX | 3.0 | 2.0 | 1760 | $2,200 | $1.25 | 43d | 1 | 0.04mi |
| 3011 138th Pl Lubbock, TX | 3.0 | 2.0 | 1760 | $2,200 | $1.25 | 43d | 1 | 0.06mi |
| 3011 138th Pl Lubbock, TX | 3.0 | 2.0 | 1760 | $2,200 | $1.25 | 21d | 1 | 0.06mi |
| 3008 139th St Lubbock, TX | 4.0 | 2.0 | 1600 | $2,000 | $1.25 | 21d | 1 | 0.07mi |
| 3016 140th St Lubbock, TX | 3.0 | 2.0 | 1350 | $2,000 | $1.48 | 21d | 1 | 0.08mi |
| 3105 140th St Lubbock, TX | 4.0 | 2.0 | 1700 | $2,150 | $1.26 | 13d | 1 | 0.09mi |
| 3111 140th St Lubbock, TX | 4.0 | 2.0 | 1600 | $2,050 | $1.28 | 43d | 1 | 0.10mi |
| 2745 137th St Lubbock, TX | 3.0 | 2.0 | 1410 | $1,550 | $1.10 | 21d | 1 | 0.34mi |
| 2739 137th St Lubbock, TX | 3.0 | 2.0 | 1418 | $1,600 | $1.13 | 43d | 1 | 0.35mi |
| 2903 134th St Lubbock, TX | 4.0 | 2.0 | 1873 | $2,300 | $1.23 | 21d | 1 | 0.38mi |
| 2713 138th St Lubbock, TX | 4.0 | 2.0 | 1650 | $2,100 | $1.27 | 21d | 1 | 0.39mi |
| 13510 Indiana Ave Lubbock, TX | 1.0–2.0 | 1.5–2.5 | 895 | $1,275 | $1.42 | 13d | 8 | 0.48mi |
| 2550 137th St Lubbock, TX | 3.0 | 2.5 | 1732 | $1,795 | $1.04 | 13d | 1 | 0.50mi |
| 2540 138th St Lubbock, TX | 2.0 | 2.0 | 1328 | $1,425 | $1.07 | 13d | 1 | 0.51mi |
| 2626 136th St Lubbock, TX | 2.0 | 2.0 | 1238 | $1,400 | $1.13 | 43d | 1 | 0.52mi |
| 2627 135th St Lubbock, TX | 3.0 | 2.0 | 1518 | $1,600 | $1.05 | 21d | 1 | 0.52mi |
| 2529 138th St Lubbock, TX | 2.0 | 2.5 | 1249 | $1,400 | $1.12 | 21d | 1 | 0.54mi |
| 2613 136th St Lubbock, TX | 3.0 | 2.0 | 1251 | $1,599 | $1.28 | 21d | 1 | 0.54mi |
| 2611 136th St Lubbock, TX | 2.0 | 2.0 | 1251 | $1,599 | $1.28 | 21d | 1 | 0.54mi |
| 2607 135th St Lubbock, TX | 3.0 | 2.0 | 1518 | $1,500 | $0.99 | 43d | 1 | 0.58mi |
| 2415 144th St Unit 1-2 Lubbock, TX | 3.0 | 2.5 | 1350 | $1,500 | $1.11 | 13d | 1 | 0.73mi |
| 2410 144th St Unit A Lubbock, TX | 3.0 | 2.0 | 1350 | $1,500 | $1.11 | 43d | 1 | 0.76mi |
| 2410 144th St Unit 1-2 Lubbock, TX | 3.0 | 2.0 | 1350 | $1,399 | $1.04 | 43d | 1 | 0.76mi |
| 2309 134th St Lubbock, TX | 3.0 | 2.0 | 1455 | $1,799 | $1.24 | 13d | 1 | 0.77mi |
| 2404 144th St Unit 1-2 Lubbock, TX | 3.0 | 2.0 | 1350 | $1,399 | $1.04 | 43d | 1 | 0.79mi |
| 14408 Avenue X Unit 1-2 Lubbock, TX | 3.0 | 2.5 | 1350 | $1,500 | $1.11 | 13d | 1 | 0.80mi |
| 2308 133rd St Lubbock, TX | 3.0 | 2.0 | 1550 | $1,700 | $1.10 | 43d | 1 | 0.81mi |
| 14413 Avenue X Unit B Lubbock, TX | 3.0 | 2.0 | 1350 | $1,450 | $1.07 | 43d | 1 | 0.84mi |
| 13802 Avenue W Lubbock, TX | 3.0 | 2.0 | 1820 | $1,900 | $1.04 | 13d | 1 | 0.87mi |
| 14102 Avenue V Lubbock, TX | 3.0 | 2.0 | 1450 | $1,500 | $1.03 | 21d | 1 | 0.99mi |
| 2217 150th Pl Lubbock, TX | 4.0 | 2.0 | 1773 | $2,150 | $1.21 | 13d | 1 | 1.12mi |
| 13808 Sherman Ave Lubbock, TX | 3.0 | 2.0 | 1450 | $1,650 | $1.14 | 43d | 1 | 1.27mi |
| 13218 Sherman Ave Lubbock, TX | 4.0 | 2.0 | 1700 | $2,000 | $1.18 | 43d | 1 | 1.32mi |
| 13213 Sherman Ave Lubbock, TX | 4.0 | 2.0 | 1700 | $1,950 | $1.15 | 13d | 1 | 1.34mi |
| 13212 Avenue S Lubbock, TX | 3.0 | 2.0 | 1450 | $1,699 | $1.17 | 21d | 1 | 1.37mi |
| 13212 Avenue R Lubbock, TX | 3.0 | 2.0 | 1450 | $1,625 | $1.12 | 13d | 1 | 1.43mi |
| 1705 141st St Lubbock, TX | 3.0 | 2.0 | 1450 | $1,795 | $1.24 | 21d | 1 | 1.49mi |
HOA detail
- Monthly dues
- $29 · $348/yr
Listing history 5 events
-
2026-03-30status Pending
-
2026-03-27price $196,000
-
2026-03-06price $199,000
-
2026-01-17price $205,000
-
2026-01-13$213,000 Active
ⓘ Source: listings_history table (triggers on properties + properties_extension) + one-shot
backfill from property_details.listing_events for pre-trigger history.
Tax reassessment forecast TX · Resets to sale price
- Current annual tax
- $507 · $42/mo
- Projected year-2 tax
- $3,587 · $299/mo
- Expected delta
- +$3,080/yr (+$257/mo · 607.5%)
ⓘ Screening estimate from a state-policy table — verify with the county assessor before closing.
Nearby sold comps map
Loading sold comps map…
Walkable amenities ~0.75 mi
Loading nearby amenities…
Taxation est. · year 1
- Rental income
- $22,801
- − Mortgage interest
- −$10,979
- − Property taxes
- −$507
- − Insurance
- −$980
- − Repairs & maintenance
- −$1,824
- − Management
- −$1,824
- − HOA
- −$348
- − Depreciation
- −$5,702
- Taxable income
- $637
- Est. tax owed @ 24.0%
- −$153
- After-tax cash flow
- $3,691/yr
For passive investors: Depreciation is non-cash, so a rental often shows a tax loss while cash-flowing — sheltering income. Rental losses are passive: they offset passive income freely, and up to $25,000/yr can offset ordinary (W-2) income if you actively participate and your MAGI is under $100k (phasing out to $0 by $150k); unused losses carry forward. On sale, claimed depreciation is recaptured at up to 25%, and gains may owe capital-gains tax (a 1031 exchange can defer both). Figures are a year-1 estimate at your 24.0% rate — not tax advice; consult a CPA.
Schools (NCES district)
- District
- Lubbock-Cooper ISD
- NCES district ID
- 4815180
- Math proficiency
- 54% ▼ -7.00%
- Reading proficiency
- 52% ▼ -3.00%
- Median HH income
- $77,347
- Composite
- 47.9/100
- National rank
- #2214
- State rank
- #98 of 826 in TX
Livability — Lubbock
- Score
- 80/100
- State rank
- #37
- US rank
- #1749
Category grades
Schools grade is shown separately in the Schools card above.
Census & demographics
- Census place
- Lubbock, TX
- County
- Lubbock County · 293,542 people
- City population
- 283,030
- Metro
- Lubbock, TX
- Population (ZIP)
- 46,998
- Household income
- $84,933
- Rent vs Own
- Severe rent burden
- 1385.0
Population outlook (Lubbock County) Hauer SSP2
- Today (2025)
- 345,960 people
- By 2030
- 371,449 · +7.4%
- By 2040
- 424,539 · +22.7%
- By 2050
- 481,150 · +39.1%
- By 2075
- 633,467 · +83.1%
- By 2100
- 746,853 · +115.9%
Race, ethnicity, and origin ACS 2023
- Neighborhood character
- Majority White (61%)
- Race & ethnicity
- White 61% Hispanic / Latino 31% Two or more races 15% Black 4% Asian 2%
- Hispanic origin (detail)
- Mexican 26%
- Common ancestry
- Slovak 1% Italian 1% Serbian 1%
- Foreign-born
- 5% · Canada
- Languages at home
- 84% English-only · Spanish 13% Tagalog/Filipino 1% Other Asian/Pacific 1%
Political lean MEDSL · Lubbock
- 2024 margin
- Solid R (+39.5) · D 29.7% · R 69.2% · Other 1.0%
- 2008→2024 swing
- -2.8pp toward R · 2008: -36.7pp · 2024: -39.5pp
- All cycles
- 2024: R+39.5 2020: R+32.2 2016: R+38.4 2012: R+40.9 2008: R+36.7
Not yet ingested
- Civics
- —
Market trends
- HPI YoY
- ▼ -155.00%
- Current HPI
- 213.6491
- Rent YoY
- ▲ 2.13%
- Metro
- Lubbock, TX
- State GDP YoY
- ▲ 3.95%
- F500 in state
- 110
Industry mix (Fortune 500 HQ in TX)
| Industry | F500 HQs | Revenue |
|---|---|---|
| Energy | 16 | $1,198B |
|
||
| Technology | 5 | $198B |
|
||
| Engineering / Construction | 4 | $72B |
|
||
| Energy Services | 3 | $60B |
|
||
| Utilities | 3 | $41B |
|
||
| Healthcare | 2 | $330B |
|
||
Price history
-8.0% since first listed5 events — show timeline
- 2026-03-30 Pending — LARMLS
- 2026-03-27 Price Changed $196,000 LARMLS
- 2026-03-06 Price Changed $199,000 LARMLS
- 2026-01-17 Price Changed $205,000 LARMLS
- 2026-01-13 Listed $213,000 LARMLS
Cash-flow waterfall
monthlySold comps — $/sqft
last 12 mo · ≤1 miLoading sold comps…