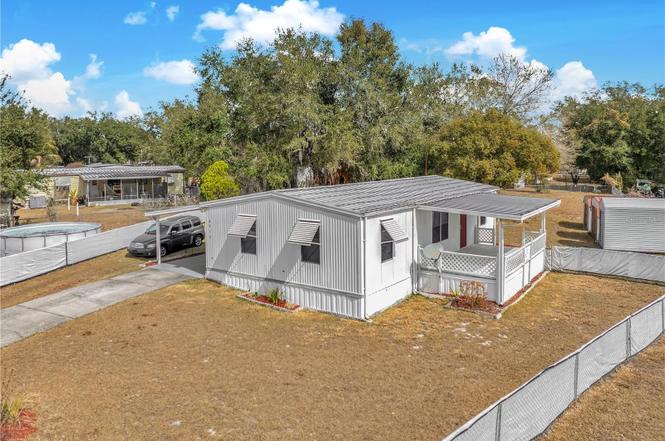
8913 Jericho Ct · Polk City, FL
Flood risk 1/10 · Minimal
- FEMA flood zone
- X (unshaded)
- Chance of flooding over 30 yrs
- 0.0%
- Est. flood insurance / yr
- $507 – $1,088
Fire risk 6/10 · Moderate
- Est. fire insurance / yr
- $947 – $1,759
Heat risk 8/10 · Major
- Hot days now (above 107°F)
- 7 days/yr
- Hot days in 30 yrs
- 23 days/yr
Wind risk 9/10 · Severe
- Chance of severe wind over 30 yrs
- 99.0%
Air-quality risk 1/10 · Minimal
- Unhealthy air days now
- 0 days/yr
- Unhealthy air days in 30 yrs
- 0 days/yr
Risk factors via First Street. Map © Google.
Why this score? — see what drove the C grade
The composite is a weighted blend of 9 inputs, each scored 0–100. Each bar is that input's sub-score; the figure is the points it added to the 100-point composite (weight × sub-score).
- Cash flow +23.9/30.0
- DSCR +7.7/10.0
- ARV discount +7.5/15.0
- 1% rule +5.3/10.0
- Schools +3.5/10.0
- Livability +3.4/5.0
- Rent growth +2.5/5.0
- Condition / age +2.5/5.0
- Appreciation +0.0/10.0
$169,000
🖨 Deal sheet (PDF) 📄 Offer letter ✓ Due diligence
Listing remarks
New improved price! Welcome home to this cozy 3-bedroom, 2 bath, 1032 sq. ft. , double wide manufactured home nestled at the end of a quiet cul-de-sac in Mount Olive Heights Community of Polk City. Situated on a . 3-acre lot with no HOA this property offers privacy and flexibility. Built in 1984 this home offers a comfortable split floorplan with newer counter tops in the kitchen and an inside laundry room for convenience. Enjoy outdoor living with a 20'-10' covered front porch and a spacious 29'x12 screened in back patio perfect for relaxing or entertaining. Additional highlights include a carport, 3 storage sheds, expansive fenced in yard perfect for your pets and a newly installed vapor
Key facts
- Covered front porch
- Quiet cul-de-sac
- Split floorplan
Tags
Property features AI
Finance
- Other: Homestead exempt; Zoned PUD
- HOA & community: Pets allowed
Exterior
- Parking: Carport (1 space)
- Utilities: Public water; Public sewer; Electricity connected; Sewer connected
- Home design: Manufactured double-wide home; Single-story; Southeast-facing; Double wide Fleetwood model 3443B
- Construction: Metal siding; Roof over; Crawlspace foundation; Built as a manufactured home
- Exterior features: Covered, screened front porch; Porch; Outdoor lighting; Private mailbox; Chain link fence; Shed(s); Trees and landscaped yard; Cleared lot; Cul-de-sac location; Paved road
Interior
- Kitchen: Range; Range hood; Refrigerator
- Bedrooms: 3 bedrooms
- Flooring: Carpet; Vinyl
- Bathrooms: 2 full bathrooms
- Heating & cooling: Other heating; Other cooling
- Interior features: Ceiling fans; Living room and dining room combo; Blinds on windows
- Laundry & utility: Inside laundry (washer and dryer included); Inside utility room
Neighborhood map
What this means for you Summary
Snapshot
- This is a 3-bed/2.0-bath manufactured listed at $169k.
Deal economics
- At list price, monthly cash flow is $329 ($4k/yr) — positive.
- The deal already cash-flows at list — no discount required.
- Meets the 1% rule at list price ($2k rent vs $169k).
- Recommended offer: $154k (9.0% below list) — sets the bar for market timing.
Location & tenants
- Location reads 68/100 on livability (#501 in FL) — a middle-class / working-renter tenant base. Strengths: crime A+, cost of living A+, housing A+; Watch: amenities F, commute F, health & safety D-.
- Polk (suburban): math 39% / reading 43% proficiency, ranked #62 of 73 in FL (top 85%) — families likely to look elsewhere, expect single-tenant / working-renter base with shorter leases.
- Zoned schools: Polk City Elementary School (math 42% / reading 41%, grade F, #1,437 of 2,144 statewide, top 68%, 606 students, 58% FRL) — zoned schools at 58% FRL track the district average.
- Market conditions: 422 active listings in the ZIP; 2 comparable units currently listed for rent nearby; 10,384 units permitted in Polk County in 2024 (1,716 in 5+ unit buildings).
Forward outlook
- Local home prices are declining (-3.0%/yr); year-one equity from $1k of loan paydown is wiped out by about $5k of value loss. Plan a longer hold.
- Polk County population projected at +33% by 2050 — long-run rental-demand tailwind backs the buy-and-hold thesis.
Negotiation context
- It's been on market 113 days — a 9% lower offer ($154k) is reasonable based on typical stale-listing flexibility.
- 2 sale attempts; this cycle's ask has dropped $10k (6%) from the opening price — seller is motivated, your offer sets the floor, not the list.
- Current owner paid $8k; list at $169k implies a 2012% gain — meaningful room to come down on a strong offer.
Risks & watch-outs
- Climate carrying-cost: severe wind risk, 99% chance of damaging wind over 30y; major wildfire risk; extreme-heat days projected 7→23/yr by 2055 (HVAC capex compounding) — expect insurance premiums to compound above CPI over the hold.
Questions for the listing agent
- It's been on market 113 days. Have you received any prior offers? Is the seller open to a 9% concession, seller financing, or rate buy-down credit?
- Why hasn't it sold? Are there any deal-killer items the seller is aware of (foundation, flood, title, zoning, code violations)?
- Is there a deadline driving the sale (1031 exchange, divorce, estate, relocation)? That informs how much negotiation room exists.
- Schools are D-rated, which usually means shorter tenancies and higher turnover. Who's the typical renter profile here, and what's been the actual vacancy rate?
- What's the average days-on-market for RENTAL listings here right now (not sales)? A rising rental-DOM trend means longer vacancies and softer asking-rent achievability than the comps imply.
- What's the recent tenant-quality profile in this submarket — average credit score on applications, eviction rate, late-payment / NSF rate, and stable-employment percentage? A property-management company in the area should have these aggregated.
- How much new for-sale + rental construction is in the pipeline within 1–3 miles? Heavy new supply typically softens prices + rents 12–24 months out; constrained supply supports both.
Investment metrics
- 1% rule
- 1.03% ✓
- Cap rate
- 8.63%
- Cash-on-cash
- 8.33%
- DSCR
- 1.37
- GRM
- 8.1
CMA / ARV
No comps found within radius.
Projected returns pro-forma
-3.0% appreciation · 3.0% rent growth · sell at horizon
- IRR
- -3.7%
- Equity multiple
- 0.86×
- Total profit
- $-6,502
- Equity at exit
- $25,198
- IRR
- 6.0%
- Equity multiple
- 1.45×
- Total profit
- $21,097
- Equity at exit
- $14,612
Cash invested: $47,320 (down + closing). Projections, not guarantees.
Landlord ↔ Tenant lean methodology
- Overall (STATE)
- 87 Strongly Landlord-Friendly
- State Florida
- 87 Strongly Landlord-Friendly · R+3
- County
- — inherits STATE
- City
- — inherits STATE
ZIP-level market 33868
- Home prices YoY
- -9.3%
- Active inventory
- 422
- Price-to-rent
- 8.1×
Monthly cashflow live
- Estimated rent
- $1,742 medium interval (Pro) →
- Mortgage (P&I)
- −$886
- Tax from tax record
- −$91 /mo · $1,092/yr
- Insurance
- −$70
- HOA
- −$0
- Vacancy / Maint / Mgmt
- −$366
- Net cashflow
- $329
Break-even live
Sensitivity live
| Price | -10% $424 | -5% $376 | +0% $329 | +5% $281 | +10% $233 |
|---|---|---|---|---|---|
| Rent | -10% $191 | -5% $260 | +0% $329 | +5% $397 | +10% $466 |
| Rate | -1.0pp $414 | -0.5pp $372 | base $329 | +0.5pp $285 | +1.0pp $240 |
UW: 25.0% down · 7.5% · 30yr · 1.5% tax · 5.0% vac · 8.0% maint · 8.0% mgmt
Financing live
Cash to close
- Down payment
- $42,250
- Closing costs
- $5,070
- Reserves months
- —
- Total cash needed
- —
Loan-product check · same deal, 3 products live
Conventional
25% down · 7.5% · 30yr
- Down + closing
- —
- Monthly P&I
- —
- Monthly cashflow
- —
- DSCR
- —
- Eligible?
- —
Personal DTI + credit; lowest rate.
DSCR
20% down · 8.5% · 30yr
- Down + closing
- —
- Monthly P&I
- —
- Monthly cashflow
- —
- DSCR
- —
- Eligible?
- —
No personal income docs; deal must DSCR.
Hard money
10% down · 12.0% · 12mo
- Down + closing
- —
- Monthly P&I
- —
- Monthly cashflow
- —
- DSCR
- —
- Eligible?
- —
Short-term bridge; refi at stabilization.
Rent comps 2 comps
| Address | Beds | Baths | Sqft | Rent | $/sqft | DOM | Units | Dist |
|---|---|---|---|---|---|---|---|---|
| 5760 Viburnum Ct Polk City, FL | 4.0 | 2.0 | 1425 | $1,700 | $1.19 | 24d | 1 | 0.50mi |
| 349 Honey Bee Ln Polk City, FL | 3.0 | 2.0 | 1325 | $1,850 | $1.40 | 24d | 1 | 1.37mi |
Listing history 19 events
-
2026-06-18days on market $169,000 Active 113 DOM
-
2026-06-17price $169,000 Active 112 DOM
-
2026-06-17days on market $175,000 Active 112 DOM
-
2026-06-16days on market $175,000 Active 111 DOM
-
2026-06-15days on market $175,000 Active 110 DOM
-
2026-06-13days on market $175,000 Active 108 DOM
-
2026-06-10days on market $175,000 Active 105 DOM
-
2026-06-09days on market $175,000 Active 104 DOM
-
2026-06-08days on market $175,000 Active 103 DOM
-
2026-06-07days on market $175,000 Active 102 DOM
-
2026-06-05days on market $175,000 Active 99 DOM
-
2026-06-03days on market $175,000 Active 97 DOM
-
2026-06-01days on market $175,000 Active 96 DOM
-
2026-05-31days on market $175,000 Active 95 DOM
-
2026-05-09status Active
-
2026-04-27status Pending
-
2026-03-18price $175,000
-
2026-02-13$179,000 Active
-
1984-02-01soldstatus $8,000
ⓘ Source: listings_history table (triggers on properties + properties_extension) + one-shot
backfill from property_details.listing_events for pre-trigger history.
Tax reassessment forecast FL · Resets to sale price
- Current annual tax
- $1,092 · $91/mo
- Projected year-2 tax
- $1,403 · $117/mo
- Expected delta
- +$311/yr (+$26/mo · 28.4%)
ⓘ Screening estimate from a state-policy table — verify with the county assessor before closing.
Climate risk First Street
- Flood 1/10 Low FEMA zone X (unshaded) · 0% chance over 30 yrs
- Wildfire 6/10 Major
- Heat 8/10 Severe 7 d/yr ≥107°F today · 23 d/yr by 30 yrs out
- Wind 9/10 Extreme 99% chance of damaging wind over 30 yrs
- Air quality 1/10 Low 0 unhealthy d/yr today · 0 by 30 yrs out
Nearby sold comps map
Loading sold comps map…
Walkable amenities ~0.75 mi
Loading nearby amenities…
Taxation est. · year 1
- Rental income
- $20,906
- − Mortgage interest
- −$9,467
- − Property taxes
- −$1,092
- − Insurance
- −$845
- − Repairs & maintenance
- −$1,672
- − Management
- −$1,672
- − Depreciation
- −$4,916
- Taxable income
- $1,241
- Est. tax owed @ 24.0%
- −$298
- After-tax cash flow
- $3,646/yr
For passive investors: Depreciation is non-cash, so a rental often shows a tax loss while cash-flowing — sheltering income. Rental losses are passive: they offset passive income freely, and up to $25,000/yr can offset ordinary (W-2) income if you actively participate and your MAGI is under $100k (phasing out to $0 by $150k); unused losses carry forward. On sale, claimed depreciation is recaptured at up to 25%, and gains may owe capital-gains tax (a 1031 exchange can defer both). Figures are a year-1 estimate at your 24.0% rate — not tax advice; consult a CPA.
Schools (NCES district)
- District
- Polk
- NCES district ID
- 1201590
- Math proficiency
- 39% ▼ -11.00%
- Reading proficiency
- 43% ▼ -4.00%
- Median HH income
- $43,979
- Composite
- 34.74/100
- National rank
- #5132
- State rank
- #62 of 73 in FL
Livability — Polk City
- Score
- 68/100
- State rank
- #501
- US rank
- #9243
Category grades
Schools grade is shown separately in the Schools card above.
Census & demographics
- Population (ZIP)
- 13,676
Population outlook (Polk County) Hauer SSP2
- Today (2025)
- 752,975 people
- By 2030
- 804,621 · +6.9%
- By 2040
- 906,117 · +20.3%
- By 2050
- 1,000,476 · +32.9%
- By 2075
- 1,197,520 · +59.0%
- By 2100
- 1,271,518 · +68.9%
Race, ethnicity, and origin ACS 2023
- Neighborhood character
- Predominantly White (66%)
- Race & ethnicity
- White 66% Hispanic / Latino 22% Two or more races 14% Black 6%
- Hispanic origin (detail)
- Mexican 6% Puerto Rican 11% Dominican 2%
- Common ancestry
- Lithuanian 1% Italian 1% Slovak 1%
- Foreign-born
- 6% · Canada
- Languages at home
- 80% English-only · Spanish 17% Other Indo-European 1%
Political lean MEDSL · Polk
- 2024 margin
- Strong R (+20.7) · D 39.2% · R 59.9%
- 2008→2024 swing
- -14.6pp toward R · 2008: -6.1pp · 2024: -20.7pp
- All cycles
- 2024: R+20.7 2020: R+14.4 2016: R+14.1 2012: R+6.8 2008: R+6.1
Not yet ingested
- Civics
- —
Market trends
- HPI YoY
- ▼ -33.52%
- Current HPI
- 325.6917
- Rent YoY
- —
- Metro
- —
- State GDP YoY
- ▲ 3.28%
- F500 in state
- 36
Industry mix (Fortune 500 HQ in FL)
| Industry | F500 HQs | Revenue |
|---|---|---|
| Industrial Technology | 2 | $29B |
|
||
| Insurance | 2 | $17B |
|
||
| Retail | 1 | $60B |
|
||
| Technology Distribution | 1 | $58B |
|
||
| Homebuilding | 1 | $35B |
|
||
| Technology Manufacturing | 1 | $35B |
|
||
Price history
+2087.5% since first listed5 events — show timeline
- 2026-05-09 Relisted — Stellar MLS as Distributed by MLS Grid
- 2026-04-27 Pending — Stellar MLS as Distributed by MLS Grid
- 2026-03-18 Price Changed $175,000 Stellar MLS as Distributed by MLS Grid
- 2026-02-13 Listed $179,000 Stellar MLS as Distributed by MLS Grid
- 1984-02-01 Sold (Public Records) $8,000 Public Records
Property tax history
+14.2%/yrLatest (2025): $1,092 · +13.4% YoY. Source: county tax records.
Cash-flow waterfall
monthlySold comps — $/sqft
last 12 mo · ≤1 miLoading sold comps…