 🏷️ Likely Rental
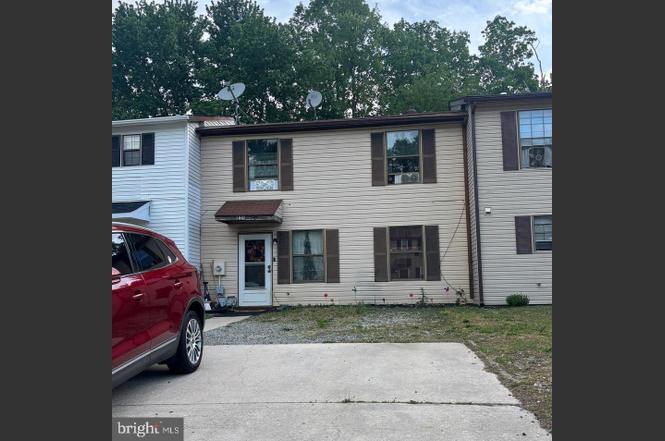
135 Hampshire Rd · Sicklerville, NJ
Flood risk 1/10 · Minimal
- FEMA flood zone
- X (unshaded)
- Chance of flooding over 30 yrs
- 0.0%
- Est. flood insurance / yr
- $507 – $1,088
Fire risk 2/10 · Minimal
- Est. fire insurance / yr
- $526 – $976
Heat risk 7/10 · Major
- Hot days now (above 103°F)
- 7 days/yr
- Hot days in 30 yrs
- 15 days/yr
Wind risk 6/10 · Moderate
- Chance of severe wind over 30 yrs
- 62.0%
Air-quality risk 3/10 · Minor
- Unhealthy air days now
- 3 days/yr
- Unhealthy air days in 30 yrs
- 3 days/yr
Risk factors via First Street. Map © Google.
Why this score? — see what drove the C+ grade
The composite is a weighted blend of 9 inputs, each scored 0–100. Each bar is that input's sub-score; the figure is the points it added to the 100-point composite (weight × sub-score).
- Cash flow +24.9/30.0
- ARV discount +15.0/15.0
- DSCR +8.1/10.0
- 1% rule +6.0/10.0
- Rent growth +3.4/5.0
- Schools +2.6/10.0
- Livability +2.5/5.0
- Condition / age +2.5/5.0
- Appreciation +0.0/10.0
$205,000
🖨 Deal sheet 📄 Offer letter ✓ Due diligence
Listing remarks
This 2-bedroom, 1-bath townhome offers an exciting opportunity for both investors and owner-occupants in a highly convenient location near Route 42 and the Atlantic City Expressway—making commuting and travel effortless. Just minutes from the shopping, dining, and everyday essentials along Cross Keys Road, this home delivers convenience where it matters most. Featuring two private off-street parking spaces, both front and back yard space, and close proximity to schools including Camden County College, the layout offers flexibility and value. Currently tenant occupied, with the tenant open to remaining for an investor purchase and notified to vacate for a residential buyer, the propert
Key facts
- Built 1979
- Listed 154 days
Tags
Property features AI
Exterior
- Parking: Driveway
- Utilities: Public water; Public sewer; Electric hot water
- Home design: Interior townhouse/rowhouse; Fee simple ownership; Estimated year built
- Construction: Frame construction with vinyl siding; Slab foundation; Other structures listed above and below grade
- Exterior features: Lot roughly 25 x 100 feet; No tidal water
Interior
- Bedrooms: 2 bedrooms on the main level
- Bathrooms: 1 full bathroom (main level)
- Heating & cooling: Electric baseboard heating; Window air conditioning units (electric)
- Interior features: Estimated living area; No basement
Neighborhood map
What this means for you Summary
Snapshot
- This is a 2-bed/1.0-bath single-family listed at $205k.
Deal economics
- At list price, monthly cash flow is $438 ($5k/yr) — positive.
- The deal already cash-flows at list — no discount required.
- Meets the 1% rule at list price ($2k rent vs $205k).
- Recommended offer: $180k (12.0% below list) — sets the bar for market timing.
- Cap rate 8.9% vs local median 4.7% in Sicklerville — top-decile yield for the area; either an underpriced asset or a hidden risk that comps aren't pricing in. Stress-test before assuming the spread holds.
Location & tenants
- Location reads: area grade C — affects rentability + tenant quality, not the cash-flow math above.
- Gloucester Township Public Schools (suburban): math 14% / reading 41% proficiency, ranked #351 of 472 in NJ (top 74%) — low school quality limits family demand, transient renter base, plan for 1-2y turnover.
- Market conditions: Rents rising (+3.4%/yr); 329 active listings in the ZIP; 11 comparable units currently listed for rent nearby; rentals leasing fast (median 1d on market — plan ~1-2 weeks tenant-placement turnaround); solid renter incomes; 1,018 units permitted in Camden County in 2024 (509 in 5+ unit buildings).
Forward outlook
- Local home prices are declining (-3.0%/yr); year-one equity from $1k of loan paydown is wiped out by about $6k of value loss. Plan a longer hold.
- Camden County population projected to shrink 8% by 2050 — rents likely to lag national; underwrite the cash flow, not the appreciation.
Negotiation context
- It's been on market 154 days — a 12% lower offer ($180k) is reasonable based on typical stale-listing flexibility.
- 10 sale attempts since 28y ago with the ask held roughly flat each time — persistent listings suggest the price (not the market) is what's stuck; bring a comps-based counter.
- Current owner paid $34k; list at $205k implies a 501% gain — meaningful room to come down on a strong offer.
Risks & watch-outs
- Climate carrying-cost: major wind risk, 62% chance of damaging wind over 30y; extreme-heat days projected 7→15/yr by 2055 (HVAC capex compounding) — expect insurance premiums to compound above CPI over the hold.
Questions for the listing agent
- It's been on market 154 days. Have you received any prior offers? Is the seller open to a 12% concession, seller financing, or rate buy-down credit?
- Built in 1979 — when were the roof, HVAC, electrical panel, plumbing, and water heater last replaced?
- Why hasn't it sold? Are there any deal-killer items the seller is aware of (foundation, flood, title, zoning, code violations)?
- Is there a deadline driving the sale (1031 exchange, divorce, estate, relocation)? That informs how much negotiation room exists.
- What's the average days-on-market for RENTAL listings here right now (not sales)? A rising rental-DOM trend means longer vacancies and softer asking-rent achievability than the comps imply.
- What's the recent tenant-quality profile in this submarket — average credit score on applications, eviction rate, late-payment / NSF rate, and stable-employment percentage? A property-management company in the area should have these aggregated.
- How much new for-sale + rental construction is in the pipeline within 1–3 miles? Heavy new supply typically softens prices + rents 12–24 months out; constrained supply supports both.
Investment metrics
- 1% rule
- 1.10% ✓
- Cap rate
- 8.86%
- Cash-on-cash
- 9.16%
- DSCR
- 1.41
- GRM
- 7.6
CMA / ARV
- ARV (on-the-fly)
- $301,350
- Comps found
- 4
Show comp detail 4 sales within ~0.75 mi
| Address | Dist | Beds/Ba | Sqft | Sold | Price | $/sf | Match |
|---|---|---|---|---|---|---|---|
| 1 Renee Ct | 0.46mi | 3/1.0 (+1) | 1,096 (+4%) | 7mo | $315,000 | $287 | 60 |
| 73 Girard Ave | 0.73mi | 3/1.0 (+1) | 1,008 (-4%) | 3mo | $299,999 | $298 | 52 |
| 1974 Pine St | 0.56mi | 3/1.0 (+1) | 1,008 (-4%) | 18mo | $274,000 | $272 | 47 |
| 87 Morgan St | 0.66mi | 3/1.0 (+1) | 1,040 (-1%) | 20mo | $285,000 | $274 | 46 |
Match score weights: distance 35% · size 25% · config 20% · recency 20%. Top-matched comps best support the ARV.
Projected returns pro-forma
-3.0% appreciation · 3.41% rent growth · sell at horizon
- IRR
- -2.0%
- Equity multiple
- 0.92×
- Total profit
- $-4,388
- Equity at exit
- $30,566
- IRR
- 8.1%
- Equity multiple
- 1.63×
- Total profit
- $35,953
- Equity at exit
- $17,725
Cash invested: $57,400 (down + closing). Projections, not guarantees.
Landlord ↔ Tenant lean methodology
- Overall (STATE)
- 21 Tenant-Leaning
- State New Jersey
- 21 Tenant-Leaning · D+6
- County
- — inherits STATE
- City
- — inherits STATE
ZIP-level market 08081
- Rents YoY
- 3.4%
- Active inventory
- 329
- Price-to-rent
- 7.6×
Monthly cashflow live
- Estimated rent
- $2,262 high interval (Pro) →
- Mortgage (P&I)
- −$1,075
- Tax from tax record
- −$188 /mo · $2,262/yr
- Insurance
- −$85
- HOA
- −$0
- Vacancy / Maint / Mgmt
- −$475
- Net cashflow
- $438
Break-even live
UW: 25.0% down · 7.5% · 30yr · 1.5% tax · 5.0% vac · 8.0% maint · 8.0% mgmt
Financing live
Cash to close
- Down payment
- $51,250
- Closing costs
- $6,150
- Reserves months
- —
- Total cash needed
- —
Loan-product check · same deal, 3 products live
Conventional
25% down · 7.5% · 30yr
- Down + closing
- —
- Monthly P&I
- —
- Monthly cashflow
- —
- DSCR
- —
- Eligible?
- —
Personal DTI + credit; lowest rate.
DSCR
20% down · 8.5% · 30yr
- Down + closing
- —
- Monthly P&I
- —
- Monthly cashflow
- —
- DSCR
- —
- Eligible?
- —
No personal income docs; deal must DSCR.
Hard money
10% down · 12.0% · 12mo
- Down + closing
- —
- Monthly P&I
- —
- Monthly cashflow
- —
- DSCR
- —
- Eligible?
- —
Short-term bridge; refi at stabilization.
Rent comps 11 comps
| Address | Beds | Baths | Sqft | Rent | $/sqft | DOM | Units | Dist |
|---|---|---|---|---|---|---|---|---|
| 79 Edinshire Rd Sicklerville, NJ | 3.0 | 1.0 | 1050 | $2,500 | $2.38 | 15d | 1 | 0.09mi |
| 37 Berkshire Rd Sicklerville, NJ | 2.0 | 1.0 | 1050 | $1,900 | $1.81 | 1d | 1 | 0.29mi |
| 478 Jarvis Rd Sicklerville, NJ | 3.0 | 1.0 | 1000 | $2,150 | $2.15 | 1d | 1 | 0.30mi |
| 785 Jarvis Rd Unit B Sicklerville, NJ | 2.0 | 1.0 | 1000 | $1,900 | $1.90 | 1d | 1 | 0.62mi |
| 55 Presidential Dr Sicklerville, NJ | 3.0 | 1.5 | 1332 | $2,500 | $1.88 | 3d | 1 | 0.76mi |
| 126 Presidential Dr Unit 1 Sicklerville, NJ | 2.0 | 1.0 | 1056 | $1,500 | $1.42 | 16d | 1 | 0.79mi |
| 30 Girard Ave Sicklerville, NJ | 3.0 | 1.0 | 1008 | $2,349 | $2.33 | 24d | 1 | 0.86mi |
| 30 Girard Ave Sicklerville, NJ | 3.0 | 1.0 | 1008 | $2,349 | $2.33 | 16d | 1 | 0.86mi |
| 33 Cottage Gate Rd Unit B Sicklerville, NJ | 2.0 | 1.0 | 1200 | $1,790 | $1.49 | 1d | 1 | 0.90mi |
| 423 Sonora Ln Sicklerville, NJ | 2.0 | 1.5 | 1292 | $2,400 | $1.86 | 1d | 1 | 1.26mi |
| 2403 Beacon Hill Dr Sicklerville, NJ | 2.0 | 2.5 | 1248 | $2,650 | $2.12 | 1d | 1 | 1.48mi |
Listing history 44 events
-
2026-06-18days on market $205,000 Active 154 DOM
-
2026-06-17days on market $205,000 Active 153 DOM
-
2026-06-16days on market $205,000 Active 152 DOM
-
2026-06-15days on market $205,000 Active 151 DOM
-
2026-06-13days on market $205,000 Active 149 DOM
-
2026-06-13days on market $205,000 Active 148 DOM
-
2026-06-09days on market $205,000 Active 145 DOM
-
2026-06-08days on market $205,000 Active 144 DOM
-
2026-06-07days on market $205,000 Active 143 DOM
-
2026-06-04days on market $205,000 Active 140 DOM
-
2026-06-03days on market $205,000 Active 139 DOM
-
2026-06-02days on market $205,000 Active 138 DOM
-
2026-06-01days on market $205,000 Active 137 DOM
-
2026-05-31days on market $205,000 Active 136 DOM
-
2026-01-15$205,000 Active
-
2026-01-15historical
-
2025-09-30$209,000 Active
-
2025-09-29historical
-
2025-09-22price $209,000
-
2025-05-06$215,000 Active
-
2015-05-15soldstatus $34,100 Sold
-
2015-05-15soldstatus $34,100
-
2015-05-04status Under Contract
-
2015-04-30historical
-
2015-03-17price $34,900
-
2015-02-11$40,800 Active
-
2015-02-11$34,900
-
2013-10-03historical
-
2012-12-20$40,000
-
2012-11-25historical
-
2011-11-25$40,000
-
2004-01-22soldstatus $43,109
-
2003-11-19historical
-
2003-06-26$43,109
-
1999-11-10soldstatus $45,000
-
1999-10-11soldstatus $45,000
-
1999-09-14historical
-
1999-05-05$45,000
-
1999-04-05soldstatus $16,500
-
1999-02-25soldstatus $16,500
-
1999-02-04historical
-
1998-10-08$16,500
-
1990-07-13soldstatus $56,000
-
1987-06-19soldstatus $46,200
ⓘ Source: listings_history table (triggers on properties + properties_extension) + one-shot
backfill from property_details.listing_events for pre-trigger history.
Tax reassessment forecast NJ · Partial reset (capped growth)
- Current annual tax
- $2,262 · $188/mo
- Projected year-2 tax
- $3,683 · $307/mo
- Expected delta
- +$1,421/yr (+$118/mo · 62.8%)
ⓘ Screening estimate from a state-policy table — verify with the county assessor before closing.
Climate risk First Street
- Flood 1/10 Low FEMA zone X (unshaded) · 0% chance over 30 yrs
- Wildfire 2/10 Low
- Heat 7/10 Severe 7 d/yr ≥103°F today · 15 d/yr by 30 yrs out
- Wind 6/10 Major 62% chance of damaging wind over 30 yrs
- Air quality 3/10 Moderate 3 unhealthy d/yr today · 3 by 30 yrs out
Nearby sold comps map
Loading sold comps map…
Walkable amenities ~0.75 mi
Loading nearby amenities…
Taxation est. · year 1
- Rental income
- $27,145
- − Mortgage interest
- −$11,483
- − Property taxes
- −$2,262
- − Insurance
- −$1,025
- − Repairs & maintenance
- −$2,172
- − Management
- −$2,172
- − Depreciation
- −$5,964
- Taxable income
- $2,068
- Est. tax owed @ 24.0%
- −$496
- After-tax cash flow
- $4,761/yr
For passive investors: Depreciation is non-cash, so a rental often shows a tax loss while cash-flowing — sheltering income. Rental losses are passive: they offset passive income freely, and up to $25,000/yr can offset ordinary (W-2) income if you actively participate and your MAGI is under $100k (phasing out to $0 by $150k); unused losses carry forward. On sale, claimed depreciation is recaptured at up to 25%, and gains may owe capital-gains tax (a 1031 exchange can defer both). Figures are a year-1 estimate at your 24.0% rate — not tax advice; consult a CPA.
Schools (NCES district)
- District
- Gloucester Township Public Schools
- NCES district ID
- 3406030
- Math proficiency
- 14% ▼ -28.00%
- Reading proficiency
- 41% ▼ -13.00%
- Median HH income
- $72,539
- Composite
- 26.18/100
- National rank
- #7269
- State rank
- #351 of 472 in NJ
Livability — Sicklerville
No livability data for this city. (Only ~50 U.S. cities are tracked.)
Census & demographics
- Census place
- Sicklerville, NJ
- County
- Camden County · 407,624 people
- City population
- 50,264
- Metro
- Philadelphia-Camden-Wilmington, PA-NJ-DE-MD
- Population (ZIP)
- 50,264
- Household income
- $105,800
- Rent vs Own
- Severe rent burden
- 979.0
Population outlook (Camden County) Hauer SSP2
- Today (2025)
- 507,964 people
- By 2030
- 502,182 · -1.1%
- By 2040
- 485,602 · -4.4%
- By 2050
- 465,630 · -8.3%
- By 2075
- 419,986 · -17.3%
- By 2100
- 369,492 · -27.3%
Race, ethnicity, and origin ACS 2023
- Neighborhood character
- Diverse neighborhood (Simpson 0.65)
- Race & ethnicity
- White 47% Black 34% Two or more races 9% Hispanic / Latino 9% Asian 4%
- Hispanic origin (detail)
- Puerto Rican 5%
- Common ancestry
- Romanian 6% Slovak 2% Iranian 1%
- Foreign-born
- 8% · Canada, China, South Korea
- Languages at home
- 90% English-only · Spanish 4% Other Indo-European 1% Tagalog/Filipino 1%
Political lean MEDSL · Camden
- 2024 margin
- Strong D (+27.4) · D 63.0% · R 35.5% · Other 1.5%
- 2008→2024 swing
- -8.8pp toward R · 2008: 36.2pp · 2024: 27.4pp
- All cycles
- 2024: D+27.4 2020: D+33.5 2016: D+32.4 2012: D+36.6 2008: D+36.2
Not yet ingested
- Civics
- —
Market trends
- HPI YoY
- ▼ -176.48%
- Current HPI
- 303.1017
- Rent YoY
- ▲ 3.41%
- Metro
- Philadelphia-Camden-Wilmington, PA-NJ-DE-MD
- State GDP YoY
- ▲ 2.05%
- F500 in state
- 34
Industry mix (Fortune 500 HQ in NJ)
| Industry | F500 HQs | Revenue |
|---|---|---|
| Consumer Goods | 3 | $31B |
|
||
| Pharmaceuticals | 2 | $153B |
|
||
| Technology | 2 | $21B |
|
||
| Insurance | 2 | $20B |
|
||
| Healthcare | 2 | $19B |
|
||
| Financial Services | 1 | $70B |
|
||
Price history
+343.7% since first listed30 events — show timeline
- 2026-01-15 Listing Removed — BRIGHT MLS
- 2026-01-15 Listed $205,000 BRIGHT MLS
- 2025-09-30 Listed $209,000 BRIGHT MLS
- 2025-09-29 Listing Removed — BRIGHT MLS
- 2025-09-22 Price Changed $209,000 BRIGHT MLS
- 2025-05-06 Listed $215,000 BRIGHT MLS
- 2015-05-15 Sold (MLS) $34,100 BRIGHT MLS
- 2015-05-15 Sold (MLS) $34,100 TREND
- 2015-05-04 Pending — TREND
- 2015-04-30 Listing Removed — BRIGHT MLS
- 2015-03-17 Price Changed $34,900 TREND
- 2015-02-11 Listed $34,900 BRIGHT MLS
- 2015-02-11 Listed $40,800 TREND
- 2013-10-03 Listing Removed — BRIGHT MLS
- 2012-12-20 Listed $40,000 BRIGHT MLS
- 2012-11-25 Listing Removed — BRIGHT MLS
- 2011-11-25 Listed $40,000 BRIGHT MLS
- 2004-01-22 Sold (MLS) $43,109 BRIGHT MLS
- 2003-11-19 Listing Removed — BRIGHT MLS
- 2003-06-26 Listed $43,109 BRIGHT MLS
- 1999-11-10 Sold (Public Records) $45,000 Public Records
- 1999-10-11 Sold (MLS) $45,000 BRIGHT MLS
- 1999-09-14 Listing Removed — BRIGHT MLS
- 1999-05-05 Listed $45,000 BRIGHT MLS
- 1999-04-05 Sold (Public Records) $16,500 Public Records
- 1999-02-25 Sold (MLS) $16,500 BRIGHT MLS
- 1999-02-04 Listing Removed — BRIGHT MLS
- 1998-10-08 Listed $16,500 BRIGHT MLS
- 1990-07-13 Sold (Public Records) $56,000 Public Records
- 1987-06-19 Sold (Public Records) $46,200 Public Records
Property tax history
-0.7%/yrLatest (2025): $2,262 · +1.9% YoY. Source: county tax records.
Cash-flow waterfall
monthlySold comps — $/sqft
last 12 mo · ≤1 miLoading sold comps…