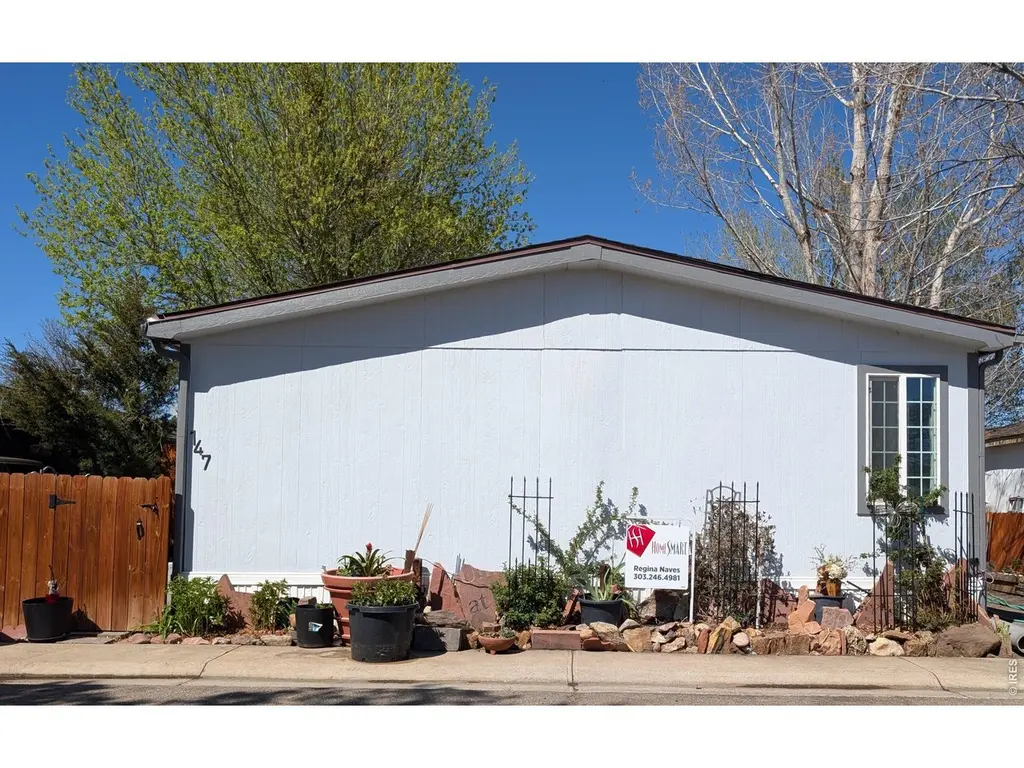
1400 S Collyer St #147 · Longmont, CO
Flood risk 1/10 · Minimal
- FEMA flood zone
- X (unshaded)
- Chance of flooding over 30 yrs
- 0.0%
- Est. flood insurance / yr
- $507 – $1,088
Fire risk 1/10 · Minimal
- Est. fire insurance / yr
- $939 – $1,743
Heat risk 3/10 · Minor
- Hot days now (above 93°F)
- 7 days/yr
- Hot days in 30 yrs
- 19 days/yr
Wind risk 1/10 · Minimal
- Chance of severe wind over 30 yrs
- —
Air-quality risk 6/10 · Moderate
- Unhealthy air days now
- 10 days/yr
- Unhealthy air days in 30 yrs
- 10 days/yr
Risk factors via First Street. Map © Google.
Why this score? — see what drove the C+ grade
The composite is a weighted blend of 9 inputs, each scored 0–100. Each bar is that input's sub-score; the figure is the points it added to the 100-point composite (weight × sub-score).
- Cash flow +30.0/30.0
- 1% rule +10.0/10.0
- DSCR +10.0/10.0
- Livability +3.9/5.0
- Schools +3.8/10.0
- Rent growth +2.7/5.0
- Condition / age +2.5/5.0
- ARV discount +2.1/15.0
- Appreciation +0.0/10.0
$135,000
🖨 Deal sheet (PDF) 📄 Offer letter ✓ Due diligence
Listing remarks
Affordable Living Right where you want it. .. 3 Bedroom, 2 Bath. Comfortable, Roomy, Primary suite offers it's own private bath. Kitchen offers lots of space, and an eat in kitchen area. Laundry can be found at the back door. Both entrances offer a wooden deck. Garden on any side, fenced for privacy. Your own parking area next to the home. Community offers whatever you are looking for. The single life, or the family. Outdoor pool, large clubhouse for entertaining, Workout area, meeting rooms, a library. .. and a great playground. Land Lease expiration to be verified by Buyer. information provided is continuing to be researched, and will be refined as discovered. Buyer to verify all info pri
Key facts
- Outdoor pool
- Parking area
- Private bath
Tags
Property features AI
Finance
- Financial info: $262 annual tax (2025)
Exterior
- Parking: No garage; No designated parking features listed
- Utilities: City water (meter installed); Public sewer; Natural gas available (XCEL); Electricity available; Cable available
- Home design: Manufactured in park; Mobile home
- Construction: Frame construction; Metal roof
- Exterior features: Deck; Storage; Land lease; Level lot; Paved; Asphalt road; Privately maintained road frontage; Minimal flood or C flood rating
Interior
- Kitchen: Self-cleaning oven; Dishwasher; Refrigerator
- Bedrooms: 3 bedrooms
- Flooring: Wood
- Bathrooms: 1 full bathroom; 1 three-quarter bathroom
- Heating & cooling: Forced air heating; Evaporative cooling
- Interior features: Eat-in kitchen; Walk-in closet(s); Window coverings; Fire alarm; Some furniture
- Laundry & utility: Washer; Dryer
Neighborhood map
What this means for you Summary
Snapshot
- This is a 3-bed/2.0-bath manufactured listed at $135k.
Deal economics
- At list price, monthly cash flow is $718 ($9k/yr) — positive.
- The deal already cash-flows at list — no discount required.
- Meets the 1% rule at list price ($2k rent vs $135k).
- Recommended offer: $131k (3.0% below list) — sets the bar for market timing.
- Cap rate 12.7% vs local median 2.6% in Longmont — top-decile yield for the area; either an underpriced asset or a hidden risk that comps aren't pricing in. Stress-test before assuming the spread holds.
Location & tenants
- Location reads 77/100 on livability (#24 in CO, #2,736 nationally) — a middle-class / working-renter tenant base. Strengths: amenities A+, employment A+, housing A+; Watch: crime F, cost of living F.
- St. Vrain Valley School District No. Re1J (suburban): math 32% / reading 51% proficiency, ranked #23 of 86 in CO (top 27%) — families likely to look elsewhere, expect single-tenant / working-renter base with shorter leases.
- Zoned schools: Indian Peaks Elementary School (math 15% / reading 32%, grade F, #634 of 966 statewide, top 67%, 251 students, 82% FRL); Niwot High School (math 51% / reading 71%, grade C+, #51 of 381 statewide, top 13%, 1,355 students, 26% FRL) — zoned schools average 54% FRL vs 27% district-wide (27 pts higher); higher-poverty schools than district average — tighter screening recommended.
- Market conditions: Rents flat; 174 active listings in the ZIP; 5 comparable units currently listed for rent nearby; rentals at typical pace (median 22d on market — plan ~3-4 weeks tenant-placement turnaround); solid renter incomes; 1,688 units permitted in Boulder County in 2024 (1,136 in 5+ unit buildings).
- This rent runs 31% of the median local income ($81k/yr) — at the standard rent-burdened threshold; future hikes will face affordability resistance.
Forward outlook
- Local home prices are declining (-3.0%/yr); year-one equity from $933 of loan paydown is wiped out by about $4k of value loss. Plan a longer hold.
- Boulder County population projected at +40% by 2050 — long-run rental-demand tailwind backs the buy-and-hold thesis.
- At projected returns (-3.0% appreciation + 0.6% rent growth), your $38k cash investment doubles in ~7 years — after that, you're playing with house money.
Negotiation context
- It's been on market 59 days — a 3% lower offer ($131k) is reasonable based on typical stale-listing flexibility.
- Current owner paid $34k; list at $135k implies a 298% gain — meaningful room to come down on a strong offer.
Questions for the listing agent
- It's been on market 59 days. Have you received any prior offers? Is the seller open to a 3% concession, seller financing, or rate buy-down credit?
- Is there a deadline driving the sale (1031 exchange, divorce, estate, relocation)? That informs how much negotiation room exists.
- Crime grade is F in this area — have there been break-ins, vandalism, or insurance claims at this property in the last 3 years? What carrier currently insures it and at what premium?
- What's the average days-on-market for RENTAL listings here right now (not sales)? A rising rental-DOM trend means longer vacancies and softer asking-rent achievability than the comps imply.
- What's the recent tenant-quality profile in this submarket — average credit score on applications, eviction rate, late-payment / NSF rate, and stable-employment percentage? A property-management company in the area should have these aggregated.
- How much new for-sale + rental construction is in the pipeline within 1–3 miles? Heavy new supply typically softens prices + rents 12–24 months out; constrained supply supports both.
Investment metrics
- 1% rule
- 1.55% ✓
- Cap rate
- 12.67%
- Cash-on-cash
- 22.79%
- DSCR
- 2.01
- GRM
- 5.4
CMA / ARV
- ARV (on-the-fly)
- $120,528
- Comps found
- 1
Show comp detail 1 sale within ~0.75 mi
| Address | Dist | Beds/Ba | Sqft | Sold | Price | $/sf | Match |
|---|---|---|---|---|---|---|---|
| 1400 S Collyer St #223 | 0.00mi | 3/2.0 | 1,456 (+12%) | 4mo | $135,000 | $93 | 76 |
Match score weights: distance 35% · size 25% · config 20% · recency 20%. Top-matched comps best support the ARV.
Projected returns pro-forma
-3.0% appreciation · 0.64% rent growth · sell at horizon
- IRR
- 13.0%
- Equity multiple
- 1.50×
- Total profit
- $19,031
- Equity at exit
- $20,129
- IRR
- 20.0%
- Equity multiple
- 2.50×
- Total profit
- $56,602
- Equity at exit
- $11,672
Cash invested: $37,800 (down + closing). Projections, not guarantees.
Landlord ↔ Tenant lean methodology
- Overall (STATE)
- 38 Tenant-Leaning
- State Colorado
- 38 Tenant-Leaning · D+4
- County
- — inherits STATE
- City
- — inherits STATE
ZIP-level market 80501
- Rents YoY
- 0.6%
- Active inventory
- 174
- Price-to-rent
- 5.4×
Monthly cashflow live
- Estimated rent
- $2,090 high interval (Pro) →
- Mortgage (P&I)
- −$708
- Tax est. 1.5%
- −$169 /mo · $2,025/yr
- Insurance
- −$56
- HOA
- −$0
- Vacancy / Maint / Mgmt
- −$439
- Net cashflow
- $718
Break-even live
Sensitivity live
| Price | -10% $811 | -5% $765 | +0% $718 | +5% $671 | +10% $625 |
|---|---|---|---|---|---|
| Rent | -10% $553 | -5% $635 | +0% $718 | +5% $800 | +10% $883 |
| Rate | -1.0pp $786 | -0.5pp $752 | base $718 | +0.5pp $683 | +1.0pp $647 |
UW: 25.0% down · 7.5% · 30yr · 1.5% tax · 5.0% vac · 8.0% maint · 8.0% mgmt
Financing live
Cash to close
- Down payment
- $33,750
- Closing costs
- $4,050
- Reserves months
- —
- Total cash needed
- —
Loan-product check · same deal, 3 products live
Conventional
25% down · 7.5% · 30yr
- Down + closing
- —
- Monthly P&I
- —
- Monthly cashflow
- —
- DSCR
- —
- Eligible?
- —
Personal DTI + credit; lowest rate.
DSCR
20% down · 8.5% · 30yr
- Down + closing
- —
- Monthly P&I
- —
- Monthly cashflow
- —
- DSCR
- —
- Eligible?
- —
No personal income docs; deal must DSCR.
Hard money
10% down · 12.0% · 12mo
- Down + closing
- —
- Monthly P&I
- —
- Monthly cashflow
- —
- DSCR
- —
- Eligible?
- —
Short-term bridge; refi at stabilization.
Rent comps 5 comps
| Address | Beds | Baths | Sqft | Rent | $/sqft | DOM | Units | Dist |
|---|---|---|---|---|---|---|---|---|
| 1328 S Coffman St Unit 1 Longmont, CO | 3.0 | 1.0 | 966 | $1,745 | $1.81 | 21d | 1 | 0.41mi |
| 1328 S Coffman St Longmont, CO | 3.0 | 1.0 | 966 | $1,795 | $1.86 | 14d | 2 | 0.41mi |
| 2020 Ionosphere St #16 Longmont, CO | 2.0 | 1.5 | 1198 | $2,400 | $2.00 | 21d | 1 | 0.52mi |
| 818 S Terry St #18 Longmont, CO | 2.0 | 2.5 | 1827 | $2,500 | $1.37 | 21d | 1 | 0.84mi |
| 732 Delaware Ave Unit A Longmont, CO | 2.0 | 1.0 | 875 | $1,600 | $1.83 | 21d | 1 | 1.16mi |
Listing history 16 events
-
2026-06-18days on market $135,000 Active 59 DOM
-
2026-06-17days on market $135,000 Active 58 DOM
-
2026-06-16days on market $135,000 Active 57 DOM
-
2026-06-15days on market $135,000 Active 56 DOM
-
2026-06-14days on market $135,000 Active 54 DOM
-
2026-06-13days on market $135,000 Active 53 DOM
-
2026-06-09days on market $135,000 Active 50 DOM
-
2026-06-09days on market $135,000 Active 49 DOM
-
2026-06-07days on market $135,000 Active 48 DOM
-
2026-06-02days on market $135,000 Active 43 DOM
-
2026-06-01days on market $135,000 Active 42 DOM
-
2026-05-31days on market $135,000 Active 41 DOM
-
2026-05-30days on market $135,000 Active 40 DOM
-
2026-04-20$135,000 Active
-
1996-08-02soldstatus $33,900
-
1992-10-28soldstatus $33,900
ⓘ Source: listings_history table (triggers on properties + properties_extension) + one-shot
backfill from property_details.listing_events for pre-trigger history.
Climate risk First Street
- Flood 1/10 Low FEMA zone X (unshaded) · 0% chance over 30 yrs
- Wildfire 1/10 Low
- Heat 3/10 Moderate 7 d/yr ≥93°F today · 19 d/yr by 30 yrs out
- Wind 1/10 Low
- Air quality 6/10 Major 10 unhealthy d/yr today · 10 by 30 yrs out
Nearby sold comps map
Loading sold comps map…
Walkable amenities ~0.75 mi
Loading nearby amenities…
Taxation est. · year 1
- Rental income
- $25,076
- − Mortgage interest
- −$7,562
- − Property taxes
- −$2,025
- − Insurance
- −$675
- − Repairs & maintenance
- −$2,006
- − Management
- −$2,006
- − Depreciation
- −$3,927
- Taxable income
- $6,875
- Est. tax owed @ 24.0%
- −$1,650
- After-tax cash flow
- $6,965/yr
For passive investors: Depreciation is non-cash, so a rental often shows a tax loss while cash-flowing — sheltering income. Rental losses are passive: they offset passive income freely, and up to $25,000/yr can offset ordinary (W-2) income if you actively participate and your MAGI is under $100k (phasing out to $0 by $150k); unused losses carry forward. On sale, claimed depreciation is recaptured at up to 25%, and gains may owe capital-gains tax (a 1031 exchange can defer both). Figures are a year-1 estimate at your 24.0% rate — not tax advice; consult a CPA.
Schools (NCES district)
- District
- St. Vrain Valley School District No. Re1J
- NCES district ID
- 0805370
- Math proficiency
- 32% ▼ -8.00%
- Reading proficiency
- 51% ▬ 0.00%
- Median HH income
- $71,571
- Composite
- 37.73/100
- National rank
- #4353
- State rank
- #23 of 86 in CO
Livability — Longmont
- Score
- 77/100
- State rank
- #24
- US rank
- #2736
Category grades
Schools grade is shown separately in the Schools card above.
Census & demographics
- Census place
- Longmont, CO
- County
- Boulder County · 271,666 people
- City population
- 143,444
- Metro
- Boulder, CO
- Population (ZIP)
- 44,147
- Household income
- $80,911
- Rent vs Own
- Severe rent burden
- 1958.0
Population outlook (Boulder County) Hauer SSP2
- Today (2025)
- 380,833 people
- By 2030
- 412,028 · +8.2%
- By 2040
- 472,764 · +24.1%
- By 2050
- 532,029 · +39.7%
- By 2075
- 679,723 · +78.5%
- By 2100
- 766,278 · +101.2%
Race, ethnicity, and origin ACS 2023
- Neighborhood character
- Majority White (62%)
- Race & ethnicity
- White 62% Hispanic / Latino 31% Two or more races 16% Asian 1% Black 1%
- Hispanic origin (detail)
- Mexican 25%
- Common ancestry
- Romanian 3% Lithuanian 2% Slovak 2%
- Foreign-born
- 12% · Canada, Jamaica
- Languages at home
- 77% English-only · Spanish 19% Other Indo-European 1% Russian/Polish/Slavic 1%
Political lean MEDSL · Boulder
- 2024 margin
- Solid D (+55.8) · D 76.5% · R 20.8% · Other 2.7%
- 2008→2024 swing
- +9.6pp toward D · 2008: 46.1pp · 2024: 55.8pp
- All cycles
- 2024: D+55.8 2020: D+56.6 2016: D+48.6 2012: D+41.5 2008: D+46.1
Not yet ingested
- Civics
- —
Market trends
- HPI YoY
- ▼ -567.24%
- Current HPI
- 268.454
- Rent YoY
- ▲ 0.64%
- Metro
- Boulder, CO
- State GDP YoY
- ▲ 1.95%
- F500 in state
- 14
Industry mix (Fortune 500 HQ in CO)
| Industry | F500 HQs | Revenue |
|---|---|---|
| Technology Distribution | 1 | $31B |
|
||
| Food / Agriculture | 1 | $18B |
|
||
| Packaging | 1 | $14B |
|
||
| Healthcare | 1 | $13B |
|
||
| Energy | 1 | $10B |
|
||
| Technology | 1 | $4B |
|
||
Price history
+298.2% since first listed3 events — show timeline
- 2026-04-20 Listed $135,000 IRES
- 1996-08-02 Sold (Public Records) $33,900 Public Records
- 1992-10-28 Sold (Public Records) $33,900 Public Records
Property tax history
+1.0%/yrLatest (2025): $262 · +173.7% YoY. Source: county tax records.
Cash-flow waterfall
monthlySold comps — $/sqft
last 12 mo · ≤1 miLoading sold comps…