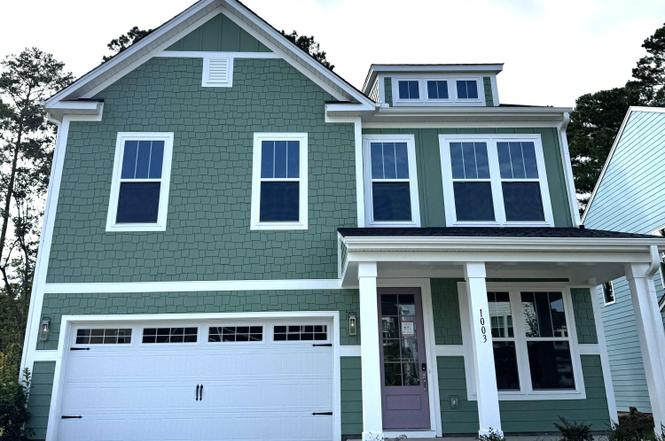
1003 Field Sparrow Dr Unit Cc3-2-3 · North Charleston, SC
Flood risk No data
- FEMA flood zone
- —
- Chance of flooding over 30 yrs
- —
- Est. flood insurance / yr
- —
Fire risk No data
- Est. fire insurance / yr
- —
Heat risk No data
- Hot days now (above threshold)
- —
- Hot days in 30 yrs
- —
Wind risk No data
- Chance of severe wind over 30 yrs
- —
Air-quality risk No data
- Unhealthy air days now
- —
- Unhealthy air days in 30 yrs
- —
Risk factors via First Street. Map © Google.
Why this score? — see what drove the D grade
The composite is a weighted blend of 9 inputs, each scored 0–100. Each bar is that input's sub-score; the figure is the points it added to the 100-point composite (weight × sub-score).
- Cash flow +12.0/30.0
- ARV discount +11.9/15.0
- Schools +4.1/10.0
- 1% rule +3.6/10.0
- DSCR +3.5/10.0
- Livability +3.3/5.0
- Rent growth +2.5/5.0
- Condition / age +2.5/5.0
- Appreciation +0.0/10.0
$399,000
🖨 Deal sheet 📄 Offer letter ✓ Due diligence
Listing remarks
Tour this stunning home today - 2,451 sqft 4 bedroom/2.5 bathroom in Dorchester District II schools on a wooded lot with beautifully designed interiors throughout. Laminate wood flooring on 1st with hardwood stairs. Upgraded kitchen with stainless steel farm sink, gas range, large cabinets, enhanced countertops, and backsplash. Luxury Primary bath with Elegance package upgraded shower. Call to schedule a tour with a True Advisor today.
Key facts
- Wooded lot
- Upgraded kitchen
- Large cabinets
Tags
Neighborhood map
What this means for you Summary
Snapshot
- This is a 4-bed/2.5-bath single-family listed at $399k.
Deal economics
- At list price, monthly cash flow is $-94 ($-1k/yr) — negative.
- To cash-flow at today's rent, offer at most $385k (3.4% below list).
- To meet the 1% rule (rent ≥ 1% of price), the offer needs to be $344k (13.7% below list).
- Recommended offer: $344k (13.7% below list) — sets the bar for 1% rule.
- Cap rate 6.0% vs local median 4.0% in North Charleston — top-decile yield for the area; either an underpriced asset or a hidden risk that comps aren't pricing in. Stress-test before assuming the spread holds.
Location & tenants
- Location reads 66/100 on livability (#122 in SC) — a middle-class / working-renter tenant base. Strengths: housing A+, health & safety A+, cost of living A; Watch: employment C-, crime F, amenities F.
- Dorchester 02 (suburban): math 40% / reading 55% proficiency, ranked #12 of 80 in SC (top 15%) — families likely to look elsewhere, expect single-tenant / working-renter base with shorter leases.
- Zoned schools: Beech Hill Elementary (math 67% / reading 72%, grade A-, #38 of 597 statewide, top 7%, 1,101 students, 34% FRL); East Edisto Middle (879 students, 46% FRL); Ashley Ridge High (math 73% / reading 93%, grade A, #18 of 196 statewide, top 9%, 2,542 students, 50% FRL).
- Zoned-school proficiency averages 76% at this address vs 48% district-wide (+29 pts) — the actual schools serving this property are materially stronger than the Dorchester 02 average implies; a family-tenant draw the district grade alone would hide.
- Market conditions: 196 active listings in the ZIP; 2 comparable units currently listed for rent nearby; 1,199 units permitted in Dorchester County in 2024 (0 in 5+ unit buildings).
Forward outlook
- Local home prices are declining (-3.0%/yr); year-one equity from $3k of loan paydown is wiped out by about $12k of value loss. Plan a longer hold.
- Dorchester County population projected at +43% by 2050 — long-run rental-demand tailwind backs the buy-and-hold thesis.
Negotiation context
- It's been on market 48 days — a 3% lower offer ($387k) is reasonable based on typical stale-listing flexibility.
Questions for the listing agent
- What do current leases actually rent for vs. the listed asking? Can we see a recent rent roll and the last 12 months of T-12 income?
- It's been on market 48 days. Have you received any prior offers? Is the seller open to a 14% concession, seller financing, or rate buy-down credit?
- What does the HOA fee cover, when was the last increase, and are there any pending special assessments or reserve-fund shortfalls?
- Is there a deadline driving the sale (1031 exchange, divorce, estate, relocation)? That informs how much negotiation room exists.
- Crime grade is F in this area — have there been break-ins, vandalism, or insurance claims at this property in the last 3 years? What carrier currently insures it and at what premium?
- The area grade is low — what's the realistic commute time and amenity access for the typical tenant pool here? Any planned neighborhood developments (good or bad) we should know about?
- What's the average days-on-market for RENTAL listings here right now (not sales)? A rising rental-DOM trend means longer vacancies and softer asking-rent achievability than the comps imply.
- What's the recent tenant-quality profile in this submarket — average credit score on applications, eviction rate, late-payment / NSF rate, and stable-employment percentage? A property-management company in the area should have these aggregated.
- How much new for-sale + rental construction is in the pipeline within 1–3 miles? Heavy new supply typically softens prices + rents 12–24 months out; constrained supply supports both.
Investment metrics
- 1% rule
- 0.86% ✗
- Cap rate
- 6.01%
- Cash-on-cash
- -1.01%
- DSCR
- 0.95
- GRM
- 9.7
CMA / ARV
- ARV (on-the-fly)
- $442,188
- Comps found
- 12
Show comp detail 12 sales within ~0.75 mi
| Address | Dist | Beds/Ba | Sqft | Sold | Price | $/sf | Match |
|---|---|---|---|---|---|---|---|
| 1039 Field Sparrow Dr Unit Cc3-23-4 | 0.11mi | 4/2.5 | 2,484 (-3%) | 1mo | $425,580 | $171 | 89 |
| 1017 Field Sparrow Dr | 0.07mi | 4/3.5 | 2,685 (+5%) | 1mo | $520,000 | $194 | 83 |
| 1027 House Finch Ave Unit Cc3-21-6 | 0.19mi | 4/2.5 | 2,462 (-4%) | 3mo | $426,500 | $173 | 83 |
| 1010 Northern Flicker Dr | 0.28mi | 3/2.5 (-1) | 2,471 (-3%) | 3mo | $467,000 | $189 | 74 |
| 1044 House Finch Ave Unit Cc3-22-20 | 0.25mi | 3/3.5 (-1) | 2,398 (-6%) | 1mo | $429,900 | $179 | 69 |
| 1042 Marsh Harrier Dr Unit Cc3-4-7 | 0.16mi | 4/2.5 | 2,914 (+14%) | 1mo | $410,000 | $141 | 68 |
| 1005 Mourning Warbler Way Unit Cc3-17-2 | 0.17mi | 3/2.5 (-1) | 2,296 (-10%) | 3mo | $396,900 | $173 | 68 |
| 1046 House Finch Ave Unit Cc3-22-21 | 0.25mi | 5/3.0 (+1) | 2,817 (+10%) | 0mo | $469,900 | $167 | 64 |
| 1042 House Finch Ave Unit Cc3-22-19 | 0.24mi | 5/3.0 (+1) | 2,817 (+10%) | 2mo | $479,900 | $170 | 63 |
| 1068 Magnolia Warbler Way | 0.59mi | 3/2.5 (-1) | 2,500 (-2%) | 3mo | $405,000 | $162 | 62 |
| 1032 Magnolia Warbler Way | 0.67mi | 3/2.5 (-1) | 2,521 (-1%) | 0mo | $450,000 | $179 | 61 |
| 1016 Swamp Harrier Ave | 0.58mi | 4/2.5 | 2,783 (+9%) | 1mo | $383,900 | $138 | 58 |
Match score weights: distance 35% · size 25% · config 20% · recency 20%. Top-matched comps best support the ARV.
Projected returns pro-forma
-3.0% appreciation · 3.0% rent growth · sell at horizon
- IRR
- -17.9%
- Equity multiple
- 0.37×
- Total profit
- $-70,576
- Equity at exit
- $59,492
- IRR
- -10.1%
- Equity multiple
- 0.38×
- Total profit
- $-68,837
- Equity at exit
- $34,498
Cash invested: $111,720 (down + closing). Projections, not guarantees.
Landlord ↔ Tenant lean methodology
- Overall (STATE)
- 90 Strongly Landlord-Friendly
- State South Carolina
- 90 Strongly Landlord-Friendly · R+6
- County
- — inherits STATE
- City
- — inherits STATE
ZIP-level market 29470
- Home prices YoY
- -22.9%
- Active inventory
- 196
- Price-to-rent
- 9.7×
Monthly cashflow live
- Estimated rent
- $3,444 medium interval (Pro) →
- Mortgage (P&I)
- −$2,092
- Tax est. 1.5%
- −$499 /mo · $5,985/yr
- Insurance
- −$166
- HOA
- −$58
- Vacancy / Maint / Mgmt
- −$723
- Net cashflow
- $-94
Break-even live
UW: 25.0% down · 7.5% · 30yr · 1.5% tax · 5.0% vac · 8.0% maint · 8.0% mgmt
Financing live
Cash to close
- Down payment
- $99,750
- Closing costs
- $11,970
- Reserves months
- —
- Total cash needed
- —
Loan-product check · same deal, 3 products live
Conventional
25% down · 7.5% · 30yr
- Down + closing
- —
- Monthly P&I
- —
- Monthly cashflow
- —
- DSCR
- —
- Eligible?
- —
Personal DTI + credit; lowest rate.
DSCR
20% down · 8.5% · 30yr
- Down + closing
- —
- Monthly P&I
- —
- Monthly cashflow
- —
- DSCR
- —
- Eligible?
- —
No personal income docs; deal must DSCR.
Hard money
10% down · 12.0% · 12mo
- Down + closing
- —
- Monthly P&I
- —
- Monthly cashflow
- —
- DSCR
- —
- Eligible?
- —
Short-term bridge; refi at stabilization.
Rent comps 2 comps
| Address | Beds | Baths | Sqft | Rent | $/sqft | DOM | Units | Dist |
|---|---|---|---|---|---|---|---|---|
| 1088 Magnolia Warbler Way Ravenel, SC | 4.0 | 3.5 | 2671 | $2,999 | $1.12 | 3d | 1 | 0.51mi |
| 245 Summer Tanager Dr Ravenel, SC | 4.0 | 4.0 | 3735 | $4,230 | $1.13 | 3d | 1 | 0.65mi |
HOA detail
- Monthly dues
- $58 · $696/yr
- Likely covers
- gas
Listing history 7 events
-
2025-12-01status Pending
-
2025-11-26price $399,000
-
2025-11-15price $412,400
-
2025-11-11price $417,400
-
2025-10-30price $424,900
-
2025-10-24price $432,400
-
2025-10-14$439,900 Active
ⓘ Source: listings_history table (triggers on properties + properties_extension) + one-shot
backfill from property_details.listing_events for pre-trigger history.
Nearby sold comps map
Loading sold comps map…
Walkable amenities ~0.75 mi
Loading nearby amenities…
Taxation est. · year 1
- Rental income
- $41,333
- − Mortgage interest
- −$22,350
- − Property taxes
- −$5,985
- − Insurance
- −$1,995
- − Repairs & maintenance
- −$3,307
- − Management
- −$3,307
- − HOA
- −$696
- − Depreciation
- −$11,607
- Taxable loss
- −$7,914
- Est. tax savings @ 24.0%
- +$1,899
- After-tax cash flow
- $767/yr
For passive investors: Depreciation is non-cash, so a rental often shows a tax loss while cash-flowing — sheltering income. Rental losses are passive: they offset passive income freely, and up to $25,000/yr can offset ordinary (W-2) income if you actively participate and your MAGI is under $100k (phasing out to $0 by $150k); unused losses carry forward. On sale, claimed depreciation is recaptured at up to 25%, and gains may owe capital-gains tax (a 1031 exchange can defer both). Figures are a year-1 estimate at your 24.0% rate — not tax advice; consult a CPA.
Schools (NCES district)
- District
- Dorchester 02
- NCES district ID
- 4502010
- Math proficiency
- 40% ▼ -13.00%
- Reading proficiency
- 55% ▼ -4.00%
- Median HH income
- $57,937
- Composite
- 41.41/100
- National rank
- #3475
- State rank
- #12 of 80 in SC
Livability — North Charleston
- Score
- 66/100
- State rank
- #122
- US rank
- #12222
Category grades
Schools grade is shown separately in the Schools card above.
Census & demographics
- City population
- 108,266
- Population (ZIP)
- 5,869
Population outlook (Dorchester County) Hauer SSP2
- Today (2025)
- 186,982 people
- By 2030
- 203,967 · +9.1%
- By 2040
- 237,160 · +26.8%
- By 2050
- 267,479 · +43.1%
- By 2075
- 333,025 · +78.1%
- By 2100
- 366,560 · +96.0%
Race, ethnicity, and origin ACS 2023
- Neighborhood character
- Diverse neighborhood (Simpson 0.58)
- Race & ethnicity
- White 46% Black 45% Hispanic / Latino 5% Two or more races 5%
- Hispanic origin (detail)
- Mexican 3%
- Common ancestry
- Romanian 6% Serbian 1% Lithuanian 1%
- Foreign-born
- 7% · Canada
- Languages at home
- 90% English-only · Spanish 4% Russian/Polish/Slavic 3% Other Indo-European 2%
Political lean MEDSL · Dorchester
- 2024 margin
- R (+14.6) · D 41.8% · R 56.4% · Other 1.9%
- 2008→2024 swing
- +0.9pp no change · 2008: -15.5pp · 2024: -14.6pp
- All cycles
- 2024: R+14.6 2020: R+10.5 2016: R+17.5 2012: R+16.0 2008: R+15.5
Not yet ingested
- Civics
- —
Market trends
- HPI YoY
- ▼ -106.06%
- Current HPI
- 356.2356
- Rent YoY
- —
- Metro
- —
- State GDP YoY
- ▲ 4.51%
- F500 in state
- 2
Industry mix (Fortune 500 HQ in SC)
| Industry | F500 HQs | Revenue |
|---|---|---|
| Packaging | 1 | $7B |
|
||
Price history
-9.3% since first listed7 events — show timeline
- 2025-12-01 Pending — Charleston Trident MLS
- 2025-11-26 Price Changed $399,000 Charleston Trident MLS
- 2025-11-15 Price Changed $412,400 Charleston Trident MLS
- 2025-11-11 Price Changed $417,400 Charleston Trident MLS
- 2025-10-30 Price Changed $424,900 Charleston Trident MLS
- 2025-10-24 Price Changed $432,400 Charleston Trident MLS
- 2025-10-14 Listed $439,900 Charleston Trident MLS
Cash-flow waterfall
monthlySold comps — $/sqft
last 12 mo · ≤1 miLoading sold comps…