 Multi-family
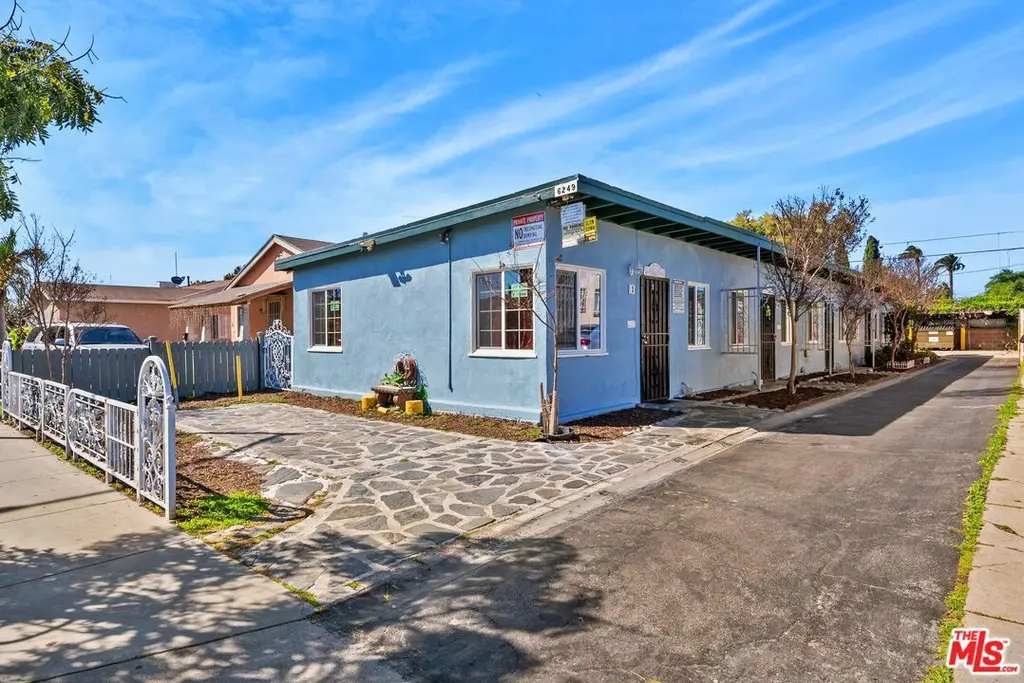
6249 Newell St · Huntington Park, CA
Flood risk 1/10 · Minimal
- FEMA flood zone
- X (unshaded)
- Chance of flooding over 30 yrs
- 0.0%
- Est. flood insurance / yr
- $507 – $1,088
Fire risk 1/10 · Minimal
- Est. fire insurance / yr
- $659 – $1,223
Heat risk 6/10 · Moderate
- Hot days now (above 91°F)
- 7 days/yr
- Hot days in 30 yrs
- 22 days/yr
Wind risk 1/10 · Minimal
- Chance of severe wind over 30 yrs
- —
Air-quality risk 5/10 · Moderate
- Unhealthy air days now
- 9 days/yr
- Unhealthy air days in 30 yrs
- 9 days/yr
Risk factors via First Street. Map © Google.
Why this score? — see what drove the D grade
The composite is a weighted blend of 9 inputs, each scored 0–100. Each bar is that input's sub-score; the figure is the points it added to the 100-point composite (weight × sub-score).
- Cash flow +19.5/30.0
- DSCR +6.2/10.0
- 1% rule +5.0/10.0
- Schools +3.6/10.0
- Livability +3.1/5.0
- Condition / age +2.5/5.0
- Rent growth +2.1/5.0
- ARV discount +0.3/15.0
- Appreciation +0.0/10.0
$869,000
🖨 Deal sheet (PDF) 📄 Offer letter ✓ Due diligence
Multi-family units
County records classify this as Multi-Family (5+ Unit). Listing-text estimate: 1 unit. estimate disagrees with records
5+ unit building — per-unit beds/baths from public records are typically unavailable; the breakdown below (if shown) is an estimate from the listing text.
Listing remarks MLS
Presenting The Newell Apartments, a well-maintained multifamily investment opportunity situated in the thriving city of Huntington Park. This property is comprised of five one bedroom, one bathroom units, each equipped with an assigned parking space for tenants (4 parking spaces in the rear and the open area in the front is used as an additional parking space). Offered for the first time in over two decades, the property has been meticulously maintained by long-term ownership, with several upgrades completed to preserve the asset and ensure consistent cash flow. Conveniently located in the central hub of Huntington Park, the property provides exceptional access to major transportation corridors, including the 5, 710, 10, and 110 freeways. The property is situated just minutes from various entertainment and recreational facilities, schools, and nearby medical facilities.
Key facts
- Several upgrades
- Exceptional access
- 5,852 sq ft lot
Tags
Neighborhood map
What this means for you Summary
Snapshot
- This is a 5-bed/5.0-bath multifamily listed at $869k.
Deal economics
- At list price, monthly cash flow is $982 ($12k/yr) — positive.
- The deal already cash-flows at list — no discount required.
- Meets the 1% rule at list price ($9k rent vs $869k).
- Recommended offer: $791k (9.0% below list) — sets the bar for market timing.
- Cap rate 7.6% vs local median 3.1% in Huntington Park — top-decile yield for the area; either an underpriced asset or a hidden risk that comps aren't pricing in. Stress-test before assuming the spread holds.
Location & tenants
- Location reads 62/100 on livability (#491 in CA) — a middle-class / working-renter tenant base. Strengths: commute A+; Watch: employment D+, health & safety D, crime F.
- Los Angeles Unified (urban): math 29% / reading 54% proficiency, ranked #223 of 517 in CA (top 43%) — families likely to look elsewhere, expect single-tenant / working-renter base with shorter leases; 67% free/reduced lunch — lower-income household profile, screen leases tightly.
- Zoned schools: San Antonio Elementary (463 students, 95% FRL); Henry T. Gage Middle (1,195 students, 96% FRL); Huntington Park Senior High (math 17% / reading 52%, grade F, #618 of 1,170 statewide, top 56%, 1,465 students, 97% FRL) — zoned schools average 96% FRL vs 67% district-wide (29 pts higher); higher-poverty schools than district average — tighter screening recommended.
- Market conditions: Rents soft (-1.4%/yr); 53 active listings in the ZIP; 2 comparable units currently listed for rent nearby; 19,697 units permitted in Los Angeles County in 2024 (9,426 in 5+ unit buildings).
- At $8,716/mo this rent would consume 161% of the median local household income ($65k/yr) (locally 3774% of renters already pay >50% of income on rent) — very limited rent-growth headroom before tenants either downsize or default.
Forward outlook
- Local home prices are declining (-3.0%/yr); year-one equity from $6k of loan paydown is wiped out by about $26k of value loss. Plan a longer hold.
- Los Angeles County population projected at +9% by 2050 — modest demand growth; plan on rents tracking national, not racing it.
Negotiation context
- It's been on market 94 days — a 9% lower offer ($791k) is reasonable based on typical stale-listing flexibility.
- 3 sale attempts since 26y ago; this cycle's ask has dropped $76k (8%) from the opening price — seller is motivated, your offer sets the floor, not the list.
- Current owner paid $52k; list at $869k implies a 1555% gain — meaningful room to come down on a strong offer.
Risks & watch-outs
- Watch-outs: built in 1953 — expect roof / HVAC / electrical / plumbing capex.
- Climate carrying-cost: extreme-heat days projected 7→22/yr by 2055 (HVAC capex compounding) — expect insurance premiums to compound above CPI over the hold.
Questions for the listing agent
- It's been on market 94 days. Have you received any prior offers? Is the seller open to a 9% concession, seller financing, or rate buy-down credit?
- Built in 1953 — when were the roof, HVAC, electrical panel, plumbing, and water heater last replaced?
- Why hasn't it sold? Are there any deal-killer items the seller is aware of (foundation, flood, title, zoning, code violations)?
- Is there a deadline driving the sale (1031 exchange, divorce, estate, relocation)? That informs how much negotiation room exists.
- Schools are D-rated, which usually means shorter tenancies and higher turnover. Who's the typical renter profile here, and what's been the actual vacancy rate?
- Crime grade is F in this area — have there been break-ins, vandalism, or insurance claims at this property in the last 3 years? What carrier currently insures it and at what premium?
- The area grade is low — what's the realistic commute time and amenity access for the typical tenant pool here? Any planned neighborhood developments (good or bad) we should know about?
- What's the average days-on-market for RENTAL listings here right now (not sales)? A rising rental-DOM trend means longer vacancies and softer asking-rent achievability than the comps imply.
- What's the recent tenant-quality profile in this submarket — average credit score on applications, eviction rate, late-payment / NSF rate, and stable-employment percentage? A property-management company in the area should have these aggregated.
- How much new apartment / multifamily construction is in the pipeline within 1–3 miles? Heavy new supply (>2% of stock underway) typically softens rents 12–24 months out; light construction supports rent growth.
Investment metrics
- 1% rule
- 1.00% ✓
- Cap rate
- 7.65%
- Cash-on-cash
- 4.84%
- DSCR
- 1.22
- GRM
- 8.3
CMA / ARV
- ARV (median comp)
- $749,704
- List price
- $869,000
- Delta
- 15.91%
- Verdict
- OVERPRICED
- Comps
- 20 within 1.0 mi
Show comp detail 7 sales within ~0.75 mi
| Address | Dist | Beds/Ba | Sqft | Sold | Price | $/sf | Match |
|---|---|---|---|---|---|---|---|
| 6235 Bissell St | 0.12mi | 4/3.0 (-1) | 1,951 (-10%) | 18mo | $785,000 | $402 | 50 |
| 6509 State | 0.28mi | 4/2.0 (-1) | 1,962 (-9%) | 6mo | $720,000 | $367 | 49 |
| 3549 E 58th St | 0.67mi | 5/4.0 | 2,196 (+2%) | 20mo | $961,500 | $438 | 46 |
| 2983 Clarendon Ave | 0.40mi | 4/3.0 (-1) | 2,398 (+11%) | 9mo | $650,000 | $271 | 42 |
| 6362 Arbutus Ave | 0.34mi | 6/3.0 (+1) | 2,020 (-7%) | 22mo | $898,000 | $445 | 42 |
| 6212 Orchard Ave | 0.57mi | 5/4.0 | 1,888 (-13%) | 16mo | $900,000 | $477 | 35 |
| 6133 Orchard Ave | 0.60mi | 4/3.0 (-1) | 1,910 (-12%) | 7mo | $906,000 | $474 | 34 |
Match score weights: distance 35% · size 25% · config 20% · recency 20%. Top-matched comps best support the ARV.
Projected returns pro-forma
-3.0% appreciation · 0.0% rent growth · sell at horizon
- IRR
- -12.1%
- Equity multiple
- 0.57×
- Total profit
- $-103,731
- Equity at exit
- $129,571
- IRR
- -8.2%
- Equity multiple
- 0.56×
- Total profit
- $-108,208
- Equity at exit
- $75,135
Cash invested: $243,320 (down + closing). Projections, not guarantees.
Landlord ↔ Tenant lean methodology
- Overall (STATE)
- 18 Strongly Tenant-Friendly
- State California
- 18 Strongly Tenant-Friendly · D+13
- County
- — inherits STATE
- City
- — inherits STATE
ZIP-level market 90255
- Rents YoY
- -1.4%
- Active inventory
- 53
- Price-to-rent
- 41.5×
Monthly cashflow live
- Estimated rent
- $8,716 medium interval (Pro) →
- Mortgage (P&I)
- −$4,557
- Tax from tax record
- −$984 /mo · $11,810/yr
- Insurance
- −$362
- HOA
- −$0
- Vacancy / Maint / Mgmt
- −$1,830
- Net cashflow
- $982
Break-even live
Sensitivity live
| Price | -10% $1,474 | -5% $1,228 | +0% $982 | +5% $736 | +10% $490 |
|---|---|---|---|---|---|
| Rent | -10% $294 | -5% $638 | +0% $982 | +5% $1,327 | +10% $1,671 |
| Rate | -1.0pp $1,420 | -0.5pp $1,203 | base $982 | +0.5pp $757 | +1.0pp $528 |
5-unit breakdown (identical units grouped — click to expand)
| Units | Beds | Baths | Est. rent |
|---|---|---|---|
| 5× units | 1 | 1 | $8,715 |
| #1 | 1 | 1 | $1,743 |
| #2 | 1 | 1 | $1,743 |
| #3 | 1 | 1 | $1,743 |
| #4 | 1 | 1 | $1,743 |
| #5 | 1 | 1 | $1,743 |
| Total (5 units) | $8,716 | ||
UW: 25.0% down · 7.5% · 30yr · 1.5% tax · 5.0% vac · 8.0% maint · 8.0% mgmt
Financing live
Cash to close
- Down payment
- $217,250
- Closing costs
- $26,070
- Reserves months
- —
- Total cash needed
- —
Loan-product check · same deal, 3 products live
Conventional
25% down · 7.5% · 30yr
- Down + closing
- —
- Monthly P&I
- —
- Monthly cashflow
- —
- DSCR
- —
- Eligible?
- —
Personal DTI + credit; lowest rate.
DSCR
20% down · 8.5% · 30yr
- Down + closing
- —
- Monthly P&I
- —
- Monthly cashflow
- —
- DSCR
- —
- Eligible?
- —
No personal income docs; deal must DSCR.
Hard money
10% down · 12.0% · 12mo
- Down + closing
- —
- Monthly P&I
- —
- Monthly cashflow
- —
- DSCR
- —
- Eligible?
- —
Short-term bridge; refi at stabilization.
Rent comps 2 comps
| Address | Beds | Baths | Sqft | Rent | $/sqft | DOM | Units | Dist |
|---|---|---|---|---|---|---|---|---|
| 2860 Randolph St Unit A Huntington Park, CA | 4.0 | 2.0 | 1660 | $3,000 | $1.81 | 45d | 1 | 0.59mi |
| 3811 Live Oak St Cudahy, CA | 4.0 | 3.0 | 1954 | $4,200 | $2.15 | 5d | 1 | 1.02mi |
Listing history 22 events
-
2026-06-21days on market $869,000 Active 94 DOM
-
2026-06-18days on market $869,000 Active 91 DOM
-
2026-06-17days on market $869,000 Active 90 DOM
-
2026-06-16days on market $869,000 Active 89 DOM
-
2026-06-15days on market $869,000 Active 88 DOM
-
2026-06-13pricedays on market $869,000 Active 86 DOM
-
2026-06-09days on market $910,000 Active 82 DOM
-
2026-06-08days on market $910,000 Active 81 DOM
-
2026-06-07days on market $910,000 Active 80 DOM
-
2026-06-04days on market $910,000 Active 77 DOM
-
2026-06-03days on market $910,000 Active 76 DOM
-
2026-06-02days on market $910,000 Active 75 DOM
-
2026-06-01days on market $910,000 Active 74 DOM
-
2026-05-31days on market $910,000 Active 73 DOM
-
2026-04-14price $910,000 882-char remark
Show marketing remark (882 chars)
Presenting The Newell Apartments, a well-maintained multifamily investment opportunity situated in the thriving city of Huntington Park. This property is comprised of five one bedroom, one bathroom units, each equipped with an assigned parking space for tenants (4 parking spaces in the rear and the open area in the front is used as an additional parking space). Offered for the first time in over two decades, the property has been meticulously maintained by long-term ownership, with several upgrades completed to preserve the asset and ensure consistent cash flow. Conveniently located in the central hub of Huntington Park, the property provides exceptional access to major transportation corridors, including the 5, 710, 10, and 110 freeways. The property is situated just minutes from various entertainment and recreational facilities, schools, and nearby medical facilities.
-
2026-04-09status Active 882-char remark
Show marketing remark (882 chars)
Presenting The Newell Apartments, a well-maintained multifamily investment opportunity situated in the thriving city of Huntington Park. This property is comprised of five one bedroom, one bathroom units, each equipped with an assigned parking space for tenants (4 parking spaces in the rear and the open area in the front is used as an additional parking space). Offered for the first time in over two decades, the property has been meticulously maintained by long-term ownership, with several upgrades completed to preserve the asset and ensure consistent cash flow. Conveniently located in the central hub of Huntington Park, the property provides exceptional access to major transportation corridors, including the 5, 710, 10, and 110 freeways. The property is situated just minutes from various entertainment and recreational facilities, schools, and nearby medical facilities.
-
2026-04-06status Pending 882-char remark
Show marketing remark (882 chars)
Presenting The Newell Apartments, a well-maintained multifamily investment opportunity situated in the thriving city of Huntington Park. This property is comprised of five one bedroom, one bathroom units, each equipped with an assigned parking space for tenants (4 parking spaces in the rear and the open area in the front is used as an additional parking space). Offered for the first time in over two decades, the property has been meticulously maintained by long-term ownership, with several upgrades completed to preserve the asset and ensure consistent cash flow. Conveniently located in the central hub of Huntington Park, the property provides exceptional access to major transportation corridors, including the 5, 710, 10, and 110 freeways. The property is situated just minutes from various entertainment and recreational facilities, schools, and nearby medical facilities.
-
2026-03-17$945,000 Active 882-char remark
Show marketing remark (882 chars)
Presenting The Newell Apartments, a well-maintained multifamily investment opportunity situated in the thriving city of Huntington Park. This property is comprised of five one bedroom, one bathroom units, each equipped with an assigned parking space for tenants (4 parking spaces in the rear and the open area in the front is used as an additional parking space). Offered for the first time in over two decades, the property has been meticulously maintained by long-term ownership, with several upgrades completed to preserve the asset and ensure consistent cash flow. Conveniently located in the central hub of Huntington Park, the property provides exceptional access to major transportation corridors, including the 5, 710, 10, and 110 freeways. The property is situated just minutes from various entertainment and recreational facilities, schools, and nearby medical facilities.
-
2002-06-06soldstatus $52,500
-
2001-03-27soldstatus $212,500
-
2000-12-31historical
-
2000-09-20$225,000
ⓘ Source: listings_history table (triggers on properties + properties_extension) + one-shot
backfill from property_details.listing_events for pre-trigger history.
Tax reassessment forecast CA · Resets to sale price
- Current annual tax
- $11,810 · $984/mo
- Projected year-2 tax
- $11,810 · $984/mo
- Expected delta
- $0/yr ($0/mo · 0.0%)
ⓘ Screening estimate from a state-policy table — verify with the county assessor before closing.
Climate risk First Street
- Flood 1/10 Low FEMA zone X (unshaded) · 0% chance over 30 yrs
- Wildfire 1/10 Low
- Heat 6/10 Major 7 d/yr ≥91°F today · 22 d/yr by 30 yrs out
- Wind 1/10 Low
- Air quality 5/10 Major 9 unhealthy d/yr today · 9 by 30 yrs out
Nearby sold comps map
Loading sold comps map…
Walkable amenities ~0.75 mi
Loading nearby amenities…
Taxation est. · year 1
- Rental income
- $104,592
- − Mortgage interest
- −$48,678
- − Property taxes
- −$11,810
- − Insurance
- −$4,345
- − Repairs & maintenance
- −$8,367
- − Management
- −$8,367
- − Depreciation
- −$25,280
- Taxable loss
- −$2,256
- Est. tax savings @ 24.0%
- +$541
- After-tax cash flow
- $12,328/yr
For passive investors: Depreciation is non-cash, so a rental often shows a tax loss while cash-flowing — sheltering income. Rental losses are passive: they offset passive income freely, and up to $25,000/yr can offset ordinary (W-2) income if you actively participate and your MAGI is under $100k (phasing out to $0 by $150k); unused losses carry forward. On sale, claimed depreciation is recaptured at up to 25%, and gains may owe capital-gains tax (a 1031 exchange can defer both). Figures are a year-1 estimate at your 24.0% rate — not tax advice; consult a CPA.
Schools (NCES district)
- District
- Los Angeles Unified
- NCES district ID
- 0622710
- Math proficiency
- 29% ▼ -4.00%
- Reading proficiency
- 54% ▲ 10.00%
- Median HH income
- $50,403
- Composite
- 35.67/100
- National rank
- #4875
- State rank
- #223 of 517 in CA
Livability — Huntington Park
- Score
- 62/100
- State rank
- #491
- US rank
- #16649
Category grades
Schools grade is shown separately in the Schools card above.
Census & demographics
- Census place
- Huntington Park, CA
- County
- Los Angeles County · 9,444,647 people
- City population
- 69,349
- Metro
- Los Angeles-Long Beach-Anaheim, CA
- Population (ZIP)
- 69,349
- Household income
- $64,766
- Rent vs Own
- Severe rent burden
- 3774.0
Population outlook (Los Angeles County) Hauer SSP2
- Today (2025)
- 10,940,515 people
- By 2030
- 11,256,481 · +2.9%
- By 2040
- 11,729,929 · +7.2%
- By 2050
- 11,948,407 · +9.2%
- By 2075
- 11,818,114 · +8.0%
- By 2100
- 10,842,928 · -0.9%
Race, ethnicity, and origin ACS 2023
- Neighborhood character
- Predominantly Hispanic (97%)
- Race & ethnicity
- Hispanic / Latino 97% Two or more races 31% Native American 2% White 1%
- Hispanic origin (detail)
- Mexican 78%
- Foreign-born
- 46% · Canada
- Languages at home
- 11% English-only · Spanish 88%
Political lean MEDSL · Los Angeles
- 2024 margin
- Solid D (+32.9) · D 64.8% · R 31.9% · Other 3.3%
- 2008→2024 swing
- -7.4pp toward R · 2008: 40.4pp · 2024: 32.9pp
- All cycles
- 2024: D+32.9 2020: D+44.2 2016: D+48.0 2012: D+40.0 2008: D+40.4
Not yet ingested
- Civics
- —
Market trends
- HPI YoY
- ▼ -666.90%
- Current HPI
- 432.2813
- Rent YoY
- ▼ -1.44%
- Metro
- Los Angeles-Long Beach-Anaheim, CA
- State GDP YoY
- ▲ 3.21%
- F500 in state
- 116
Industry mix (Fortune 500 HQ in CA)
| Industry | F500 HQs | Revenue |
|---|---|---|
| Technology | 27 | $1,492B |
|
||
| Financial Services | 3 | $174B |
|
||
| Retail | 3 | $44B |
|
||
| Insurance | 3 | $26B |
|
||
| Media / Entertainment | 2 | $115B |
|
||
| Pharmaceuticals / Biotech | 2 | $62B |
|
||
Price history
+304.4% since first listed8 events — show timeline
- 2026-04-14 Price Changed $910,000 TheMLS
- 2026-04-09 Relisted — TheMLS
- 2026-04-06 Pending — TheMLS
- 2026-03-17 Listed $945,000 TheMLS
- 2002-06-06 Sold (Public Records) $52,500 Public Records
- 2001-03-27 Sold (Public Records) $212,500 Public Records
- 2000-12-31 Listing Removed — CRMLS
- 2000-09-20 Listed $225,000 CRMLS
Property tax history
+2.5%/yrLatest (2025): $11,810 · +2.6% YoY. Source: county tax records.
Cash-flow waterfall
monthlySold comps — $/sqft
last 12 mo · ≤1 miLoading sold comps…