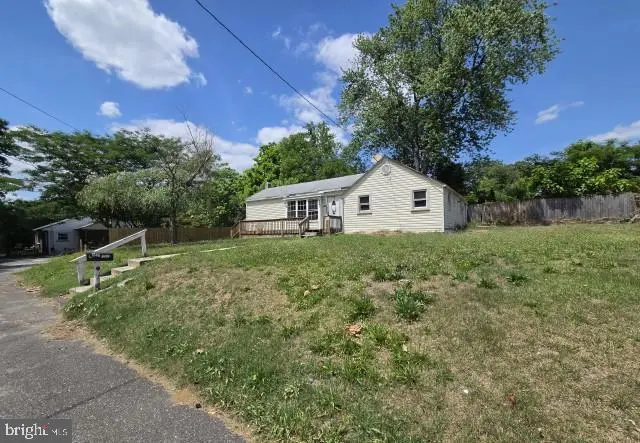
1846 Asbury Ave · Deptford, NJ
Flood risk 1/10 · Minimal
- FEMA flood zone
- X (unshaded)
- Chance of flooding over 30 yrs
- 0.0%
- Est. flood insurance / yr
- $507 – $1,088
Fire risk 2/10 · Minimal
- Est. fire insurance / yr
- $526 – $976
Heat risk 6/10 · Moderate
- Hot days now (above 104°F)
- 7 days/yr
- Hot days in 30 yrs
- 15 days/yr
Wind risk 6/10 · Moderate
- Chance of severe wind over 30 yrs
- 56.0%
Air-quality risk 4/10 · Minor
- Unhealthy air days now
- 4 days/yr
- Unhealthy air days in 30 yrs
- 6 days/yr
Risk factors via First Street. Map © Google.
Why this score? — see what drove the D grade
The composite is a weighted blend of 9 inputs, each scored 0–100. Each bar is that input's sub-score; the figure is the points it added to the 100-point composite (weight × sub-score).
- ARV discount +15.0/15.0
- Cash flow +9.7/30.0
- 1% rule +3.8/10.0
- Schools +2.8/10.0
- DSCR +2.7/10.0
- Rent growth +2.5/5.0
- Livability +2.5/5.0
- Condition / age +2.5/5.0
- Appreciation +0.0/10.0
$200,000
🖨 Deal sheet 📄 Offer letter ✓ Due diligence
Key facts
- Bright living area
- Large yard
- Detached outbuilding
Tags
Property features AI
Exterior
- Parking: Driveway
- Utilities: Public water; Public sewer; Natural gas service
- Home design: Detached property; Fee simple ownership
- Construction: Other foundation type
- Exterior features: Lot approximately 120 x 100; Above-grade and below-grade structures
Interior
- Bedrooms: 2 bedrooms on the main level
- Flooring: Hardwood
- Bathrooms: 1 full bathroom (main level)
- Heating & cooling: Forced air heating; Natural gas hot water
- Interior features: Drywall walls and ceilings; Hardwood floors; Full basement
Neighborhood map
What this means for you Summary
Snapshot
- This is a 2-bed/1.0-bath single-family listed at $200k.
Deal economics
- At list price, monthly cash flow is $-131 ($-2k/yr) — negative.
- To cash-flow at today's rent, offer at most $177k (11.6% below list).
- To meet the 1% rule (rent ≥ 1% of price), the offer needs to be $177k (11.5% below list).
- Recommended offer: $177k (11.6% below list) — sets the bar for cash-flow.
Location & tenants
- Location reads: area grade D — affects rentability + tenant quality, not the cash-flow math above.
- Deptford Township Public School District (suburban): math 17% / reading 45% proficiency, ranked #326 of 472 in NJ (top 69%) — families likely to look elsewhere, expect single-tenant / working-renter base with shorter leases.
- Market conditions: 176 active listings in the ZIP; 4 comparable units currently listed for rent nearby; rentals leasing fast (median 10d on market — plan ~1-2 weeks tenant-placement turnaround); solid renter incomes; 1,047 units permitted in Gloucester County in 2024 (183 in 5+ unit buildings).
Forward outlook
- Local home prices are declining (-3.0%/yr); year-one equity from $1k of loan paydown is wiped out by about $6k of value loss. Plan a longer hold.
- Gloucester County population projected to shrink 5% by 2050 — rents likely to lag national; underwrite the cash flow, not the appreciation.
Negotiation context
- Only 2 days on market — expect competitive offers; lowballing is unlikely to land.
- 3 sale attempts with the ask held roughly flat each time — persistent listings suggest the price (not the market) is what's stuck; bring a comps-based counter.
- Current owner paid $59k; list at $200k implies a 239% gain — meaningful room to come down on a strong offer.
Risks & watch-outs
- Watch-outs: built in 1950 — expect roof / HVAC / electrical / plumbing capex.
- Climate carrying-cost: major wind risk, 56% chance of damaging wind over 30y; extreme-heat days projected 7→15/yr by 2055 (HVAC capex compounding) — expect insurance premiums to compound above CPI over the hold.
Questions for the listing agent
- What do current leases actually rent for vs. the listed asking? Can we see a recent rent roll and the last 12 months of T-12 income?
- Built in 1950 — when were the roof, HVAC, electrical panel, plumbing, and water heater last replaced?
- Is there a deadline driving the sale (1031 exchange, divorce, estate, relocation)? That informs how much negotiation room exists.
- The area grade is low — what's the realistic commute time and amenity access for the typical tenant pool here? Any planned neighborhood developments (good or bad) we should know about?
- What's the average days-on-market for RENTAL listings here right now (not sales)? A rising rental-DOM trend means longer vacancies and softer asking-rent achievability than the comps imply.
- What's the recent tenant-quality profile in this submarket — average credit score on applications, eviction rate, late-payment / NSF rate, and stable-employment percentage? A property-management company in the area should have these aggregated.
- How much new for-sale + rental construction is in the pipeline within 1–3 miles? Heavy new supply typically softens prices + rents 12–24 months out; constrained supply supports both.
Investment metrics
- 1% rule
- 0.88% ✗
- Cap rate
- 5.50%
- Cash-on-cash
- -2.82%
- DSCR
- 0.87
- GRM
- 9.4
CMA / ARV
- ARV (on-the-fly)
- $268,388
- Comps found
- 8
Show comp detail 8 sales within ~0.75 mi
| Address | Dist | Beds/Ba | Sqft | Sold | Price | $/sf | Match |
|---|---|---|---|---|---|---|---|
| 1918 Point Pleasant Ave | 0.16mi | 2/1.0 | 816 (-11%) | 7mo | $265,000 | $325 | 69 |
| 436 Rankin | 0.56mi | 2/1.0 | 940 (+3%) | 2mo | $275,000 | $293 | 68 |
| 77 Cole Lndg | 0.64mi | 2/1.0 | 925 (+1%) | 2mo | $310,000 | $335 | 67 |
| 1923 Rosemore Ave | 0.16mi | 1/1.0 (-1) | 800 (-13%) | 9mo | $200,000 | $250 | 59 |
| 428 Pine Ave | 0.51mi | 2/1.0 | 1,008 (+10%) | 2mo | $275,000 | $273 | 58 |
| 1925 Wynnwood Ave | 0.32mi | 2/1.0 | 816 (-11%) | 19mo | $270,000 | $331 | 51 |
| 439 Pine Ave | 0.50mi | 3/1.0 (+1) | 1,046 (+14%) | 4mo | $215,000 | $206 | 45 |
| 4 Schollcrest Ave | 0.55mi | 3/1.0 (+1) | 1,040 (+14%) | 21mo | $300,000 | $288 | 29 |
Match score weights: distance 35% · size 25% · config 20% · recency 20%. Top-matched comps best support the ARV.
Projected returns pro-forma
-3.0% appreciation · 3.0% rent growth · sell at horizon
- IRR
- -20.9%
- Equity multiple
- 0.27×
- Total profit
- $-40,660
- Equity at exit
- $29,821
- IRR
- -14.1%
- Equity multiple
- 0.18×
- Total profit
- $-45,707
- Equity at exit
- $17,292
Cash invested: $56,000 (down + closing). Projections, not guarantees.
Landlord ↔ Tenant lean methodology
- Overall (STATE)
- 21 Tenant-Leaning
- State New Jersey
- 21 Tenant-Leaning · D+6
- County
- — inherits STATE
- City
- — inherits STATE
ZIP-level market 08096
- Active inventory
- 176
- Price-to-rent
- 9.4×
Monthly cashflow live
- Estimated rent
- $1,769 medium interval (Pro) →
- Mortgage (P&I)
- −$1,049
- Tax from tax record
- −$397 /mo · $4,764/yr
- Insurance
- −$83
- HOA
- −$0
- Vacancy / Maint / Mgmt
- −$372
- Net cashflow
- $-131
Break-even live
UW: 25.0% down · 7.5% · 30yr · 1.5% tax · 5.0% vac · 8.0% maint · 8.0% mgmt
Financing live
Cash to close
- Down payment
- $50,000
- Closing costs
- $6,000
- Reserves months
- —
- Total cash needed
- —
Loan-product check · same deal, 3 products live
Conventional
25% down · 7.5% · 30yr
- Down + closing
- —
- Monthly P&I
- —
- Monthly cashflow
- —
- DSCR
- —
- Eligible?
- —
Personal DTI + credit; lowest rate.
DSCR
20% down · 8.5% · 30yr
- Down + closing
- —
- Monthly P&I
- —
- Monthly cashflow
- —
- DSCR
- —
- Eligible?
- —
No personal income docs; deal must DSCR.
Hard money
10% down · 12.0% · 12mo
- Down + closing
- —
- Monthly P&I
- —
- Monthly cashflow
- —
- DSCR
- —
- Eligible?
- —
Short-term bridge; refi at stabilization.
Rent comps 4 comps
| Address | Beds | Baths | Sqft | Rent | $/sqft | DOM | Units | Dist |
|---|---|---|---|---|---|---|---|---|
| 230 Almonesson Rd Unit A Blackwood, NJ | 2.0 | 1.0 | 900 | $1,900 | $2.11 | 10d | 1 | 1.29mi |
| 590 Lower Landing Rd Blackwood, NJ | 3.0 | 1.0–1.5 | 1030 | $2,087 | $2.03 | 1d | 10 | 1.34mi |
| 227 Washington Ave Apt D2 Blackwood, NJ | 1.0 | 1.0 | 700 | $1,395 | $1.99 | 10d | 1 | 1.40mi |
| 227 Washington Ave Blackwood, NJ | 1.0 | 1.0 | 700 | $1,375 | $1.96 | 1d | 1 | 1.41mi |
Listing history 2 events
-
2026-06-18days on market $200,000 Active 2 DOM
-
2026-06-17$200,000 Active 1 DOM
ⓘ Source: listings_history table (triggers on properties + properties_extension) + one-shot
backfill from property_details.listing_events for pre-trigger history.
Tax reassessment forecast NJ · Partial reset (capped growth)
- Current annual tax
- $4,764 · $397/mo
- Projected year-2 tax
- $4,872 · $406/mo
- Expected delta
- +$108/yr (+$9/mo · 2.3%)
ⓘ Screening estimate from a state-policy table — verify with the county assessor before closing.
Climate risk First Street
- Flood 1/10 Low FEMA zone X (unshaded) · 0% chance over 30 yrs
- Wildfire 2/10 Low
- Heat 6/10 Major 7 d/yr ≥104°F today · 15 d/yr by 30 yrs out
- Wind 6/10 Major 56% chance of damaging wind over 30 yrs
- Air quality 4/10 Moderate 4 unhealthy d/yr today · 6 by 30 yrs out
Nearby sold comps map
Loading sold comps map…
Walkable amenities ~0.75 mi
Loading nearby amenities…
Taxation est. · year 1
- Rental income
- $21,232
- − Mortgage interest
- −$11,203
- − Property taxes
- −$4,764
- − Insurance
- −$1,000
- − Repairs & maintenance
- −$1,699
- − Management
- −$1,699
- − Depreciation
- −$5,818
- Taxable loss
- −$4,951
- Est. tax savings @ 24.0%
- +$1,188
- After-tax cash flow
- $-389/yr
For passive investors: Depreciation is non-cash, so a rental often shows a tax loss while cash-flowing — sheltering income. Rental losses are passive: they offset passive income freely, and up to $25,000/yr can offset ordinary (W-2) income if you actively participate and your MAGI is under $100k (phasing out to $0 by $150k); unused losses carry forward. On sale, claimed depreciation is recaptured at up to 25%, and gains may owe capital-gains tax (a 1031 exchange can defer both). Figures are a year-1 estimate at your 24.0% rate — not tax advice; consult a CPA.
Schools (NCES district)
- District
- Deptford Township Public School District
- NCES district ID
- 3403900
- Math proficiency
- 17% ▼ -24.00%
- Reading proficiency
- 45% ▼ -5.00%
- Median HH income
- $66,302
- Composite
- 28.48/100
- National rank
- #6741
- State rank
- #326 of 472 in NJ
Livability — Deptford
No livability data for this city. (Only ~50 U.S. cities are tracked.)
Census & demographics
- County
- Gloucester County · 160,422 people
- Metro
- Philadelphia-Camden-Wilmington, PA-NJ-DE-MD
- Population (ZIP)
- 35,336
- Household income
- $89,013
- Rent vs Own
- Severe rent burden
- 1044.0
Population outlook (Gloucester County) Hauer SSP2
- Today (2025)
- 298,895 people
- By 2030
- 299,031 · +0.0%
- By 2040
- 294,020 · -1.6%
- By 2050
- 284,188 · -4.9%
- By 2075
- 260,720 · -12.8%
- By 2100
- 229,565 · -23.2%
Race, ethnicity, and origin ACS 2023
- Neighborhood character
- Predominantly White (66%)
- Race & ethnicity
- White 66% Hispanic / Latino 13% Black 12% Two or more races 10% Asian 3%
- Hispanic origin (detail)
- Mexican 3% Puerto Rican 5% Dominican 1%
- Common ancestry
- Romanian 4% Lithuanian 1% Iranian 1%
- Foreign-born
- 8% · Canada, China, South Korea
- Languages at home
- 86% English-only · Spanish 9% Other Indo-European 2% Other Asian/Pacific 1%
Political lean MEDSL · Gloucester
- 2024 margin
- Toss-up / Even · D 47.8% · R 50.6% · Other 1.6%
- 2008→2024 swing
- -15.0pp toward R · 2008: 12.2pp · 2024: -2.8pp
- All cycles
- 2024: R+2.8 2020: D+1.9 2016: R+0.4 2012: D+10.5 2008: D+12.2
Not yet ingested
- Civics
- —
Market trends
- HPI YoY
- ▼ -239.24%
- Current HPI
- 269.1606
- Rent YoY
- —
- Metro
- Philadelphia-Camden-Wilmington, PA-NJ-DE-MD
- State GDP YoY
- ▲ 2.05%
- F500 in state
- 34
Industry mix (Fortune 500 HQ in NJ)
| Industry | F500 HQs | Revenue |
|---|---|---|
| Consumer Goods | 3 | $31B |
|
||
| Pharmaceuticals | 2 | $153B |
|
||
| Technology | 2 | $21B |
|
||
| Insurance | 2 | $20B |
|
||
| Healthcare | 2 | $19B |
|
||
| Financial Services | 1 | $70B |
|
||
Price history
+239.0% since first listed6 events — show timeline
- 2026-06-16 Listed $200,000 BRIGHT MLS
- 2025-11-12 Listing Removed — BRIGHT MLS
- 2025-11-10 Relisted — BRIGHT MLS
- 2025-11-09 Listing Removed — BRIGHT MLS
- 2025-11-07 Listed $195,000 BRIGHT MLS
- 1986-11-17 Sold (Public Records) $59,000 Public Records
Property tax history
+2.5%/yrLatest (2025): $4,764 · +2.1% YoY. Source: county tax records.
Cash-flow waterfall
monthlySold comps — $/sqft
last 12 mo · ≤1 miLoading sold comps…