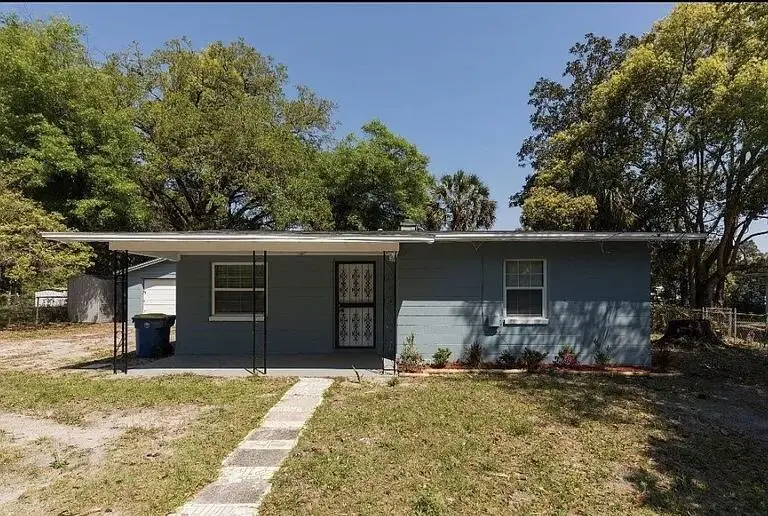
2513 Spirea St · Jacksonville, FL
Flood risk 1/10 · Minimal
- FEMA flood zone
- X (unshaded)
- Chance of flooding over 30 yrs
- 0.0%
- Est. flood insurance / yr
- $507 – $1,088
Fire risk 1/10 · Minimal
- Est. fire insurance / yr
- $947 – $1,759
Heat risk 9/10 · Severe
- Hot days now (above 107°F)
- 7 days/yr
- Hot days in 30 yrs
- 20 days/yr
Wind risk 9/10 · Severe
- Chance of severe wind over 30 yrs
- 99.0%
Air-quality risk 4/10 · Minor
- Unhealthy air days now
- 6 days/yr
- Unhealthy air days in 30 yrs
- 6 days/yr
Risk factors via First Street. Map © Google.
Why this score? — see what drove the D- grade
The composite is a weighted blend of 9 inputs, each scored 0–100. Each bar is that input's sub-score; the figure is the points it added to the 100-point composite (weight × sub-score).
- Cash flow +13.3/30.0
- 1% rule +4.5/10.0
- Livability +4.2/5.0
- DSCR +4.0/10.0
- Schools +3.9/10.0
- Rent growth +3.0/5.0
- Condition / age +2.5/5.0
- ARV discount +0.0/15.0
- Appreciation +0.0/10.0
$120,000
🖨 Deal sheet (PDF) 📄 Offer letter ✓ Due diligence
Listing remarks
Charming and full of potential, this 2-bedroom, 1-bathroom single-family home offers comfort, space, and opportunity. Inside, you'll find a bright and inviting layout with cozy living areas and well-sized bedrooms, perfect for everyday living or a smart investment. Step outside to a spacious, fully fenced backyard—ideal for pets, entertaining, or simply enjoying your own private outdoor retreat. With plenty of room to add a pool, the yard offers endless possibilities to create your dream oasis. Whether you're a first-time buyer or looking to downsize, this property delivers a great combination of functionality and future potential. Conveniently located near shopping, dining, and local
Key facts
- 9,244 sq ft lot
- Garage
- Built 1953
Property features AI
Finance
- Other: Pets allowed with no restrictions
Exterior
- Parking: Detached garage (1 garage space); Total 2 parking spaces (1 covered)
- Utilities: Public water; Public sewer; Electricity connected; Cable available
- Home design: Single-family home; One story; Front entry; Faces south; Resale condition; Entry level: 1
- Construction: Concrete construction; Shingle roof; Block foundation; Built as one-story structure
- Exterior features: Open front porch; Fenced front yard; Not waterfront
Interior
- Kitchen: Refrigerator
- Bedrooms: One main-level bedroom
- Flooring: Laminate flooring
- Bathrooms: One full bathroom
- Heating & cooling: Window/wall heating; Wall/window cooling units
- Interior features: Split bedroom layout; Unfurnished
- Laundry & utility: Washer/dryer not specified
Neighborhood map
What this means for you Summary
Snapshot
- This is a 2-bed/1.0-bath single-family listed at $120k.
Deal economics
- At list price, monthly cash flow is $1 ($11/yr) — positive.
- The deal already cash-flows at list — no discount required.
- To meet the 1% rule (rent ≥ 1% of price), the offer needs to be $114k (5.0% below list).
- Recommended offer: $114k (5.0% below list) — sets the bar for 1% rule.
- Cap rate 6.3% vs local median 3.9% in Jacksonville — top-decile yield for the area; either an underpriced asset or a hidden risk that comps aren't pricing in. Stress-test before assuming the spread holds.
Location & tenants
- Location reads 83/100 on livability (#50 in FL, #911 nationally) — a professional / high-income tenant draw. Strengths: amenities A+, commute A+, housing A+.
- Duval (urban): math 46% / reading 45% proficiency, ranked #48 of 73 in FL (top 66%) — families likely to look elsewhere, expect single-tenant / working-renter base with shorter leases.
- Zoned schools: Grasp Academy (math 18% / reading 14%, grade F, #2,130 of 2,144 statewide, top 99%, 271 students, 52% FRL); Joseph Stilwell Middle School (math 31% / reading 33%, grade F, #448 of 571 statewide, top 79%, 612 students, 68% FRL); William M. Raines High School (math 14% / reading 13%, grade F, #616 of 667 statewide, top 92%, 1,217 students, 78% FRL) — zoned schools average 66% FRL vs 49% district-wide (17 pts higher); higher-poverty schools than district average — tighter screening recommended.
- Zoned-school proficiency averages 20% at this address vs 46% district-wide (-25 pts) — the specific schools serving this property underperform the Duval average; the district grade overstates school quality for this exact location.
- Market conditions: Rents rising (+1.8%/yr); 399 active listings in the ZIP; 40 comparable units currently listed for rent nearby; rentals at typical pace (median 26d on market — plan ~3-4 weeks tenant-placement turnaround); lower-income renter base — watch delinquency; 6,503 units permitted in Duval County in 2024 (1,131 in 5+ unit buildings).
- This rent runs 45% of the median local income ($31k/yr) — at the standard rent-burdened threshold; future hikes will face affordability resistance.
Forward outlook
- Local home prices are declining (-3.0%/yr); year-one equity from $830 of loan paydown is wiped out by about $4k of value loss. Plan a longer hold.
- Duval County population projected at +19% by 2050 — long-run rental-demand tailwind backs the buy-and-hold thesis.
Negotiation context
- It's been on market 41 days — a 3% lower offer ($116k) is reasonable based on typical stale-listing flexibility.
- 8 sale attempts since 5y ago; this cycle's ask is 9202% above the opening price — seller raised mid-cycle; expect resistance to lowballs.
Risks & watch-outs
- Watch-outs: built in 1953 — expect roof / HVAC / electrical / plumbing capex.
- Climate carrying-cost: severe wind risk, 99% chance of damaging wind over 30y; extreme-heat days projected 7→20/yr by 2055 (HVAC capex compounding) — expect insurance premiums to compound above CPI over the hold.
Questions for the listing agent
- It's been on market 41 days. Have you received any prior offers? Is the seller open to a 5% concession, seller financing, or rate buy-down credit?
- Built in 1953 — when were the roof, HVAC, electrical panel, plumbing, and water heater last replaced?
- Is there a deadline driving the sale (1031 exchange, divorce, estate, relocation)? That informs how much negotiation room exists.
- Schools are B-rated — typically a magnet for longer-tenancy family renters. What's the average tenant stay here, and is there a school-zone premium baked into asking?
- The area grade is low — what's the realistic commute time and amenity access for the typical tenant pool here? Any planned neighborhood developments (good or bad) we should know about?
- What's the average days-on-market for RENTAL listings here right now (not sales)? A rising rental-DOM trend means longer vacancies and softer asking-rent achievability than the comps imply.
- What's the recent tenant-quality profile in this submarket — average credit score on applications, eviction rate, late-payment / NSF rate, and stable-employment percentage? A property-management company in the area should have these aggregated.
- How much new for-sale + rental construction is in the pipeline within 1–3 miles? Heavy new supply typically softens prices + rents 12–24 months out; constrained supply supports both.
Investment metrics
- 1% rule
- 0.95% ✗
- Cap rate
- 6.30%
- Cash-on-cash
- 0.03%
- DSCR
- 1.00
- GRM
- 8.8
CMA / ARV
- ARV (on-the-fly)
- $101,352
- Comps found
- 12
Show comp detail 12 sales within ~0.75 mi
| Address | Dist | Beds/Ba | Sqft | Sold | Price | $/sf | Match |
|---|---|---|---|---|---|---|---|
| 2570 Spirea St | 0.11mi | 2/1.0 | 824 (0%) | 4mo | $90,000 | $109 | 91 |
| 3332 Japonica Rd N | 0.04mi | 3/1.0 (+1) | 828 (+0%) | 2mo | $103,500 | $125 | 91 |
| 2312 Lantana Ave | 0.16mi | 3/1.0 (+1) | 844 (+2%) | 12mo | $79,000 | $94 | 73 |
| 6151 Ardisia Rd | 0.24mi | 3/1.0 (+1) | 892 (+8%) | 2mo | $128,000 | $143 | 68 |
| 2736 Lippia Rd | 0.51mi | 3/1.0 (+1) | 856 (+4%) | 0mo | $62,500 | $73 | 64 |
| 4105 Katanga Dr N | 0.55mi | 3/1.0 (+1) | 874 (+6%) | 1mo | $122,500 | $140 | 58 |
| 2603 Sunny Acres Dr N | 0.62mi | 3/1.0 (+1) | 854 (+4%) | 4mo | $105,000 | $123 | 56 |
| 6601 Cleveland Rd | 0.73mi | 3/1.0 (+1) | 896 (+9%) | 2mo | $82,500 | $92 | 44 |
| 4158 Lockhart Dr | 0.63mi | 3/1.0 (+1) | 888 (+8%) | 12mo | $145,000 | $163 | 43 |
| 5545 Silverdale Ave | 0.61mi | 3/1.0 (+1) | 890 (+8%) | 12mo | $150,000 | $169 | 42 |
| 6645 Cleveland Rd | 0.74mi | 3/1.0 (+1) | 888 (+8%) | 6mo | $105,000 | $118 | 42 |
| 5342 Mays Dr | 0.74mi | 3/1.0 (+1) | 900 (+9%) | 4mo | $74,500 | $83 | 42 |
Match score weights: distance 35% · size 25% · config 20% · recency 20%. Top-matched comps best support the ARV.
Projected returns pro-forma
-3.0% appreciation · 1.81% rent growth · sell at horizon
- IRR
- -17.7%
- Equity multiple
- 0.38×
- Total profit
- $-20,675
- Equity at exit
- $17,892
- IRR
- -12.3%
- Equity multiple
- 0.31×
- Total profit
- $-23,087
- Equity at exit
- $10,375
Cash invested: $33,600 (down + closing). Projections, not guarantees.
Landlord ↔ Tenant lean methodology
- Overall (STATE)
- 87 Strongly Landlord-Friendly
- State Florida
- 87 Strongly Landlord-Friendly · R+3
- County
- — inherits STATE
- City
- — inherits STATE
ZIP-level market 32209
- Home prices YoY
- -22.1%
- Rents YoY
- 1.8%
- Active inventory
- 399
- Price-to-rent
- 8.8×
Monthly cashflow live
- Estimated rent
- $1,140 high interval (Pro) →
- Mortgage (P&I)
- −$629
- Tax from tax record
- −$221 /mo · $2,649/yr
- Insurance
- −$50
- HOA
- −$0
- Vacancy / Maint / Mgmt
- −$239
- Net cashflow
- $1
Break-even live
Sensitivity live
| Price | -10% $69 | -5% $35 | +0% $1 | +5% $-33 | +10% $-67 |
|---|---|---|---|---|---|
| Rent | -10% $-89 | -5% $-44 | +0% $1 | +5% $46 | +10% $91 |
| Rate | -1.0pp $61 | -0.5pp $31 | base $1 | +0.5pp $-30 | +1.0pp $-62 |
UW: 25.0% down · 7.5% · 30yr · 1.5% tax · 5.0% vac · 8.0% maint · 8.0% mgmt
Financing live
Cash to close
- Down payment
- $30,000
- Closing costs
- $3,600
- Reserves months
- —
- Total cash needed
- —
Loan-product check · same deal, 3 products live
Conventional
25% down · 7.5% · 30yr
- Down + closing
- —
- Monthly P&I
- —
- Monthly cashflow
- —
- DSCR
- —
- Eligible?
- —
Personal DTI + credit; lowest rate.
DSCR
20% down · 8.5% · 30yr
- Down + closing
- —
- Monthly P&I
- —
- Monthly cashflow
- —
- DSCR
- —
- Eligible?
- —
No personal income docs; deal must DSCR.
Hard money
10% down · 12.0% · 12mo
- Down + closing
- —
- Monthly P&I
- —
- Monthly cashflow
- —
- DSCR
- —
- Eligible?
- —
Short-term bridge; refi at stabilization.
Rent comps 40 comps
| Address | Beds | Baths | Sqft | Rent | $/sqft | DOM | Units | Dist |
|---|---|---|---|---|---|---|---|---|
| 6114 Strawflower Pl Jacksonville, FL | 3.0 | 1.0 | 1030 | $1,200 | $1.17 | 25d | 1 | 0.24mi |
| 2185 Benedict Rd Unit 2187 Jacksonville, FL | 2.0 | 1.0 | 630 | $995 | $1.58 | 12d | 1 | 0.43mi |
| 2185 Benedict Rd Jacksonville, FL | 2.0 | 1.0 | 630 | $995 | $1.58 | 25d | 1 | 0.43mi |
| 4144 Katanga Dr N Jacksonville, FL | 3.0 | 1.0 | 1114 | $1,095 | $0.98 | 25d | 1 | 0.58mi |
| 2092 Benedict Rd Jacksonville, FL | 3.0 | 1.0 | 816 | $1,095 | $1.34 | 25d | 1 | 0.58mi |
| 5531 Agra Ct Jacksonville, FL | 3.0 | 1.0 | 988 | $1,295 | $1.31 | 16d | 1 | 0.59mi |
| 6601 Cleveland Rd Jacksonville, FL | 3.0 | 1.0 | 896 | $1,400 | $1.56 | 25d | 1 | 0.71mi |
| 3997 Leonnie Rd Unit 1 Jacksonville, FL | 2.0 | 1.0 | 840 | $950 | $1.13 | 9d | 1 | 0.71mi |
| 4294 Katanga Dr N Jacksonville, FL | 3.0 | 1.0 | 864 | $1,450 | $1.68 | 25d | 1 | 0.73mi |
| 4211 Moncrief Rd W Unit 2 Jacksonville, FL | 2.0 | 1.0 | 840 | $995 | $1.18 | 25d | 1 | 0.74mi |
| 4236 Homer Rd N Jacksonville, FL | 3.0 | 1.0 | 888 | $1,250 | $1.41 | 13d | 1 | 0.75mi |
| 5326 Mays Dr Jacksonville, FL | 3.0 | 1.0 | 900 | $1,200 | $1.33 | 25d | 1 | 0.77mi |
| 5428 Bunche Dr Jacksonville, FL | 3.0 | 1.0 | 900 | $1,600 | $1.78 | 25d | 1 | 0.78mi |
| 2268 W 44th St Jacksonville, FL | 3.0 | 2.0 | 1077 | $1,440 | $1.34 | 6d | 1 | 0.79mi |
| 4177 Lorenzo Ct Unit 4 Jacksonville, FL | 2.0 | 1.0 | 840 | $945 | $1.12 | 3d | 1 | 0.81mi |
| 5217 Mays Dr Jacksonville, FL | 3.0 | 1.0 | 900 | $1,250 | $1.39 | 9d | 1 | 0.81mi |
| 4253 Moncrief Rd W Unit 2 Jacksonville, FL | 2.0 | 1.0 | 840 | $975 | $1.16 | 25d | 1 | 0.83mi |
| 2312 Palmdale St Jacksonville, FL | 3.0 | 2.0 | 972 | $1,231 | $1.27 | 25d | 1 | 0.84mi |
| 5306 Paris Ave Jacksonville, FL | 3.0 | 1.0 | 944 | $1,150 | $1.22 | 25d | 1 | 0.85mi |
| 5035 Campenella Dr Jacksonville, FL | 3.0 | 1.0 | 875 | $1,095 | $1.25 | 25d | 1 | 0.88mi |
| 1959 W 45th St Jacksonville, FL | 2.0 | 1.0 | 895 | $1,245 | $1.39 | 16d | 1 | 0.96mi |
| 2171 W 40th St Jacksonville, FL | 2.0 | 1.0 | 700 | $950 | $1.36 | 25d | 1 | 1.01mi |
| 4440 Ken Knight Dr N Jacksonville, FL | 2.0 | 1.0 | 716 | $650 | $0.91 | 16d | 1 | 1.01mi |
| 4543 Moncrief Rd W Jacksonville, FL | 2.0 | 1.0 | 950 | $1,075 | $1.13 | 9d | 1 | 1.03mi |
| 2221 W 39th St Jacksonville, FL | 2.0 | 1.0 | 675 | $800 | $1.19 | 25d | 1 | 1.03mi |
| 5736 Teeler Ave Jacksonville, FL | 3.0 | 1.0 | 852 | $1,000 | $1.17 | 25d | 1 | 1.07mi |
| 2050 W 40th St Jacksonville, FL | 3.0 | 1.0 | 1010 | $1,350 | $1.34 | 18d | 1 | 1.10mi |
| 1975 Rugby Rd Jacksonville, FL | 2.0 | 1.0 | 992 | $1,100 | $1.11 | 9d | 1 | 1.11mi |
| 4655 Ken Knight Dr N Jacksonville, FL | 2.0 | 1.0 | 646 | $600 | $0.93 | 25d | 1 | 1.14mi |
| 1823 W 44th St Jacksonville, FL | 3.0 | 2.0 | 1066 | $1,500 | $1.41 | 25d | 1 | 1.15mi |
| 1567 Rutledge Ave Jacksonville, FL | 3.0 | 2.0 | 1050 | $1,113 | $1.06 | 25d | 1 | 1.15mi |
| 1803 W 44th St Unit 1803 Jacksonville, FL | 2.0 | 1.0 | 750 | $950 | $1.27 | 9d | 1 | 1.16mi |
| 5352 Dodge Rd Jacksonville, FL | 3.0 | 2.0 | 1050 | $1,261 | $1.20 | 25d | 1 | 1.20mi |
| 5350 Dodge Rd Jacksonville, FL | 3.0 | 1.0 | 1000 | $1,500 | $1.50 | 25d | 1 | 1.21mi |
| 1536 W 45th St Jacksonville, FL | 2.0 | 1.0 | 800 | $1,050 | $1.31 | 25d | 1 | 1.32mi |
| 5355 New Kings Rd Unit 24 Jacksonville, FL | 1.0 | 1.0 | 600 | $700 | $1.17 | 9d | 1 | 1.38mi |
| 5355 New Kings Rd Unit 21 Jacksonville, FL | 2.0 | 1.0 | 700 | $800 | $1.14 | 6d | 1 | 1.38mi |
| 5355 New Kings Rd Unit 10 Jacksonville, FL | 2.0 | 1.0 | 528 | $775 | $1.47 | 25d | 1 | 1.44mi |
| 3516 Penton St Jacksonville, FL | 3.0 | 1.0 | 1000 | $1,350 | $1.35 | 25d | 1 | 1.46mi |
| 2540 W 25th St Jacksonville, FL | 3.0 | 1.5 | 854 | $1,295 | $1.52 | 16d | 1 | 1.50mi |
Listing history 44 events
-
2026-06-21days on market $120,000 Active 41 DOM
-
2026-06-18days on market $120,000 Active 38 DOM
-
2026-06-17pricedays on market $120,000 Active 37 DOM
-
2026-06-16days on market $140,000 Active 36 DOM
-
2026-06-15days on market $140,000 Active 35 DOM
-
2026-06-13days on market $140,000 Active 32 DOM
-
2026-06-10days on market $140,000 Active 29 DOM
-
2026-06-08days on market $140,000 Active 28 DOM
-
2026-06-07days on market $140,000 Active 27 DOM
-
2026-06-05days on market $140,000 Active 24 DOM
-
2026-06-03days on market $140,000 Active 23 DOM
-
2026-06-02days on market $140,000 Active 22 DOM
-
2026-06-01days on market $140,000 Active 21 DOM
-
2026-05-31days on market $140,000 Active 20 DOM
-
2026-05-15historical $1,290
-
2026-05-13$1,290
-
2026-05-11$140,000 Active
-
2025-07-26historical $1,200
-
2025-06-10$1,200
-
2024-03-26historical $1,250
-
2024-03-08price $1,250
-
2024-03-01historical
-
2024-02-23$1,300
-
2024-01-31historical
-
2024-01-26soldstatus $110,000
-
2023-12-12price $110,000
-
2023-10-23price $145,000
-
2023-10-12price $155,000
-
2023-09-14price $170,000
-
2023-07-25$175,000 Active
-
2023-07-21$179,000 Active
-
2022-06-23soldstatus $127,000
-
2022-05-30price $1,000
-
2022-05-26soldstatus $127,000 Sold
-
2022-04-16status Pending
-
2022-04-07price $138,000
-
2022-04-06$133,000 Active
-
2021-12-07soldstatus $55,000
-
2021-11-17soldstatus $55,000 Sold
-
2021-11-03status Pending
-
2021-10-28price $59,000
-
2021-10-11price $65,000
-
2021-10-04$69,000 Active
-
2017-01-27soldstatus $20,000
ⓘ Source: listings_history table (triggers on properties + properties_extension) + one-shot
backfill from property_details.listing_events for pre-trigger history.
Tax reassessment forecast FL · Resets to sale price
- Current annual tax
- $2,649 · $221/mo
- Projected year-2 tax
- $2,649 · $221/mo
- Expected delta
- $0/yr ($0/mo · 0.0%)
ⓘ Screening estimate from a state-policy table — verify with the county assessor before closing.
Climate risk First Street
- Flood 1/10 Low FEMA zone X (unshaded) · 0% chance over 30 yrs
- Wildfire 1/10 Low
- Heat 9/10 Extreme 7 d/yr ≥107°F today · 20 d/yr by 30 yrs out
- Wind 9/10 Extreme 99% chance of damaging wind over 30 yrs
- Air quality 4/10 Moderate 6 unhealthy d/yr today · 6 by 30 yrs out
Nearby sold comps map
Loading sold comps map…
Walkable amenities ~0.75 mi
Loading nearby amenities…
Taxation est. · year 1
- Rental income
- $13,685
- − Mortgage interest
- −$6,722
- − Property taxes
- −$2,649
- − Insurance
- −$600
- − Repairs & maintenance
- −$1,095
- − Management
- −$1,095
- − Depreciation
- −$3,491
- Taxable loss
- −$1,966
- Est. tax savings @ 24.0%
- +$472
- After-tax cash flow
- $483/yr
For passive investors: Depreciation is non-cash, so a rental often shows a tax loss while cash-flowing — sheltering income. Rental losses are passive: they offset passive income freely, and up to $25,000/yr can offset ordinary (W-2) income if you actively participate and your MAGI is under $100k (phasing out to $0 by $150k); unused losses carry forward. On sale, claimed depreciation is recaptured at up to 25%, and gains may owe capital-gains tax (a 1031 exchange can defer both). Figures are a year-1 estimate at your 24.0% rate — not tax advice; consult a CPA.
Schools (NCES district)
- District
- Duval
- NCES district ID
- 1200480
- Math proficiency
- 46% ▼ -11.00%
- Reading proficiency
- 45% ▼ -4.00%
- Median HH income
- $48,987
- Composite
- 38.97/100
- National rank
- #4076
- State rank
- #48 of 73 in FL
Livability — Jacksonville
- Score
- 83/100
- State rank
- #50
- US rank
- #911
Category grades
Schools grade is shown separately in the Schools card above.
Census & demographics
- Census place
- Jacksonville, FL
- County
- Duval County · 1,015,274 people
- City population
- 979,034
- Metro
- Jacksonville, FL
- Population (ZIP)
- 34,657
- Household income
- $30,514
- Rent vs Own
- Severe rent burden
- 2921.0
Population outlook (Duval County) Hauer SSP2
- Today (2025)
- 1,013,010 people
- By 2030
- 1,059,228 · +4.6%
- By 2040
- 1,141,439 · +12.7%
- By 2050
- 1,205,258 · +19.0%
- By 2075
- 1,324,282 · +30.7%
- By 2100
- 1,319,620 · +30.3%
Race, ethnicity, and origin ACS 2023
- Neighborhood character
- Predominantly Black (88%)
- Race & ethnicity
- Black 88% White 5% Hispanic / Latino 5% Two or more races 2%
- Hispanic origin (detail)
- Puerto Rican 3%
- Common ancestry
- Hispanic 1% Romanian 1%
- Foreign-born
- 3% · Canada
- Languages at home
- 95% English-only · Spanish 4% French/Haitian/Cajun 1%
Political lean MEDSL · Duval
- 2024 margin
- Toss-up / Even · D 48.7% · R 50.1% · Other 1.2%
- 2008→2024 swing
- +0.4pp no change · 2008: -1.9pp · 2024: -1.5pp
- All cycles
- 2024: R+1.5 2020: D+3.8 2016: R+1.5 2012: R+3.6 2008: R+1.9
Not yet ingested
- Civics
- —
Market trends
- HPI YoY
- ▼ -53.92%
- Current HPI
- 189.5977
- Rent YoY
- ▲ 1.81%
- Metro
- Jacksonville, FL
- State GDP YoY
- ▲ 3.28%
- F500 in state
- 36
Industry mix (Fortune 500 HQ in FL)
| Industry | F500 HQs | Revenue |
|---|---|---|
| Industrial Technology | 2 | $29B |
|
||
| Insurance | 2 | $17B |
|
||
| Retail | 1 | $60B |
|
||
| Technology Distribution | 1 | $58B |
|
||
| Homebuilding | 1 | $35B |
|
||
| Technology Manufacturing | 1 | $35B |
|
||
Price history
-93.5% since first listed30 events — show timeline
- 2026-05-15 Rental Removed $1,290 BUILDIUM
- 2026-05-13 Listed for Rent $1,290 BUILDIUM
- 2026-05-11 Listed $140,000 Beaches MLS
- 2025-07-26 Rental Removed $1,200 BUILDIUM
- 2025-06-10 Listed for Rent $1,200 BUILDIUM
- 2024-03-26 Rental Removed $1,250 BUILDIUM
- 2024-03-08 Price Changed $1,250 BUILDIUM
- 2024-03-01 Listing Removed — realMLS
- 2024-02-23 Listed for Rent $1,300 BUILDIUM
- 2024-01-31 Listing Removed — MARMLS
- 2024-01-26 Sold (Public Records) $110,000 Public Records
- 2023-12-12 Price Changed $110,000 MARMLS
- 2023-10-23 Price Changed $145,000 MARMLS
- 2023-10-12 Price Changed $155,000 MARMLS
- 2023-09-14 Price Changed $170,000 MARMLS
- 2023-07-25 Listed $175,000 realMLS
- 2023-07-21 Listed $179,000 MARMLS
- 2022-06-23 Sold (Public Records) $127,000 Public Records
- 2022-05-30 Price Changed $1,000 RENT.
- 2022-05-26 Sold (MLS) $127,000 realMLS
- 2022-04-16 Pending — realMLS
- 2022-04-07 Price Changed $138,000 realMLS
- 2022-04-06 Listed $133,000 realMLS
- 2021-12-07 Sold (Public Records) $55,000 Public Records
- 2021-11-17 Sold (MLS) $55,000 realMLS
- 2021-11-03 Pending — realMLS
- 2021-10-28 Price Changed $59,000 realMLS
- 2021-10-11 Price Changed $65,000 realMLS
- 2021-10-04 Listed $69,000 realMLS
- 2017-01-27 Sold (Public Records) $20,000 Public Records
Property tax history
+22.7%/yrLatest (2025): $2,649 · +2.6% YoY. Source: county tax records.
Cash-flow waterfall
monthlySold comps — $/sqft
last 12 mo · ≤1 miLoading sold comps…