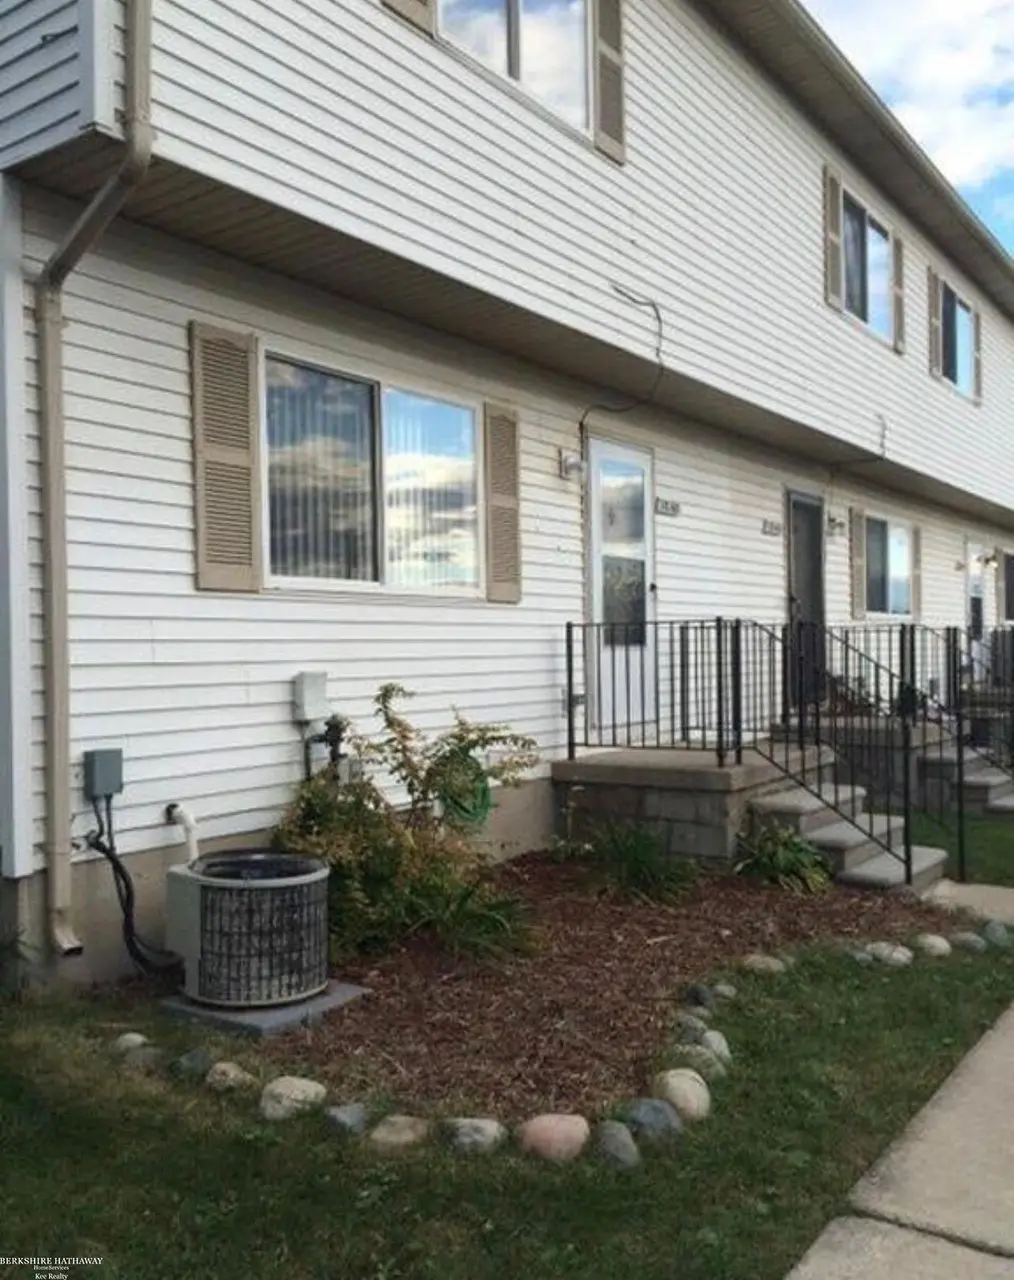
28165 Raleigh Crescent Dr · Chesterfield, MI
Flood risk 1/10 · Minimal
- FEMA flood zone
- X (unshaded)
- Chance of flooding over 30 yrs
- 0.0%
- Est. flood insurance / yr
- $507 – $1,088
Fire risk 1/10 · Minimal
- Est. fire insurance / yr
- $784 – $1,456
Heat risk 3/10 · Minor
- Hot days now (above 96°F)
- 7 days/yr
- Hot days in 30 yrs
- 15 days/yr
Wind risk 1/10 · Minimal
- Chance of severe wind over 30 yrs
- —
Air-quality risk 4/10 · Minor
- Unhealthy air days now
- 4 days/yr
- Unhealthy air days in 30 yrs
- 5 days/yr
Risk factors via First Street. Map © Google.
Why this score? — see what drove the D- grade
The composite is a weighted blend of 9 inputs, each scored 0–100. Each bar is that input's sub-score; the figure is the points it added to the 100-point composite (weight × sub-score).
- Cash flow +12.0/30.0
- ARV discount +7.5/15.0
- 1% rule +5.6/10.0
- Schools +3.6/10.0
- DSCR +3.5/10.0
- Rent growth +2.5/5.0
- Livability +2.5/5.0
- Condition / age +2.5/5.0
- Appreciation +0.0/10.0
$139,000
🖨 Deal sheet 📄 Offer letter ✓ Due diligence
Listing remarks MLS
Beautiful updated condo. Full basement, appliances included. For sale, not a short sale. New carpet.
Key facts
- Full basement
- Dedicated carport
- $240 HOA
Tags
Property features AI
Finance
- Other: Pets allowed (call for pet restrictions)
- HOA & community: Monthly association fee of $240; Association covers water and sewer; Grounds maintenance provided by association; Association: O'Brien Investerments (contact available)
Exterior
- Parking: Covered parking; Carport; One parking space in garage/carport
- Utilities: Public water; Public sanitary sewer; Electric service (standard); Gas water heater
- Home design: Condominium; 2-story; Built in 2001; Below-grade area (unfinished) approximately 500
- Construction: Brick construction; Basement foundation
- Exterior features: Brick exterior construction; Private roads maintained by association; Residential zoning
Interior
- Kitchen: Kitchen on first floor (approx. 12 x 11); Breakfast nook on first floor (approx. 11 x 10); Vinyl kitchen flooring; Range/Oven; Dishwasher
- Bedrooms: Primary bedroom on second floor (approx. 18 x 14) with carpet; Second bedroom on second floor (approx. 14 x 11) with carpet
- Flooring: Carpet in living room and bedrooms; Vinyl in kitchen
- Bathrooms: One full bathroom; Two lavatories total; Bathroom and lavatory locations on first and second floors
- Heating & cooling: Forced air heating; Central A/C; Natural gas heat/fuel; Gas water heater
- Interior features: Cable/Internet available; First floor laundry; Living room; Dining room in an L-shape
- Laundry & utility: Washer and dryer; First floor laundry; Unfinished basement (has basement)
Neighborhood map
What this means for you Summary
Snapshot
- This is a 2-bed/1.5-bath condo listed at $139k.
Deal economics
- At list price, monthly cash flow is $-33 ($-395/yr) — negative.
- To cash-flow at today's rent, offer at most $134k (3.4% below list).
- Meets the 1% rule at list price ($1k rent vs $139k).
- Recommended offer: $134k (3.4% below list) — sets the bar for cash-flow.
Location & tenants
- Location reads: area grade D — affects rentability + tenant quality, not the cash-flow math above.
- L'Anse Creuse Public Schools (suburban): math 31% / reading 51% proficiency, ranked #184 of 540 in MI (top 34%) — families likely to look elsewhere, expect single-tenant / working-renter base with shorter leases.
- Market conditions: 140 active listings in the ZIP; 21 comparable units currently listed for rent nearby; rentals leasing fast (median 2d on market — plan ~1-2 weeks tenant-placement turnaround); 1,321 units permitted in Macomb County in 2024 (86 in 5+ unit buildings).
Forward outlook
- Local home prices are declining (-3.0%/yr); year-one equity from $961 of loan paydown is wiped out by about $4k of value loss. Plan a longer hold.
- Macomb County population projected at +9% by 2050 — modest demand growth; plan on rents tracking national, not racing it.
Negotiation context
- Only 4 days on market — expect competitive offers; lowballing is unlikely to land.
- 3 sale attempts since 11y ago with the ask held roughly flat each time — persistent listings suggest the price (not the market) is what's stuck; bring a comps-based counter.
- Current owner paid $53k; list at $139k implies a 162% gain — meaningful room to come down on a strong offer.
Questions for the listing agent
- What do current leases actually rent for vs. the listed asking? Can we see a recent rent roll and the last 12 months of T-12 income?
- What does the HOA fee cover, when was the last increase, and are there any pending special assessments or reserve-fund shortfalls?
- Any open or pending special assessments — roof, HVAC, plumbing, elevator, façade? What's the per-unit balance and payoff schedule, and is the seller paying it off at close or rolling it to the buyer?
- Is there a deadline driving the sale (1031 exchange, divorce, estate, relocation)? That informs how much negotiation room exists.
- The area grade is low — what's the realistic commute time and amenity access for the typical tenant pool here? Any planned neighborhood developments (good or bad) we should know about?
- What's the average days-on-market for RENTAL listings here right now (not sales)? A rising rental-DOM trend means longer vacancies and softer asking-rent achievability than the comps imply.
- What's the recent tenant-quality profile in this submarket — average credit score on applications, eviction rate, late-payment / NSF rate, and stable-employment percentage? A property-management company in the area should have these aggregated.
- How much new apartment / multifamily construction is in the pipeline within 1–3 miles? Heavy new supply (>2% of stock underway) typically softens rents 12–24 months out; light construction supports rent growth.
Investment metrics
- 1% rule
- 1.06% ✓
- Cap rate
- 6.01%
- Cash-on-cash
- -1.02%
- DSCR
- 0.95
- GRM
- 7.8
CMA / ARV
No comps found within radius.
Projected returns pro-forma
-3.0% appreciation · 3.0% rent growth · sell at horizon
- IRR
- -17.8%
- Equity multiple
- 0.37×
- Total profit
- $-24,453
- Equity at exit
- $20,725
- IRR
- -9.7%
- Equity multiple
- 0.40×
- Total profit
- $-23,306
- Equity at exit
- $12,018
Cash invested: $38,920 (down + closing). Projections, not guarantees.
Landlord ↔ Tenant lean methodology
- Overall (STATE)
- 62 Landlord-Friendly
- State Michigan
- 62 Landlord-Friendly · EVEN
- County
- — inherits STATE
- City
- — inherits STATE
ZIP-level market 48051
- Home prices YoY
- -31.8%
- Active inventory
- 140
- Price-to-rent
- 7.8×
Monthly cashflow live
- Estimated rent
- $1,478 high interval (Pro) →
- Mortgage (P&I)
- −$729
- Tax est. 1.5%
- −$174 /mo · $2,085/yr
- Insurance
- −$58
- HOA
- −$240
- Vacancy / Maint / Mgmt
- −$310
- Net cashflow
- $-33
Break-even live
UW: 25.0% down · 7.5% · 30yr · 1.5% tax · 5.0% vac · 8.0% maint · 8.0% mgmt
Financing live
Cash to close
- Down payment
- $34,750
- Closing costs
- $4,170
- Reserves months
- —
- Total cash needed
- —
Loan-product check · same deal, 3 products live
Conventional
25% down · 7.5% · 30yr
- Down + closing
- —
- Monthly P&I
- —
- Monthly cashflow
- —
- DSCR
- —
- Eligible?
- —
Personal DTI + credit; lowest rate.
DSCR
20% down · 8.5% · 30yr
- Down + closing
- —
- Monthly P&I
- —
- Monthly cashflow
- —
- DSCR
- —
- Eligible?
- —
No personal income docs; deal must DSCR.
Hard money
10% down · 12.0% · 12mo
- Down + closing
- —
- Monthly P&I
- —
- Monthly cashflow
- —
- DSCR
- —
- Eligible?
- —
Short-term bridge; refi at stabilization.
Rent comps 21 comps
| Address | Beds | Baths | Sqft | Rent | $/sqft | DOM | Units | Dist |
|---|---|---|---|---|---|---|---|---|
| 28123 23 Mile Rd New Baltimore, MI | 1.0–2.0 | 1.0 | 800 | $1,059 | $1.32 | 1d | 5 | 0.04mi |
| 28218 S Pointe Ln New Baltimore, MI | 2.0 | 2.0 | 1427 | $1,850 | $1.30 | 5d | 1 | 0.27mi |
| 28218 S Pointe Ln New Baltimore, MI | 2.0 | 2.0 | 1425 | $2,100 | $1.47 | 24d | 1 | 0.27mi |
| 28346 Adler Park Dr S #246 Chesterfield, MI | 2.0 | 2.0 | 1332 | $1,750 | $1.31 | 43d | 1 | 0.34mi |
| 50450 Bay Run N #50 Chesterfield, MI | 2.0 | 1.5 | 1200 | $1,500 | $1.25 | 17d | 1 | 0.63mi |
| 49330 Carlos St New Baltimore, MI | 1.0–2.0 | 1.0–2.0 | 715 | $945 | $1.32 | 1d | 1 | 0.79mi |
| 50031 S Benny Ct New Baltimore, MI | 2.0 | 1.0 | 1056 | $1,450 | $1.37 | 43d | 1 | 0.80mi |
| 29890 Donna Ln New Baltimore, MI | 2.0 | 1.5 | 1120 | $1,500 | $1.34 | 1d | 1 | 0.87mi |
| 52436 Winston Ct Unit 209 Chesterfield, MI | 3.0 | 2.0 | 1056 | $1,479 | $1.40 | 43d | 1 | 1.04mi |
| 29805 Jamestown Dr Unit 435 New Baltimore, MI | 3.0 | 2.0 | 1344 | $1,739 | $1.29 | 1d | 1 | 1.05mi |
| 52705 Van Buren Dr Unit 297 Chesterfield, MI | 3.0 | 2.0 | 1056 | $1,479 | $1.40 | 1d | 1 | 1.07mi |
| 29811 W Essex Ct Unit 114 New Baltimore, MI | 3.0 | 2.0 | 1456 | $1,729 | $1.19 | 43d | 1 | 1.12mi |
| 29810 W Essex Ct Unit 107 New Baltimore, MI | 3.0 | 2.0 | 1056 | $1,439 | $1.36 | 5d | 1 | 1.13mi |
| 29649 Cambridge Ct Unit 256 New Baltimore, MI | 3.0 | 2.0 | 1152 | $1,579 | $1.37 | 1d | 1 | 1.13mi |
| 52758 S Yorktown Ct Unit 176 New Baltimore, MI | 2.0 | 2.0 | 960 | $1,449 | $1.51 | 1d | 1 | 1.15mi |
| 29778 W Essex Ct Unit 109 New Baltimore, MI | 3.0 | 2.0 | 1056 | $1,469 | $1.39 | 43d | 1 | 1.15mi |
| 29909 Flushing Dr Unit 71 New Baltimore, MI | 3.0 | 2.0 | 1440 | $1,669 | $1.16 | 16d | 1 | 1.15mi |
| 52780 S Zacharias Ct Unit 152 Chesterfield, MI | 3.0 | 2.0 | 1056 | $1,499 | $1.42 | 1d | 1 | 1.20mi |
| 52792 S Zacharias Ct Unit 151 Chesterfield, MI | 3.0 | 2.0 | 1056 | $1,479 | $1.40 | 1d | 1 | 1.21mi |
| 52871 N Zacharias Ct Unit 161 Chesterfield, MI | 3.0 | 2.0 | 1152 | $1,519 | $1.32 | 1d | 1 | 1.22mi |
| 52962 N Yorktown Ct Unit 168 Chesterfield, MI | 3.0 | 2.0 | 1056 | $1,519 | $1.44 | 1d | 1 | 1.22mi |
HOA detail condo
- Monthly dues
- $240 · $2,880/yr
- Assessments
- None detected in remarks — confirm with the listing agent.
Listing history 8 events
-
2026-06-18days on market $139,000 Active 4 DOM
-
2026-06-17days on market $139,000 Active 3 DOM
-
2026-06-16days on market $139,000 Active 2 DOM
-
2026-06-15remarks 699-char remark
-
2026-06-15days on market $139,000 Active 1 DOM
-
2026-06-15days on market $139,000 Active 3 DOM
-
2026-06-13remarks 693-char remark
-
2026-06-13$139,000 Active 1 DOM
ⓘ Source: listings_history table (triggers on properties + properties_extension) + one-shot
backfill from property_details.listing_events for pre-trigger history.
Climate risk First Street
- Flood 1/10 Low FEMA zone X (unshaded) · 0% chance over 30 yrs
- Wildfire 1/10 Low
- Heat 3/10 Moderate 7 d/yr ≥96°F today · 15 d/yr by 30 yrs out
- Wind 1/10 Low
- Air quality 4/10 Moderate 4 unhealthy d/yr today · 5 by 30 yrs out
Nearby sold comps map
Loading sold comps map…
Walkable amenities ~0.75 mi
Loading nearby amenities…
Taxation est. · year 1
- Rental income
- $17,736
- − Mortgage interest
- −$7,786
- − Property taxes
- −$2,085
- − Insurance
- −$695
- − Repairs & maintenance
- −$1,419
- − Management
- −$1,419
- − HOA
- −$2,880
- − Depreciation
- −$4,044
- Taxable loss
- −$2,591
- Est. tax savings @ 24.0%
- +$622
- After-tax cash flow
- $226/yr
For passive investors: Depreciation is non-cash, so a rental often shows a tax loss while cash-flowing — sheltering income. Rental losses are passive: they offset passive income freely, and up to $25,000/yr can offset ordinary (W-2) income if you actively participate and your MAGI is under $100k (phasing out to $0 by $150k); unused losses carry forward. On sale, claimed depreciation is recaptured at up to 25%, and gains may owe capital-gains tax (a 1031 exchange can defer both). Figures are a year-1 estimate at your 24.0% rate — not tax advice; consult a CPA.
Schools (NCES district)
- District
- L'Anse Creuse Public Schools
- NCES district ID
- 2621870
- Math proficiency
- 31% ▼ -8.00%
- Reading proficiency
- 51% ▼ -2.00%
- Median HH income
- $57,757
- Composite
- 35.99/100
- National rank
- #4790
- State rank
- #184 of 540 in MI
Livability — Chesterfield
No livability data for this city. (Only ~50 U.S. cities are tracked.)
Census & demographics
- City population
- 40,302
- Population (ZIP)
- 17,716
Population outlook (Macomb County) Hauer SSP2
- Today (2025)
- 925,296 people
- By 2030
- 948,226 · +2.5%
- By 2040
- 983,961 · +6.3%
- By 2050
- 1,010,200 · +9.2%
- By 2075
- 1,076,222 · +16.3%
- By 2100
- 1,077,065 · +16.4%
Race, ethnicity, and origin ACS 2023
- Neighborhood character
- Predominantly White (79%)
- Race & ethnicity
- White 79% Black 8% Two or more races 7% Hispanic / Latino 5%
- Common ancestry
- Romanian 18% Lithuanian 5% Slovak 1%
- Foreign-born
- 4% · Canada
- Languages at home
- 94% English-only · Spanish 4% Other Indo-European 1%
Political lean MEDSL · Macomb
- 2024 margin
- R (+13.7) · D 42.2% · R 55.9% · Other 1.9%
- 2008→2024 swing
- -22.3pp toward R · 2008: 8.6pp · 2024: -13.7pp
- All cycles
- 2024: R+13.7 2020: R+8.1 2016: R+11.6 2012: D+4.0 2008: D+8.6
Not yet ingested
- Civics
- —
Market trends
- HPI YoY
- ▼ -98.06%
- Current HPI
- 210.6017
- Rent YoY
- —
- Metro
- —
- State GDP YoY
- ▲ 1.37%
- F500 in state
- 28
Industry mix (Fortune 500 HQ in MI)
| Industry | F500 HQs | Revenue |
|---|---|---|
| Automotive Parts | 3 | $48B |
|
||
| Automotive | 2 | $372B |
|
||
| Chemicals | 1 | $45B |
|
||
| Automotive Retail | 1 | $29B |
|
||
| Healthcare / Medical Devices | 1 | $23B |
|
||
| Automotive Technology | 1 | $20B |
|
||
Price history
+178.6% since first listed7 events — show timeline
- 2026-06-12 Listed $139,000 MiRealSource-MiMLS
- 2015-09-25 Sold (MLS) $53,000 REALCOMP
- 2015-08-28 Listing Removed — REALCOMP
- 2015-05-01 Relisted — REALCOMP
- 2015-04-01 Listing Removed — REALCOMP
- 2015-03-23 Price Changed $55,900 REALCOMP
- 2015-03-19 Listed $49,900 REALCOMP
Cash-flow waterfall
monthlySold comps — $/sqft
last 12 mo · ≤1 miLoading sold comps…