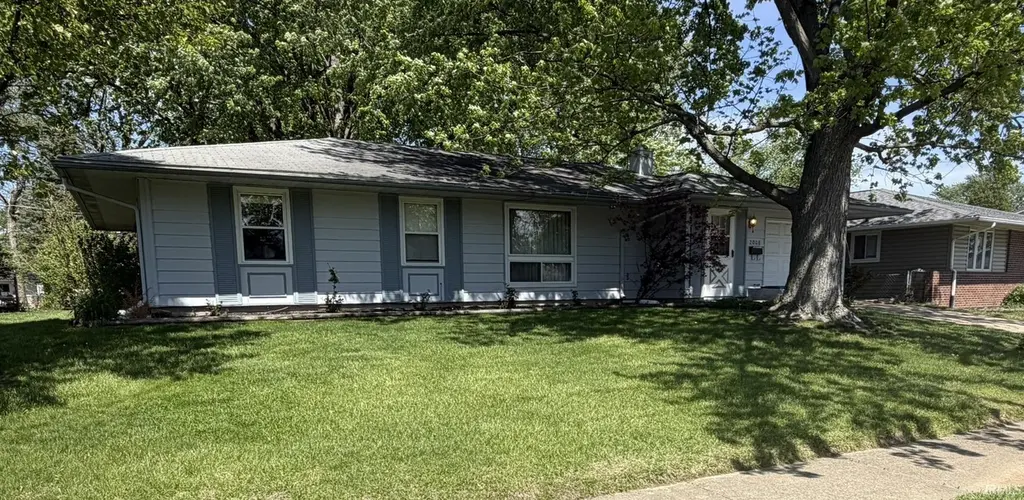
2008 Arapahoe Dr · Lafayette, IN
Flood risk 1/10 · Minimal
- FEMA flood zone
- X (unshaded)
- Chance of flooding over 30 yrs
- 0.0%
- Est. flood insurance / yr
- $507 – $1,088
Fire risk 1/10 · Minimal
- Est. fire insurance / yr
- $717 – $1,331
Heat risk 3/10 · Minor
- Hot days now (above 101°F)
- 7 days/yr
- Hot days in 30 yrs
- 18 days/yr
Wind risk 2/10 · Minimal
- Chance of severe wind over 30 yrs
- —
Air-quality risk 2/10 · Minimal
- Unhealthy air days now
- 1 days/yr
- Unhealthy air days in 30 yrs
- 2 days/yr
Risk factors via First Street. Map © Google.
Why this score? — see what drove the D grade
The composite is a weighted blend of 9 inputs, each scored 0–100. Each bar is that input's sub-score; the figure is the points it added to the 100-point composite (weight × sub-score).
- Cash flow +13.9/30.0
- ARV discount +9.3/15.0
- DSCR +4.2/10.0
- Livability +3.7/5.0
- Rent growth +3.2/5.0
- 1% rule +3.0/10.0
- Schools +2.6/10.0
- Condition / age +2.5/5.0
- Appreciation +0.0/10.0
$225,000
🖨 Deal sheet (PDF) 📄 Offer letter ✓ Due diligence
Listing remarks
Focusing on expansive living areas and smart utility, this residence emphasizes functional design and many updates. The heart of the home is an oversized, open-concept kitchen and living space that exceeds the typical footprint of the neighborhood, providing a generous environment for hosting and daily activity. The Chef’s Kitchen Designed for maximum efficiency, the remodeled kitchen serves as a high-performance workspace featuring: Storage & Organization: An abundance of cabinetry complemented by a dedicated appliance garage to keep counters clear. Workspace: Extensive prep surfaces and a central island with integrated breakfast bar seating. Details: Crown molding accents thr
Key facts
- Central island
- Open-concept kitchen
- Walk-in shower
Tags
Property features AI
Finance
- Other: Lot is level; Lot dimensions approximately 67 x 108; Zoned R1 (residential)
- HOA & community: No association amenities
Exterior
- Parking: Attached garage with garage door opener (1 car); Concrete driveway
- Utilities: Public water; Public sewer
- Home design: Single-family residence; Site-built home; One story
- Construction: Aluminum siding; Asphalt shingle roof; Slab foundation; Built with site-built construction
- Exterior features: Deck; Chain link fence; Shed(s)
Interior
- Kitchen: Dishwasher; Microwave; Refrigerator; Electric oven; Electric range; Kitchen island; Breakfast bar; Laminate counters
- Bedrooms: Primary suite on the main level
- Flooring: Carpet; Vinyl; Ceramic tile
- Bathrooms: 2 full bathrooms (both on the main level)
- Heating & cooling: Central air conditioning; Forced air heating
- Interior features: Breakfast bar; Kitchen island; Laminate counters; Primary bedroom on main level; One fireplace
- Laundry & utility: Washer included; Dryer included; Electric dryer hookup on the main level
Neighborhood map
What this means for you Summary
Snapshot
- This is a 3-bed/2.0-bath single-family listed at $225k.
Deal economics
- At list price, monthly cash flow is $24 ($292/yr) — positive.
- The deal already cash-flows at list — no discount required.
- To meet the 1% rule (rent ≥ 1% of price), the offer needs to be $180k (19.8% below list).
- Recommended offer: $180k (19.8% below list) — sets the bar for 1% rule.
- Cap rate 6.4% vs local median 4.2% in Lafayette — top-decile yield for the area; either an underpriced asset or a hidden risk that comps aren't pricing in. Stress-test before assuming the spread holds.
Location & tenants
- Location reads 74/100 on livability (#68 in IN, #4,374 nationally) — a middle-class / working-renter tenant base. Strengths: cost of living A+, housing A+, health & safety A+; Watch: amenities D+, employment D+, crime F.
- Lafayette School Corporation (urban): math 29% / reading 34% proficiency, ranked #235 of 301 in IN (top 78%) — families likely to look elsewhere, expect single-tenant / working-renter base with shorter leases; 63% free/reduced lunch — lower-income household profile, screen leases tightly.
- Zoned schools: Miami Elementary School (math 27% / reading 27%, grade F, #737 of 994 statewide, top 76%, 458 students, 86% FRL); Jefferson High School (math 23% / reading 55%, grade F, #235 of 369 statewide, top 65%, 2,118 students, 69% FRL).
- Market conditions: Rents rising (+2.7%/yr); 186 active listings in the ZIP; 5 comparable units currently listed for rent nearby; rentals at typical pace (median 14d on market — plan ~3-4 weeks tenant-placement turnaround); 1,341 units permitted in Tippecanoe County in 2024 (869 in 5+ unit buildings).
- This rent runs 32% of the median local income ($68k/yr) — at the standard rent-burdened threshold; future hikes will face affordability resistance.
Forward outlook
- Local home prices are declining (-3.0%/yr); year-one equity from $2k of loan paydown is wiped out by about $7k of value loss. Plan a longer hold.
- Tippecanoe County population projected at +41% by 2050 — long-run rental-demand tailwind backs the buy-and-hold thesis.
Negotiation context
- It's been on market 36 days — a 3% lower offer ($218k) is reasonable based on typical stale-listing flexibility.
Questions for the listing agent
- It's been on market 36 days. Have you received any prior offers? Is the seller open to a 20% concession, seller financing, or rate buy-down credit?
- Built in 1963 — when were the roof, HVAC, electrical panel, plumbing, and water heater last replaced?
- Is there a deadline driving the sale (1031 exchange, divorce, estate, relocation)? That informs how much negotiation room exists.
- Schools are D-rated, which usually means shorter tenancies and higher turnover. Who's the typical renter profile here, and what's been the actual vacancy rate?
- Crime grade is F in this area — have there been break-ins, vandalism, or insurance claims at this property in the last 3 years? What carrier currently insures it and at what premium?
- The area grade is low — what's the realistic commute time and amenity access for the typical tenant pool here? Any planned neighborhood developments (good or bad) we should know about?
- What's the average days-on-market for RENTAL listings here right now (not sales)? A rising rental-DOM trend means longer vacancies and softer asking-rent achievability than the comps imply.
- What's the recent tenant-quality profile in this submarket — average credit score on applications, eviction rate, late-payment / NSF rate, and stable-employment percentage? A property-management company in the area should have these aggregated.
- How much new for-sale + rental construction is in the pipeline within 1–3 miles? Heavy new supply typically softens prices + rents 12–24 months out; constrained supply supports both.
Investment metrics
- 1% rule
- 0.80% ✗
- Cap rate
- 6.42%
- Cash-on-cash
- 0.46%
- DSCR
- 1.02
- GRM
- 10.4
CMA / ARV
- ARV (on-the-fly)
- $234,468
- Comps found
- 12
Show comp detail 12 sales within ~0.75 mi
| Address | Dist | Beds/Ba | Sqft | Sold | Price | $/sf | Match |
|---|---|---|---|---|---|---|---|
| 1303 Rochelle Dr | 0.39mi | 3/2.0 | 1,445 (-4%) | 3mo | $205,000 | $142 | 73 |
| 2402 Beck Ln | 0.27mi | 3/1.5 | 1,368 (-9%) | 2mo | $212,500 | $155 | 69 |
| 20 Equinox Ct | 0.64mi | 3/2.0 | 1,538 (+2%) | 1mo | $285,000 | $185 | 65 |
| 2403 Pueblo Dr | 0.59mi | 3/2.0 | 1,560 (+4%) | 1mo | $250,000 | $160 | 65 |
| 2303 Sioux Pl | 0.50mi | 4/2.0 (+1) | 1,443 (-4%) | 2mo | $232,500 | $161 | 64 |
| 2408 Yuma Dr | 0.25mi | 3/1.0 | 1,306 (-13%) | 4mo | $194,500 | $149 | 59 |
| 2421 Edgelea Dr | 0.54mi | 3/2.0 | 1,356 (-10%) | 0mo | $150,000 | $111 | 58 |
| 2303 Ottawa Dr Dr | 0.33mi | 3/2.0 | 1,282 (-15%) | 4mo | $200,000 | $156 | 57 |
| 2417 Foxhall Dr | 0.51mi | 3/2.0 | 1,360 (-10%) | 4mo | $195,000 | $143 | 56 |
| 2609 Oxford St | 0.44mi | 3/1.0 | 1,325 (-12%) | 4mo | $200,000 | $151 | 53 |
| 3245 Commanche Trl | 0.56mi | 3/1.5 | 1,320 (-12%) | 0mo | $233,000 | $177 | 51 |
| 1023 Brick N Wood Dr | 0.69mi | 3/2.0 | 1,691 (+12%) | 3mo | $270,000 | $160 | 44 |
Match score weights: distance 35% · size 25% · config 20% · recency 20%. Top-matched comps best support the ARV.
Projected returns pro-forma
-3.0% appreciation · 2.74% rent growth · sell at horizon
- IRR
- -15.9%
- Equity multiple
- 0.44×
- Total profit
- $-35,450
- Equity at exit
- $33,548
- IRR
- -7.9%
- Equity multiple
- 0.51×
- Total profit
- $-31,073
- Equity at exit
- $19,454
Cash invested: $63,000 (down + closing). Projections, not guarantees.
Landlord ↔ Tenant lean methodology
- Overall (STATE)
- 90 Strongly Landlord-Friendly
- State Indiana
- 90 Strongly Landlord-Friendly · R+11
- County
- — inherits STATE
- City
- — inherits STATE
ZIP-level market 47909
- Rents YoY
- 2.7%
- Active inventory
- 186
- Price-to-rent
- 10.4×
Monthly cashflow live
- Estimated rent
- $1,804 high interval (Pro) →
- Mortgage (P&I)
- −$1,180
- Tax from tax record
- −$127 /mo · $1,523/yr
- Insurance
- −$94
- HOA
- −$0
- Vacancy / Maint / Mgmt
- −$379
- Net cashflow
- $24
Break-even live
Sensitivity live
| Price | -10% $152 | -5% $88 | +0% $24 | +5% $-39 | +10% $-103 |
|---|---|---|---|---|---|
| Rent | -10% $-118 | -5% $-47 | +0% $24 | +5% $96 | +10% $167 |
| Rate | -1.0pp $138 | -0.5pp $82 | base $24 | +0.5pp $-34 | +1.0pp $-93 |
UW: 25.0% down · 7.5% · 30yr · 1.5% tax · 5.0% vac · 8.0% maint · 8.0% mgmt
Financing live
Cash to close
- Down payment
- $56,250
- Closing costs
- $6,750
- Reserves months
- —
- Total cash needed
- —
Loan-product check · same deal, 3 products live
Conventional
25% down · 7.5% · 30yr
- Down + closing
- —
- Monthly P&I
- —
- Monthly cashflow
- —
- DSCR
- —
- Eligible?
- —
Personal DTI + credit; lowest rate.
DSCR
20% down · 8.5% · 30yr
- Down + closing
- —
- Monthly P&I
- —
- Monthly cashflow
- —
- DSCR
- —
- Eligible?
- —
No personal income docs; deal must DSCR.
Hard money
10% down · 12.0% · 12mo
- Down + closing
- —
- Monthly P&I
- —
- Monthly cashflow
- —
- DSCR
- —
- Eligible?
- —
Short-term bridge; refi at stabilization.
Rent comps 5 comps
| Address | Beds | Baths | Sqft | Rent | $/sqft | DOM | Units | Dist |
|---|---|---|---|---|---|---|---|---|
| 3090 Pheasant Run Dr Lafayette, IN | 3.0 | 1.0–2.0 | 852 | $1,591 | $1.87 | 14d | 52 | 0.71mi |
| 3224 S 9th St Lafayette, IN | 1.0–3.0 | 1.0–2.0 | 825 | $1,520 | $1.84 | 14d | 18 | 0.82mi |
| 1812 Starks Cir Lafayette, IN | 3.0 | 2.0 | 1210 | $1,725 | $1.43 | 14d | 1 | 1.06mi |
| 1213 S 19th St Lafayette, IN | 3.0 | 2.0 | 1484 | $1,900 | $1.28 | 14d | 1 | 1.24mi |
| 2121 Kyra Dr Lafayette, IN | 1.0–3.0 | 1.0–2.0 | 1035 | $1,640 | $1.58 | 14d | 1 | 1.49mi |
Listing history 3 events
-
2026-05-30status $225,000 Pending 36 DOM
-
2026-04-29historical Active Under Contract
-
2026-04-23$225,000 Active
ⓘ Source: listings_history table (triggers on properties + properties_extension) + one-shot
backfill from property_details.listing_events for pre-trigger history.
Tax reassessment forecast IN · Partial reset (capped growth)
- Current annual tax
- $1,523 · $127/mo
- Projected year-2 tax
- $1,718 · $143/mo
- Expected delta
- +$195/yr (+$16/mo · 12.8%)
ⓘ Screening estimate from a state-policy table — verify with the county assessor before closing.
Climate risk First Street
- Flood 1/10 Low FEMA zone X (unshaded) · 0% chance over 30 yrs
- Wildfire 1/10 Low
- Heat 3/10 Moderate 7 d/yr ≥101°F today · 18 d/yr by 30 yrs out
- Wind 2/10 Low
- Air quality 2/10 Low 1 unhealthy d/yr today · 2 by 30 yrs out
Nearby sold comps map
Loading sold comps map…
Walkable amenities ~0.75 mi
Loading nearby amenities…
Taxation est. · year 1
- Rental income
- $21,644
- − Mortgage interest
- −$12,603
- − Property taxes
- −$1,523
- − Insurance
- −$1,125
- − Repairs & maintenance
- −$1,732
- − Management
- −$1,732
- − Depreciation
- −$6,545
- Taxable loss
- −$3,616
- Est. tax savings @ 24.0%
- +$868
- After-tax cash flow
- $1,159/yr
For passive investors: Depreciation is non-cash, so a rental often shows a tax loss while cash-flowing — sheltering income. Rental losses are passive: they offset passive income freely, and up to $25,000/yr can offset ordinary (W-2) income if you actively participate and your MAGI is under $100k (phasing out to $0 by $150k); unused losses carry forward. On sale, claimed depreciation is recaptured at up to 25%, and gains may owe capital-gains tax (a 1031 exchange can defer both). Figures are a year-1 estimate at your 24.0% rate — not tax advice; consult a CPA.
Schools (NCES district)
- District
- Lafayette School Corporation
- NCES district ID
- 1805400
- Math proficiency
- 29% ▼ -9.00%
- Reading proficiency
- 34% ▼ -7.00%
- Median HH income
- $39,817
- Composite
- 26.46/100
- National rank
- #7217
- State rank
- #235 of 301 in IN
Livability — Lafayette
- Score
- 74/100
- State rank
- #68
- US rank
- #4374
Category grades
Schools grade is shown separately in the Schools card above.
Census & demographics
- Census place
- Lafayette, IN
- County
- Tippecanoe County · 181,820 people
- City population
- 106,622
- Metro
- Lafayette-West Lafayette, IN
- Population (ZIP)
- 43,561
- Household income
- $68,035
- Rent vs Own
- Severe rent burden
- 1332.0
Population outlook (Tippecanoe County) Hauer SSP2
- Today (2025)
- 215,327 people
- By 2030
- 232,284 · +7.9%
- By 2040
- 266,517 · +23.8%
- By 2050
- 302,826 · +40.6%
- By 2075
- 394,445 · +83.2%
- By 2100
- 463,500 · +115.3%
Race, ethnicity, and origin ACS 2023
- Neighborhood character
- Predominantly White (75%)
- Race & ethnicity
- White 75% Hispanic / Latino 12% Black 8% Two or more races 7% Asian 2%
- Hispanic origin (detail)
- Mexican 9%
- Common ancestry
- Iranian 2% Slovak 2% Italian 2%
- Foreign-born
- 7% · Canada
- Languages at home
- 92% English-only · Spanish 6% Other Indo-European 1% French/Haitian/Cajun 1%
Political lean MEDSL · Tippecanoe
- 2024 margin
- Toss-up / Even · D 49.0% · R 49.1% · Other 1.9%
- 2008→2024 swing
- -11.8pp toward R · 2008: 11.6pp · 2024: -0.1pp
- All cycles
- 2024: R+0.1 2020: D+0.6 2016: R+5.7 2012: R+3.6 2008: D+11.6
Not yet ingested
- Civics
- —
Market trends
- HPI YoY
- ▼ -131.96%
- Current HPI
- 214.2557
- Rent YoY
- ▲ 2.74%
- Metro
- Lafayette-West Lafayette, IN
- State GDP YoY
- ▲ 2.90%
- F500 in state
- 18
Industry mix (Fortune 500 HQ in IN)
| Industry | F500 HQs | Revenue |
|---|---|---|
| Industrial Machinery | 2 | $37B |
|
||
| Healthcare | 1 | $177B |
|
||
| Pharmaceuticals | 1 | $45B |
|
||
| Metals / Steel | 1 | $18B |
|
||
| Agriculture | 1 | $17B |
|
||
| Packaging | 1 | $12B |
|
||
Price history
2 events — show timeline
- 2026-04-29 Contingent — IRMLS
- 2026-04-23 Listed $225,000 IRMLS
Property tax history
+12.3%/yrLatest (2024): $1,523 · +7.3% YoY. Source: county tax records.
Cash-flow waterfall
monthlySold comps — $/sqft
last 12 mo · ≤1 miLoading sold comps…