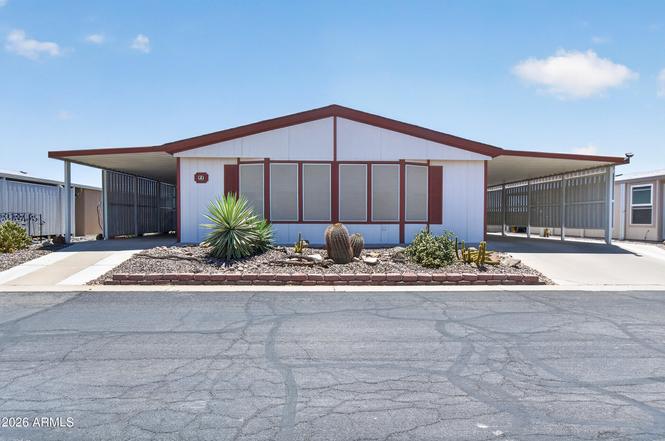
3700 S Tomahawk Rd #95 · Apache Junction, AZ
Flood risk 3/10 · Minor
- FEMA flood zone
- X (unshaded)
- Chance of flooding over 30 yrs
- 0.1%
- Est. flood insurance / yr
- $507 – $1,088
Fire risk 5/10 · Moderate
- Est. fire insurance / yr
- $610 – $1,132
Heat risk 8/10 · Major
- Hot days now (above 111°F)
- 5 days/yr
- Hot days in 30 yrs
- 14 days/yr
Wind risk 1/10 · Minimal
- Chance of severe wind over 30 yrs
- —
Air-quality risk 3/10 · Minor
- Unhealthy air days now
- 3 days/yr
- Unhealthy air days in 30 yrs
- 4 days/yr
Risk factors via First Street. Map © Google.
Why this score? — see what drove the C+ grade
The composite is a weighted blend of 9 inputs, each scored 0–100. Each bar is that input's sub-score; the figure is the points it added to the 100-point composite (weight × sub-score).
- Cash flow +30.0/30.0
- 1% rule +10.0/10.0
- DSCR +10.0/10.0
- ARV discount +4.0/15.0
- Livability +3.3/5.0
- Rent growth +2.9/5.0
- Condition / age +2.5/5.0
- Schools +1.5/10.0
- Appreciation +0.0/10.0
$97,000
🖨 Deal sheet 📄 Offer letter ✓ Due diligence
Listing remarks
Welcome home to this beautifully maintained, move-in ready manufactured home located in a desirable 55+ community with stunning mountain views. This spacious residence features an open floor plan and a large kitchen perfect for cooking and entertaining. The primary suite includes dual sinks, a walk-in shower, and an expansive closet. The guest bathroom features a convenient tub/shower combination. Outside, enjoy ample parking, a large storage shed, and a lovely backyard complete with a patio ideal for relaxing or entertaining friends in the beautiful Arizona weather. Citrus trees add a touch of charm to the outdoor space. Recent updates include a new AC unit and water heater for added peace
Key facts
- Open floor plan
- Expansive closet
- Primary suite
Tags
Property features AI
Finance
- Other: Lot size: 3,483 (source: owner)
- HOA & community: Land lease (monthly); Land lease fee of $874.33 per month; No association fees included; Community pool; Community spa; Fitness center
Exterior
- Parking: 2 covered parking spaces; 2 open parking spaces; 2 carport spaces
- Security: Gated community
- Utilities: City water; Public sewer
- Home design: Manufactured/mobile housing; Leasehold ownership; Mountain view
- Construction: Vertical siding; Wood frame construction; Painted exterior; Composition roof
- Exterior features: Storage; Block fencing; Desert front and back landscaping; Automatic timer irrigation front and back
Interior
- Kitchen: Refrigerator; Dishwasher; Disposal; Laminate counters; Breakfast bar
- Bedrooms: 2 possible bedrooms
- Flooring: Laminate flooring
- Bathrooms: 2 full bathrooms
- Heating & cooling: Heat pump heating; Electric heating; Central air; Heat pump cooling; Ceiling fans
- Interior features: High-speed internet; Double vanity in bathroom; Breakfast bar; Full bath in master bedroom; Laminate counters; Storage
- Laundry & utility: Laundry inside
Neighborhood map
What this means for you Summary
Snapshot
- This is a 2-bed/2.0-bath manufactured listed at $97k.
Deal economics
- At list price, monthly cash flow is $883 ($11k/yr) — positive.
- The deal already cash-flows at list — no discount required.
- Meets the 1% rule at list price ($2k rent vs $97k).
- Recommended offer: $85k (12.0% below list) — sets the bar for market timing.
- Cap rate 17.2% vs local median 3.5% in Apache Junction — top-decile yield for the area; either an underpriced asset or a hidden risk that comps aren't pricing in. Stress-test before assuming the spread holds.
Location & tenants
- Location reads 66/100 on livability (#70 in AZ) — a middle-class / working-renter tenant base. Strengths: cost of living A+, housing A+; Watch: crime D+, schools F, amenities F.
- Apache Junction Unified District (4443) (suburban): math 15% / reading 20% proficiency, ranked #195 of 249 in AZ (top 78%) — low school quality limits family demand, transient renter base, plan for 1-2y turnover.
- Market conditions: Rents rising (+1.6%/yr); 354 active listings in the ZIP; 10 comparable units currently listed for rent nearby; rentals at typical pace (median 24d on market — plan ~3-4 weeks tenant-placement turnaround); 9,504 units permitted in Pinal County in 2024 (776 in 5+ unit buildings).
- This rent runs 33% of the median local income ($72k/yr) — at the standard rent-burdened threshold; future hikes will face affordability resistance.
Forward outlook
- Local home prices are declining (-3.0%/yr); year-one equity from $671 of loan paydown is wiped out by about $3k of value loss. Plan a longer hold.
- At projected returns (-3.0% appreciation + 1.6% rent growth), your $27k cash investment doubles in ~4 years — after that, you're playing with house money.
Negotiation context
- It's been on market 125 days — a 12% lower offer ($85k) is reasonable based on typical stale-listing flexibility.
Risks & watch-outs
- Climate carrying-cost: moderate wildfire risk; extreme-heat days projected 5→14/yr by 2055 (HVAC capex compounding) — expect insurance premiums to compound above CPI over the hold.
Questions for the listing agent
- It's been on market 125 days. Have you received any prior offers? Is the seller open to a 12% concession, seller financing, or rate buy-down credit?
- Why hasn't it sold? Are there any deal-killer items the seller is aware of (foundation, flood, title, zoning, code violations)?
- Is there a deadline driving the sale (1031 exchange, divorce, estate, relocation)? That informs how much negotiation room exists.
- Schools are F-rated, which usually means shorter tenancies and higher turnover. Who's the typical renter profile here, and what's been the actual vacancy rate?
- Crime grade is D in this area — have there been break-ins, vandalism, or insurance claims at this property in the last 3 years? What carrier currently insures it and at what premium?
- What's the average days-on-market for RENTAL listings here right now (not sales)? A rising rental-DOM trend means longer vacancies and softer asking-rent achievability than the comps imply.
- What's the recent tenant-quality profile in this submarket — average credit score on applications, eviction rate, late-payment / NSF rate, and stable-employment percentage? A property-management company in the area should have these aggregated.
- How much new for-sale + rental construction is in the pipeline within 1–3 miles? Heavy new supply typically softens prices + rents 12–24 months out; constrained supply supports both.
Investment metrics
- 1% rule
- 2.03% ✓
- Cap rate
- 17.22%
- Cash-on-cash
- 39.03%
- DSCR
- 2.74
- GRM
- 4.1
CMA / ARV
- ARV (on-the-fly)
- $90,048
- Comps found
- 12
Show comp detail 12 sales within ~0.75 mi
| Address | Dist | Beds/Ba | Sqft | Sold | Price | $/sf | Match |
|---|---|---|---|---|---|---|---|
| 3500 S Tomahawk Rd #153 | 0.12mi | 2/2.0 | 1,344 (0%) | 4mo | $77,500 | $58 | 91 |
| 3700 S Tomahawk Rd #91 | 0.00mi | 2/2.0 | 1,428 (+6%) | 1mo | $85,000 | $60 | 89 |
| 3700 S Tomahawk Rd #13 | 0.00mi | 2/2.0 | 1,436 (+7%) | 2mo | $59,000 | $41 | 87 |
| 3500 S Tomahawk Rd #188 | 0.16mi | 2/2.0 | 1,248 (-7%) | 1mo | $75,000 | $60 | 80 |
| 3700 S Tomahawk Rd #16 | 0.00mi | 3/2.0 (+1) | 1,512 (+12%) | 0mo | $119,900 | $79 | 74 |
| 2605 S Tomahawk Rd #46 | 0.69mi | 2/2.0 | 1,344 (0%) | 6mo | $57,900 | $43 | 63 |
| 2400 E Baseline Ave #125 | 0.72mi | 2/2.0 | 1,376 (+2%) | 1mo | $82,900 | $60 | 62 |
| 3355 S Cortez Rd #98 | 0.73mi | 2/2.0 | 1,356 (+1%) | 5mo | $110,000 | $81 | 60 |
| 2400 E Baseline Rd #248 | 0.72mi | 2/2.0 | 1,500 (+12%) | 4mo | $152,500 | $102 | 44 |
| 2400 E Baseline Ave #181 | 0.72mi | 3/2.0 (+1) | 1,456 (+8%) | 5mo | $148,000 | $102 | 44 |
| 2400 E Baseline Ave #148 | 0.73mi | 2/2.0 | 1,500 (+12%) | 5mo | $100,000 | $67 | 43 |
| 2605 S Tomahawk Rd #181 | 0.70mi | 3/2.0 (+1) | 1,200 (-11%) | 4mo | $125,000 | $104 | 42 |
Match score weights: distance 35% · size 25% · config 20% · recency 20%. Top-matched comps best support the ARV.
Projected returns pro-forma
-3.0% appreciation · 1.57% rent growth · sell at horizon
- IRR
- 33.6%
- Equity multiple
- 2.39×
- Total profit
- $37,790
- Equity at exit
- $14,463
- IRR
- 39.8%
- Equity multiple
- 4.47×
- Total profit
- $94,358
- Equity at exit
- $8,387
Cash invested: $27,160 (down + closing). Projections, not guarantees.
Landlord ↔ Tenant lean methodology
- Overall (STATE)
- 87 Strongly Landlord-Friendly
- State Arizona
- 87 Strongly Landlord-Friendly · R+3
- County
- — inherits STATE
- City
- — inherits STATE
ZIP-level market 85119
- Home prices YoY
- -33.5%
- Rents YoY
- 1.6%
- Active inventory
- 354
- Price-to-rent
- 4.1×
Monthly cashflow live
- Estimated rent
- $1,967 high interval (Pro) →
- Mortgage (P&I)
- −$509
- Tax est. 1.5%
- −$121 /mo · $1,455/yr
- Insurance
- −$40
- HOA
- −$0
- Vacancy / Maint / Mgmt
- −$413
- Net cashflow
- $883
Break-even live
UW: 25.0% down · 7.5% · 30yr · 1.5% tax · 5.0% vac · 8.0% maint · 8.0% mgmt
Financing live
Cash to close
- Down payment
- $24,250
- Closing costs
- $2,910
- Reserves months
- —
- Total cash needed
- —
Loan-product check · same deal, 3 products live
Conventional
25% down · 7.5% · 30yr
- Down + closing
- —
- Monthly P&I
- —
- Monthly cashflow
- —
- DSCR
- —
- Eligible?
- —
Personal DTI + credit; lowest rate.
DSCR
20% down · 8.5% · 30yr
- Down + closing
- —
- Monthly P&I
- —
- Monthly cashflow
- —
- DSCR
- —
- Eligible?
- —
No personal income docs; deal must DSCR.
Hard money
10% down · 12.0% · 12mo
- Down + closing
- —
- Monthly P&I
- —
- Monthly cashflow
- —
- DSCR
- —
- Eligible?
- —
Short-term bridge; refi at stabilization.
Rent comps 10 comps
| Address | Beds | Baths | Sqft | Rent | $/sqft | DOM | Units | Dist |
|---|---|---|---|---|---|---|---|---|
| 3478 S Chaparral Rd Apache Junction, AZ | 3.0 | 2.5 | 1614 | $1,850 | $1.15 | 5d | 1 | 0.44mi |
| 3448 S Chaparral Rd Apache Junction, AZ | 3.0 | 2.0 | 1186 | $1,848 | $1.56 | 11d | 1 | 0.47mi |
| 3277 S Chaparral Rd Apache Junction, AZ | 3.0 | 2.5 | 1614 | $1,770 | $1.10 | 3d | 1 | 0.54mi |
| 3705 S Conestoga Rd Apache Junction, AZ | 3.0 | 2.0 | 1700 | $1,895 | $1.11 | 24d | 1 | 0.61mi |
| 3879 S Conestoga Rd Apache Junction, AZ | 3.0 | 2.0 | 1578 | $1,910 | $1.21 | 24d | 1 | 0.62mi |
| 3333 S Conestoga Rd Apache Junction, AZ | 3.0 | 2.0 | 1387 | $2,900 | $2.09 | 24d | 1 | 0.67mi |
| 2681 E Boulder Ave Apache Junction, AZ | 3.0 | 3.5 | 1776 | $2,200 | $1.24 | 24d | 1 | 0.89mi |
| 700 E Quail Ave Apache Junction, AZ | 3.0 | 2.0 | 1168 | $1,795 | $1.54 | 5d | 1 | 1.02mi |
| 705 E Kachina Ave Apache Junction, AZ | 3.0 | 2.0 | 1400 | $2,655 | $1.90 | 5d | 1 | 1.35mi |
| 3301 S Goldfield Rd Unit 4077 Apache Junction, AZ | 2.0 | 2.0 | 1548 | $1,850 | $1.20 | 24d | 1 | 1.41mi |
Listing history 14 events
-
2026-06-18days on market $97,000 Active 125 DOM
-
2026-06-17days on market $97,000 Active 124 DOM
-
2026-06-16days on market $97,000 Active 123 DOM
-
2026-06-15days on market $97,000 Active 122 DOM
-
2026-06-13days on market $97,000 Active 120 DOM
-
2026-06-09days on market $97,000 Active 116 DOM
-
2026-06-08days on market $97,000 Active 115 DOM
-
2026-06-07days on market $97,000 Active 114 DOM
-
2026-06-04days on market $97,000 Active 111 DOM
-
2026-06-03days on market $97,000 Active 110 DOM
-
2026-06-02days on market $97,000 Active 109 DOM
-
2026-06-01days on market $97,000 Active 108 DOM
-
2026-05-31days on market $97,000 Active 107 DOM
-
2026-02-11$97,000 Active
ⓘ Source: listings_history table (triggers on properties + properties_extension) + one-shot
backfill from property_details.listing_events for pre-trigger history.
Climate risk First Street
- Flood 3/10 Moderate FEMA zone X (unshaded) · 10% chance over 30 yrs
- Wildfire 5/10 Major
- Heat 8/10 Severe 5 d/yr ≥111°F today · 14 d/yr by 30 yrs out
- Wind 1/10 Low
- Air quality 3/10 Moderate 3 unhealthy d/yr today · 4 by 30 yrs out
Nearby sold comps map
Loading sold comps map…
Walkable amenities ~0.75 mi
Loading nearby amenities…
Taxation est. · year 1
- Rental income
- $23,602
- − Mortgage interest
- −$5,434
- − Property taxes
- −$1,455
- − Insurance
- −$485
- − Repairs & maintenance
- −$1,888
- − Management
- −$1,888
- − Depreciation
- −$2,822
- Taxable income
- $9,631
- Est. tax owed @ 24.0%
- −$2,311
- After-tax cash flow
- $8,290/yr
For passive investors: Depreciation is non-cash, so a rental often shows a tax loss while cash-flowing — sheltering income. Rental losses are passive: they offset passive income freely, and up to $25,000/yr can offset ordinary (W-2) income if you actively participate and your MAGI is under $100k (phasing out to $0 by $150k); unused losses carry forward. On sale, claimed depreciation is recaptured at up to 25%, and gains may owe capital-gains tax (a 1031 exchange can defer both). Figures are a year-1 estimate at your 24.0% rate — not tax advice; consult a CPA.
Schools (NCES district)
- District
- Apache Junction Unified District (4443)
- NCES district ID
- 0400790
- Math proficiency
- 15% ▼ -17.00%
- Reading proficiency
- 20% ▼ -13.00%
- Median HH income
- $44,930
- Composite
- 15.34/100
- National rank
- #9325
- State rank
- #195 of 249 in AZ
Livability — Apache Junction
- Score
- 66/100
- State rank
- #70
- US rank
- #11242
Category grades
Schools grade is shown separately in the Schools card above.
Census & demographics
- Census place
- Apache Junction, AZ
- County
- Pinal County · 399,947 people
- City population
- 56,611
- Metro
- Phoenix-Mesa-Chandler, AZ
- Population (ZIP)
- 25,420
- Household income
- $71,585
- Rent vs Own
- Severe rent burden
- 305.0
Population outlook (Pinal County) Hauer SSP2
- Today (2025)
- 437,574 people
- By 2030
- 446,903 · +2.1%
- By 2040
- 452,589 · +3.4%
- By 2050
- 444,126 · +1.5%
- By 2075
- 430,300 · -1.7%
- By 2100
- 393,536 · -10.1%
Race, ethnicity, and origin ACS 2023
- Neighborhood character
- Predominantly White (74%)
- Race & ethnicity
- White 74% Hispanic / Latino 19% Two or more races 12% Black 2% Asian 1%
- Hispanic origin (detail)
- Mexican 17%
- Common ancestry
- Slovak 5% Portuguese 3% Lithuanian 3%
- Foreign-born
- 8% · Canada
- Languages at home
- 87% English-only · Spanish 11%
Political lean MEDSL · Pinal
- 2024 margin
- Strong R (+22.1) · D 38.5% · R 60.6%
- 2008→2024 swing
- -7.6pp toward R · 2008: -14.5pp · 2024: -22.1pp
- All cycles
- 2024: R+22.1 2020: R+17.3 2016: R+19.3 2012: R+17.1 2008: R+14.5
Not yet ingested
- Civics
- —
Market trends
- HPI YoY
- ▼ -138.19%
- Current HPI
- 274.3808
- Rent YoY
- ▲ 1.57%
- Metro
- Phoenix-Mesa-Chandler, AZ
- State GDP YoY
- ▲ 4.54%
- F500 in state
- 20
Industry mix (Fortune 500 HQ in AZ)
| Industry | F500 HQs | Revenue |
|---|---|---|
| Technology | 2 | $13B |
|
||
| Mining / Metals | 1 | $23B |
|
||
| Environmental Services | 1 | $16B |
|
||
| Metals / Steel | 1 | $14B |
|
||
| Technology Distribution | 1 | $9B |
|
||
| Homebuilding | 1 | $8B |
|
||
Price history
1 event — show timeline
- 2026-02-11 Listed $97,000 ARMLS
Cash-flow waterfall
monthlySold comps — $/sqft
last 12 mo · ≤1 miLoading sold comps…