 🏷️ Likely Rental
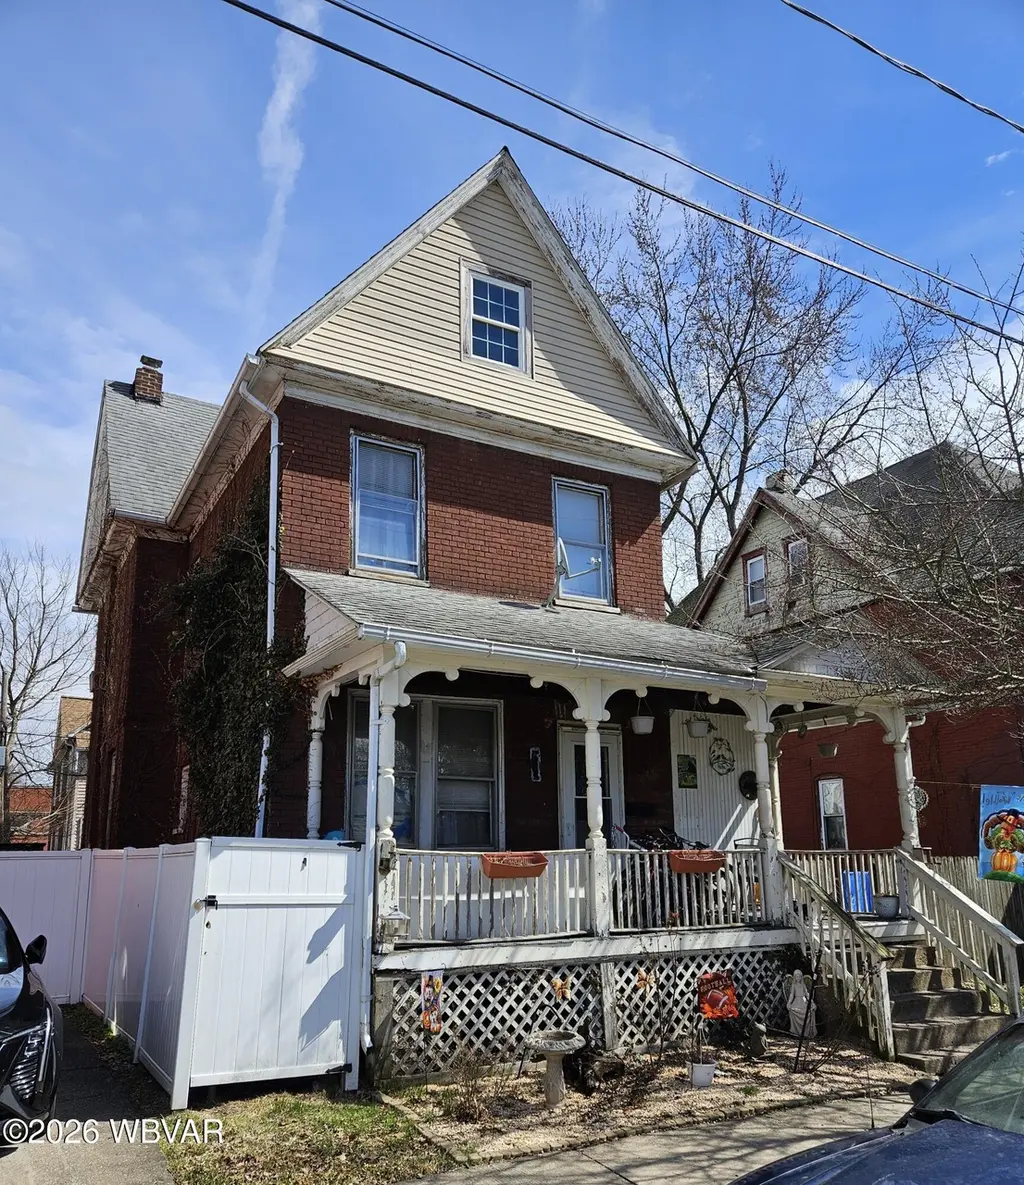
646 Cherry St · Williamsport, PA
Flood risk 6/10 · Moderate
- FEMA flood zone
- X
- Chance of flooding over 30 yrs
- 0.49%
- Est. flood insurance / yr
- $473 – $860
Fire risk 1/10 · Minimal
- Est. fire insurance / yr
- $511 – $949
Heat risk 4/10 · Minor
- Hot days now (above 97°F)
- 7 days/yr
- Hot days in 30 yrs
- 16 days/yr
Wind risk 2/10 · Minimal
- Chance of severe wind over 30 yrs
- 2.0%
Air-quality risk 2/10 · Minimal
- Unhealthy air days now
- 0 days/yr
- Unhealthy air days in 30 yrs
- 1 days/yr
Risk factors via First Street. Map © Google.
Why this score? — see what drove the B+ grade
The composite is a weighted blend of 9 inputs, each scored 0–100. Each bar is that input's sub-score; the figure is the points it added to the 100-point composite (weight × sub-score).
- Cash flow +30.0/30.0
- ARV discount +15.0/15.0
- DSCR +10.0/10.0
- 1% rule +8.8/10.0
- Livability +3.7/5.0
- Rent growth +3.6/5.0
- Schools +3.5/10.0
- Condition / age +2.5/5.0
- Appreciation +0.0/10.0
$109,900
🖨 Deal sheet 📄 Offer letter ✓ Due diligence
Listing remarks MLS
This house is affordably priced and has a long term tenant (12 years) who would like to stay and continue renting. The tenant is on a month to month lease. Please allow 24 hours for showings. There are three bedrooms, living room, kitchen, a full bathroom, formal dining room and a small enclosed porch currently being used as a first floor bedroom. The back yard is completely fenced - perfect for pets or small children.
Key facts
- Small enclosed porch
- 2,178 sq ft lot
- Built 1901
Tags
Neighborhood map
What this means for you Summary
Snapshot
- This is a 3-bed/1.0-bath single-family listed at $110k.
Deal economics
- At list price, monthly cash flow is $423 ($5k/yr) — positive.
- The deal already cash-flows at list — no discount required.
- Meets the 1% rule at list price ($2k rent vs $110k).
- Recommended offer: $103k (6.0% below list) — sets the bar for market timing.
- Cap rate 10.9% vs local median 5.6% in Williamsport — top-decile yield for the area; either an underpriced asset or a hidden risk that comps aren't pricing in. Stress-test before assuming the spread holds.
Location & tenants
- Location reads 74/100 on livability (#523 in PA, #4,841 nationally) — a middle-class / working-renter tenant base. Strengths: cost of living A+, housing A+, health & safety A+; Watch: crime C-, employment D, amenities F.
- Williamsport Area SD (urban): math 38% / reading 45% proficiency, ranked #349 of 539 in PA (top 65%) — families likely to look elsewhere, expect single-tenant / working-renter base with shorter leases.
- Market conditions: Rents rising fast (+4.4%/yr); 188 active listings in the ZIP; 5 comparable units currently listed for rent nearby; rentals lingering (median 44d on market — plan ~5-8 weeks vacancy on turnover, expect pricing pressure); 100% of comp listings sitting > 30 days — soft ceiling on asking rent; 73 units permitted in Lycoming County in 2024 (15 in 5+ unit buildings).
- This rent runs 34% of the median local income ($53k/yr) — at the standard rent-burdened threshold; future hikes will face affordability resistance.
Forward outlook
- Local home prices are declining (-3.0%/yr); year-one equity from $760 of loan paydown is wiped out by about $3k of value loss. Plan a longer hold.
- Lycoming County population projected to shrink 10% by 2050 — rents likely to lag national; underwrite the cash flow, not the appreciation.
- At projected returns (-3.0% appreciation + 4.4% rent growth), your $31k cash investment doubles in ~7 years — after that, you're playing with house money.
Negotiation context
- It's been on market 90 days — a 6% lower offer ($103k) is reasonable based on typical stale-listing flexibility.
- Current owner paid $53k; list at $110k implies a 107% gain — meaningful room to come down on a strong offer.
Risks & watch-outs
- Watch-outs: built in 1901 — expect roof / HVAC / electrical / plumbing capex.
- Climate carrying-cost: major flood risk — expect insurance premiums to compound above CPI over the hold.
Questions for the listing agent
- It's been on market 90 days. Have you received any prior offers? Is the seller open to a 6% concession, seller financing, or rate buy-down credit?
- Built in 1901 — when were the roof, HVAC, electrical panel, plumbing, and water heater last replaced?
- Why hasn't it sold? Are there any deal-killer items the seller is aware of (foundation, flood, title, zoning, code violations)?
- Is there a deadline driving the sale (1031 exchange, divorce, estate, relocation)? That informs how much negotiation room exists.
- What's the average days-on-market for RENTAL listings here right now (not sales)? A rising rental-DOM trend means longer vacancies and softer asking-rent achievability than the comps imply.
- What's the recent tenant-quality profile in this submarket — average credit score on applications, eviction rate, late-payment / NSF rate, and stable-employment percentage? A property-management company in the area should have these aggregated.
- How much new for-sale + rental construction is in the pipeline within 1–3 miles? Heavy new supply typically softens prices + rents 12–24 months out; constrained supply supports both.
Investment metrics
- 1% rule
- 1.38% ✓
- Cap rate
- 10.91%
- Cash-on-cash
- 16.48%
- DSCR
- 1.73
- GRM
- 6.0
CMA / ARV
- ARV (median comp)
- $180,044
- List price
- $109,900
- Delta
- -38.96%
- Verdict
- UNDERPRICED
- Comps
- 20 within 2.0 mi
Show comp detail 1 sale within ~0.75 mi
| Address | Dist | Beds/Ba | Sqft | Sold | Price | $/sf | Match |
|---|---|---|---|---|---|---|---|
| 1026 Rural Ave | 0.72mi | 3/2.0 | 1,560 (+10%) | 15mo | $275,000 | $176 | 33 |
Match score weights: distance 35% · size 25% · config 20% · recency 20%. Top-matched comps best support the ARV.
Projected returns pro-forma
-3.0% appreciation · 4.43% rent growth · sell at horizon
- IRR
- 9.2%
- Equity multiple
- 1.37×
- Total profit
- $11,357
- Equity at exit
- $16,386
- IRR
- 19.6%
- Equity multiple
- 2.76×
- Total profit
- $54,042
- Equity at exit
- $9,502
Cash invested: $30,772 (down + closing). Projections, not guarantees.
Landlord ↔ Tenant lean methodology
- Overall (STATE)
- 62 Landlord-Friendly
- State Pennsylvania
- 62 Landlord-Friendly · EVEN
- County
- — inherits STATE
- City
- — inherits STATE
ZIP-level market 17701
- Rents YoY
- 4.4%
- Active inventory
- 188
- Price-to-rent
- 6.0×
Monthly cashflow live
- Estimated rent
- $1,518 high interval (Pro) →
- Mortgage (P&I)
- −$576
- Tax from tax record
- −$154 /mo · $1,851/yr
- Insurance
- −$46
- HOA
- −$0
- Vacancy / Maint / Mgmt
- −$319
- Net cashflow
- $423
Break-even live
UW: 25.0% down · 7.5% · 30yr · 1.5% tax · 5.0% vac · 8.0% maint · 8.0% mgmt
Financing live
Cash to close
- Down payment
- $27,475
- Closing costs
- $3,297
- Reserves months
- —
- Total cash needed
- —
Loan-product check · same deal, 3 products live
Conventional
25% down · 7.5% · 30yr
- Down + closing
- —
- Monthly P&I
- —
- Monthly cashflow
- —
- DSCR
- —
- Eligible?
- —
Personal DTI + credit; lowest rate.
DSCR
20% down · 8.5% · 30yr
- Down + closing
- —
- Monthly P&I
- —
- Monthly cashflow
- —
- DSCR
- —
- Eligible?
- —
No personal income docs; deal must DSCR.
Hard money
10% down · 12.0% · 12mo
- Down + closing
- —
- Monthly P&I
- —
- Monthly cashflow
- —
- DSCR
- —
- Eligible?
- —
Short-term bridge; refi at stabilization.
Rent comps 5 comps
| Address | Beds | Baths | Sqft | Rent | $/sqft | DOM | Units | Dist |
|---|---|---|---|---|---|---|---|---|
| 770 W 4th St Williamsport, PA | 1.0–2.0 | 1.0 | 814 | $1,155 | $1.42 | 44d | 1 | 0.46mi |
| 215 E 3rd St Unit 3D Williamsport, PA | 2.0 | 1.0 | 1300 | $2,500 | $1.92 | 44d | 1 | 0.70mi |
| 675 Cemetery St Williamsport, PA | 3.0 | 1.0 | 1185 | $1,200 | $1.01 | 44d | 1 | 1.23mi |
| 475 E 5th Ave Unit 6 South Williamsport, PA | 2.0 | 1.0 | 900 | $1,180 | $1.31 | 44d | 1 | 1.41mi |
| 480 E 5th Ave Unit 4 South Williamsport, PA | 2.0 | 1.0 | 900 | $1,200 | $1.33 | 44d | 1 | 1.44mi |
Listing history 17 events
-
2026-06-19days on market $109,900 Active 90 DOM
-
2026-06-18days on market $109,900 Active 89 DOM
-
2026-06-17days on market $109,900 Active 88 DOM
-
2026-06-16days on market $109,900 Active 87 DOM
-
2026-06-15days on market $109,900 Active 86 DOM
-
2026-06-14days on market $109,900 Active 84 DOM
-
2026-06-12days on market $109,900 Active 83 DOM
-
2026-06-09days on market $109,900 Active 80 DOM
-
2026-06-08days on market $109,900 Active 79 DOM
-
2026-06-07days on market $109,900 Active 78 DOM
-
2026-06-05days on market $109,900 Active 75 DOM
-
2026-06-02days on market $109,900 Active 73 DOM
-
2026-06-01days on market $109,900 Active 72 DOM
-
2026-05-31days on market $109,900 Active 71 DOM
-
2026-05-30days on market $109,900 Active 70 DOM
-
2026-03-21$109,900 Active 422-char remark
Show marketing remark (422 chars)
This house is affordably priced and has a long term tenant (12 years) who would like to stay and continue renting. The tenant is on a month to month lease. Please allow 24 hours for showings. There are three bedrooms, living room, kitchen, a full bathroom, formal dining room and a small enclosed porch currently being used as a first floor bedroom. The back yard is completely fenced - perfect for pets or small children.
-
2007-11-27soldstatus $53,000
ⓘ Source: listings_history table (triggers on properties + properties_extension) + one-shot
backfill from property_details.listing_events for pre-trigger history.
Tax reassessment forecast PA · Partial reset (capped growth)
- Current annual tax
- $1,851 · $154/mo
- Projected year-2 tax
- $1,851 · $154/mo
- Expected delta
- $0/yr ($0/mo · 0.0%)
ⓘ Screening estimate from a state-policy table — verify with the county assessor before closing.
Climate risk First Street
- Flood 6/10 Major FEMA zone X · 49% chance over 30 yrs
- Wildfire 1/10 Low
- Heat 4/10 Moderate 7 d/yr ≥97°F today · 16 d/yr by 30 yrs out
- Wind 2/10 Low 2% chance of damaging wind over 30 yrs
- Air quality 2/10 Low 0 unhealthy d/yr today · 1 by 30 yrs out
Nearby sold comps map
Loading sold comps map…
Walkable amenities ~0.75 mi
Loading nearby amenities…
Taxation est. · year 1
- Rental income
- $18,213
- − Mortgage interest
- −$6,156
- − Property taxes
- −$1,851
- − Insurance
- −$550
- − Repairs & maintenance
- −$1,457
- − Management
- −$1,457
- − Depreciation
- −$3,197
- Taxable income
- $3,545
- Est. tax owed @ 24.0%
- −$851
- After-tax cash flow
- $4,221/yr
For passive investors: Depreciation is non-cash, so a rental often shows a tax loss while cash-flowing — sheltering income. Rental losses are passive: they offset passive income freely, and up to $25,000/yr can offset ordinary (W-2) income if you actively participate and your MAGI is under $100k (phasing out to $0 by $150k); unused losses carry forward. On sale, claimed depreciation is recaptured at up to 25%, and gains may owe capital-gains tax (a 1031 exchange can defer both). Figures are a year-1 estimate at your 24.0% rate — not tax advice; consult a CPA.
Schools (NCES district)
- District
- Williamsport Area SD
- NCES district ID
- 4226460
- Math proficiency
- 38% ▼ -9.00%
- Reading proficiency
- 45% ▼ -12.00%
- Median HH income
- $38,637
- Composite
- 34.63/100
- National rank
- #5150
- State rank
- #349 of 539 in PA
Livability — Williamsport
- Score
- 74/100
- State rank
- #523
- US rank
- #4841
Category grades
Schools grade is shown separately in the Schools card above.
Census & demographics
- Census place
- Williamsport, PA
- County
- Lycoming County · 43,104 people
- City population
- 43,104
- Metro
- Williamsport, PA
- Population (ZIP)
- 43,104
- Household income
- $53,237
- Rent vs Own
- Severe rent burden
- 2178.0
Population outlook (Lycoming County) Hauer SSP2
- Today (2025)
- 114,164 people
- By 2030
- 112,221 · -1.7%
- By 2040
- 107,613 · -5.7%
- By 2050
- 102,950 · -9.8%
- By 2075
- 92,987 · -18.5%
- By 2100
- 80,924 · -29.1%
Race, ethnicity, and origin ACS 2023
- Neighborhood character
- Predominantly White (80%)
- Race & ethnicity
- White 80% Black 10% Two or more races 7% Hispanic / Latino 3% Asian 1%
- Common ancestry
- Romanian 3% Lithuanian 2% Slovak 2%
- Foreign-born
- 2% · Canada
- Languages at home
- 96% English-only · Spanish 1% French/Haitian/Cajun 1% German/W. Germanic 1%
Political lean MEDSL · Lycoming
- 2024 margin
- Solid R (+41.5) · D 28.8% · R 70.3%
- 2008→2024 swing
- -17.3pp toward R · 2008: -24.2pp · 2024: -41.5pp
- All cycles
- 2024: R+41.5 2020: R+41.3 2016: R+44.8 2012: R+33.3 2008: R+24.2
Not yet ingested
- Civics
- —
Market trends
- HPI YoY
- ▼ -142.61%
- Current HPI
- 216.7203
- Rent YoY
- ▲ 4.43%
- Metro
- Williamsport, PA
- State GDP YoY
- ▲ 1.68%
- F500 in state
- 34
Industry mix (Fortune 500 HQ in PA)
| Industry | F500 HQs | Revenue |
|---|---|---|
| Healthcare | 2 | $309B |
|
||
| Insurance | 2 | $27B |
|
||
| Telecommunications / Media | 1 | $124B |
|
||
| Industrial Distribution | 1 | $22B |
|
||
| Financial Services | 1 | $20B |
|
||
| Chemicals / Materials | 1 | $18B |
|
||
Price history
+107.4% since first listed2 events — show timeline
- 2026-03-21 Listed $109,900 WBVAR
- 2007-11-27 Sold (Public Records) $53,000 Public Records
Property tax history
+2.0%/yrLatest (2026): $1,851 · +2.5% YoY. Source: county tax records.
Cash-flow waterfall
monthlySold comps — $/sqft
last 12 mo · ≤1 miLoading sold comps…