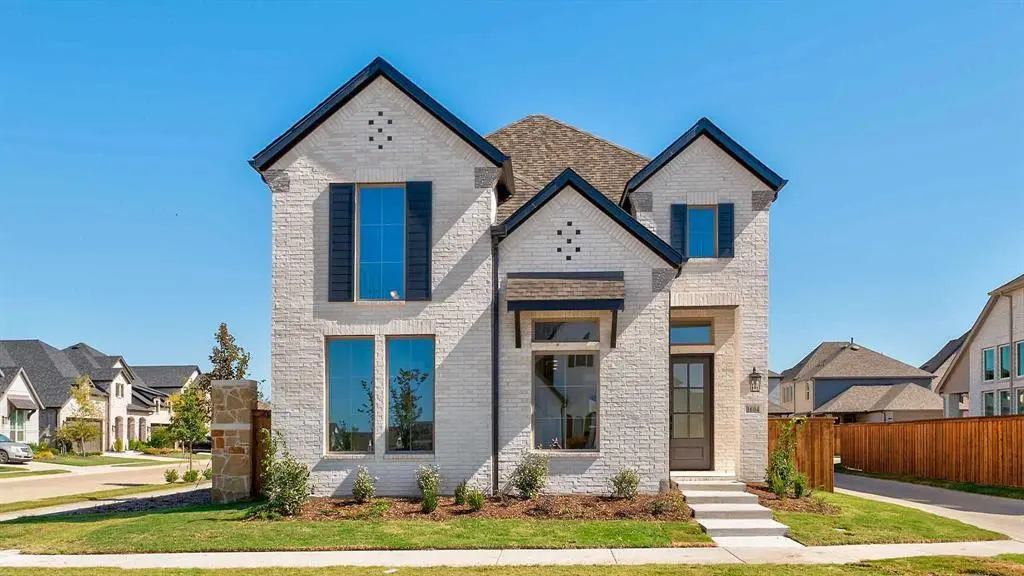
1604 Victoria Pl · Celina, TX
Flood risk 1/10 · Minimal
- FEMA flood zone
- X (unshaded)
- Chance of flooding over 30 yrs
- 0.0%
- Est. flood insurance / yr
- $507 – $1,088
Fire risk 3/10 · Minor
- Est. fire insurance / yr
- $1,222 – $2,270
Heat risk 7/10 · Major
- Hot days now (above 109°F)
- 7 days/yr
- Hot days in 30 yrs
- 22 days/yr
Wind risk 6/10 · Moderate
- Chance of severe wind over 30 yrs
- 27.0%
Air-quality risk 4/10 · Minor
- Unhealthy air days now
- 4 days/yr
- Unhealthy air days in 30 yrs
- 5 days/yr
Risk factors via First Street. Map © Google.
Why this score? — see what drove the D+ grade
The composite is a weighted blend of 9 inputs, each scored 0–100. Each bar is that input's sub-score; the figure is the points it added to the 100-point composite (weight × sub-score).
- Cash flow +18.5/30.0
- ARV discount +7.5/15.0
- DSCR +5.8/10.0
- Schools +5.0/10.0
- 1% rule +4.0/10.0
- Livability +3.4/5.0
- Condition / age +2.5/5.0
- Rent growth +1.3/5.0
- Appreciation +0.0/10.0
$474,900
🖨 Deal sheet 📄 Offer letter ✓ Due diligence
Listing remarks
MOVE-IN READY! Two-story entry with 19-foot ceiling flows into spacious two-story family room with a wood mantel fireplace. Open concept floor plan with an island kitchen that offers a built-in seating space, 5-burner gas cooktop and a separate dining area with a wall of windows. Secluded primary suite with a wall of windows. Primary bath offers a French door entry with dual vanities, a large glass enclosed shower and a walk-in closet. The second level boasts a large game room, guest suite with full bathroom and secondary bedrooms. Mud room just off the two-car garage.
Key facts
- Two story entry
- 5 burner gas cooktop
- Island kitchen
Tags
Neighborhood map
What this means for you Summary
Snapshot
- This is a 4-bed/3.5-bath other listed at $475k.
Deal economics
- At list price, monthly cash flow is $456 ($5k/yr) — positive.
- The deal already cash-flows at list — no discount required.
- To meet the 1% rule (rent ≥ 1% of price), the offer needs to be $429k (9.6% below list).
- Recommended offer: $418k (12.0% below list) — sets the bar for market timing.
- Cap rate 7.4% vs local median 2.8% in Celina — top-decile yield for the area; either an underpriced asset or a hidden risk that comps aren't pricing in. Stress-test before assuming the spread holds.
Location & tenants
- Location reads 68/100 on livability (#450 in TX) — a middle-class / working-renter tenant base. Strengths: employment A+, housing A+, crime A; Watch: cost of living C-, amenities F, commute F.
- Celina ISD (rural): math 50% / reading 61% proficiency, ranked #71 of 826 in TX (top 9%) — acceptable for families but not a draw, mixed tenant base, ~2y average lease.
- Zoned schools: Marcy B Lykins El (math 38% / reading 50%, grade F, #1,243 of 4,322 statewide, top 29%, 708 students, 22% FRL).
- Market conditions: Rents falling (-4.6%/yr); 2895 active listings in the ZIP; 6 comparable units currently listed for rent nearby; rentals at typical pace (median 25d on market — plan ~3-4 weeks tenant-placement turnaround); high-income renter base; 19,194 units permitted in Collin County in 2024 (3,988 in 5+ unit buildings).
- This rent runs 31% of the median local income ($168k/yr) — at the standard rent-burdened threshold; future hikes will face affordability resistance.
Forward outlook
- Local home prices are declining (-3.0%/yr); year-one equity from $3k of loan paydown is wiped out by about $14k of value loss. Plan a longer hold.
- Collin County population projected at +60% by 2050 — long-run rental-demand tailwind backs the buy-and-hold thesis.
Negotiation context
- It's been on market 268 days — a 12% lower offer ($418k) is reasonable based on typical stale-listing flexibility.
Risks & watch-outs
- Climate carrying-cost: major wind risk, 27% chance of damaging wind over 30y; extreme-heat days projected 7→22/yr by 2055 (HVAC capex compounding) — expect insurance premiums to compound above CPI over the hold.
Questions for the listing agent
- It's been on market 268 days. Have you received any prior offers? Is the seller open to a 12% concession, seller financing, or rate buy-down credit?
- What does the HOA fee cover, when was the last increase, and are there any pending special assessments or reserve-fund shortfalls?
- Why hasn't it sold? Are there any deal-killer items the seller is aware of (foundation, flood, title, zoning, code violations)?
- Is there a deadline driving the sale (1031 exchange, divorce, estate, relocation)? That informs how much negotiation room exists.
- Schools are A-rated — typically a magnet for longer-tenancy family renters. What's the average tenant stay here, and is there a school-zone premium baked into asking?
- The area grade is low — what's the realistic commute time and amenity access for the typical tenant pool here? Any planned neighborhood developments (good or bad) we should know about?
- What's the average days-on-market for RENTAL listings here right now (not sales)? A rising rental-DOM trend means longer vacancies and softer asking-rent achievability than the comps imply.
- What's the recent tenant-quality profile in this submarket — average credit score on applications, eviction rate, late-payment / NSF rate, and stable-employment percentage? A property-management company in the area should have these aggregated.
- How much new for-sale + rental construction is in the pipeline within 1–3 miles? Heavy new supply typically softens prices + rents 12–24 months out; constrained supply supports both.
Investment metrics
- 1% rule
- 0.90% ✗
- Cap rate
- 7.44%
- Cash-on-cash
- 4.11%
- DSCR
- 1.18
- GRM
- 9.2
CMA / ARV
No comps found within radius.
Projected returns pro-forma
-3.0% appreciation · 0.0% rent growth · sell at horizon
- IRR
- -13.0%
- Equity multiple
- 0.54×
- Total profit
- $-60,648
- Equity at exit
- $70,809
- IRR
- -8.9%
- Equity multiple
- 0.51×
- Total profit
- $-64,649
- Equity at exit
- $41,061
Cash invested: $132,972 (down + closing). Projections, not guarantees.
Landlord ↔ Tenant lean methodology
- Overall (STATE)
- 87 Strongly Landlord-Friendly
- State Texas
- 87 Strongly Landlord-Friendly · R+5
- County
- — inherits STATE
- City
- — inherits STATE
ZIP-level market 75009
- Home prices YoY
- -23.1%
- Rents YoY
- -4.6%
- Active inventory
- 2895
- Price-to-rent
- 9.2×
Monthly cashflow live
- Estimated rent
- $4,293 high interval (Pro) →
- Mortgage (P&I)
- −$2,490
- Tax from tax record
- −$113 /mo · $1,351/yr
- Insurance
- −$198
- HOA
- −$135
- Vacancy / Maint / Mgmt
- −$902
- Net cashflow
- $456
Break-even live
UW: 25.0% down · 7.5% · 30yr · 1.5% tax · 5.0% vac · 8.0% maint · 8.0% mgmt
Financing live
Cash to close
- Down payment
- $118,725
- Closing costs
- $14,247
- Reserves months
- —
- Total cash needed
- —
Loan-product check · same deal, 3 products live
Conventional
25% down · 7.5% · 30yr
- Down + closing
- —
- Monthly P&I
- —
- Monthly cashflow
- —
- DSCR
- —
- Eligible?
- —
Personal DTI + credit; lowest rate.
DSCR
20% down · 8.5% · 30yr
- Down + closing
- —
- Monthly P&I
- —
- Monthly cashflow
- —
- DSCR
- —
- Eligible?
- —
No personal income docs; deal must DSCR.
Hard money
10% down · 12.0% · 12mo
- Down + closing
- —
- Monthly P&I
- —
- Monthly cashflow
- —
- DSCR
- —
- Eligible?
- —
Short-term bridge; refi at stabilization.
Rent comps 6 comps
| Address | Beds | Baths | Sqft | Rent | $/sqft | DOM | Units | Dist |
|---|---|---|---|---|---|---|---|---|
| 1637 Palo Duro Way Celina, TX | 4.0 | 3.0 | 2545 | $5,800 | $2.28 | 1d | 1 | 0.07mi |
| 2437 Plumeria Ln Celina, TX | 5.0 | 5.0 | 3257 | $3,611 | $1.11 | 43d | 1 | 0.33mi |
| 1720 Yaupon Ct Celina, TX | 4.0 | 5.0 | 3271 | $3,450 | $1.05 | 24d | 1 | 1.16mi |
| 2004 Huntersridge Dr Celina, TX | 4.0 | 3.0 | 2815 | $3,200 | $1.14 | 24d | 1 | 1.34mi |
| 2009 Brookhurst St Celina, TX | 4.0 | 3.0 | 2386 | $2,895 | $1.21 | 18d | 1 | 1.45mi |
| 2522 Runhappy Ct Celina, TX | 4.0 | 3.0 | 2395 | $3,500 | $1.46 | 43d | 1 | 1.46mi |
HOA detail
- Monthly dues
- $135 · $1,620/yr
- Likely covers
- gas
Listing history 9 events
-
2026-03-06status Pending
-
2026-02-25price $474,900
-
2026-02-11price $499,900
-
2026-02-02price $500,900
-
2026-01-14price $499,900
-
2026-01-13price $504,900
-
2026-01-12price $502,900
-
2025-11-26price $499,900
-
2025-06-11$549,900 Active
ⓘ Source: listings_history table (triggers on properties + properties_extension) + one-shot
backfill from property_details.listing_events for pre-trigger history.
Tax reassessment forecast TX · Resets to sale price
- Current annual tax
- $1,351 · $113/mo
- Projected year-2 tax
- $8,691 · $724/mo
- Expected delta
- +$7,340/yr (+$612/mo · 543.5%)
ⓘ Screening estimate from a state-policy table — verify with the county assessor before closing.
Climate risk First Street
- Flood 1/10 Low FEMA zone X (unshaded) · 0% chance over 30 yrs
- Wildfire 3/10 Moderate
- Heat 7/10 Severe 7 d/yr ≥109°F today · 22 d/yr by 30 yrs out
- Wind 6/10 Major 27% chance of damaging wind over 30 yrs
- Air quality 4/10 Moderate 4 unhealthy d/yr today · 5 by 30 yrs out
Nearby sold comps map
Loading sold comps map…
Walkable amenities ~0.75 mi
Loading nearby amenities…
Taxation est. · year 1
- Rental income
- $51,520
- − Mortgage interest
- −$26,602
- − Property taxes
- −$1,351
- − Insurance
- −$2,374
- − Repairs & maintenance
- −$4,122
- − Management
- −$4,122
- − HOA
- −$1,620
- − Depreciation
- −$13,815
- Taxable loss
- −$2,485
- Est. tax savings @ 24.0%
- +$596
- After-tax cash flow
- $6,067/yr
For passive investors: Depreciation is non-cash, so a rental often shows a tax loss while cash-flowing — sheltering income. Rental losses are passive: they offset passive income freely, and up to $25,000/yr can offset ordinary (W-2) income if you actively participate and your MAGI is under $100k (phasing out to $0 by $150k); unused losses carry forward. On sale, claimed depreciation is recaptured at up to 25%, and gains may owe capital-gains tax (a 1031 exchange can defer both). Figures are a year-1 estimate at your 24.0% rate — not tax advice; consult a CPA.
Schools (NCES district)
- District
- Celina ISD
- NCES district ID
- 4813290
- Math proficiency
- 50% ▼ -15.00%
- Reading proficiency
- 61% ▼ -5.00%
- Median HH income
- $83,282
- Composite
- 50.49/100
- National rank
- #1853
- State rank
- #71 of 826 in TX
Livability — Celina
- Score
- 68/100
- State rank
- #450
- US rank
- #9135
Category grades
Schools grade is shown separately in the Schools card above.
Census & demographics
- Census place
- Celina, TX
- County
- Collin County · 1,159,394 people
- City population
- 34,260
- Metro
- Dallas-Fort Worth-Arlington, TX
- Population (ZIP)
- 34,260
- Household income
- $168,250
- Rent vs Own
- Severe rent burden
- 152.0
Population outlook (Collin County) Hauer SSP2
- Today (2025)
- 1,210,074 people
- By 2030
- 1,358,201 · +12.2%
- By 2040
- 1,654,061 · +36.7%
- By 2050
- 1,937,359 · +60.1%
- By 2075
- 2,567,039 · +112.1%
- By 2100
- 2,952,048 · +144.0%
Race, ethnicity, and origin ACS 2023
- Neighborhood character
- Diverse neighborhood (Simpson 0.56)
- Race & ethnicity
- White 64% Two or more races 11% Hispanic / Latino 11% Asian 11% Black 8%
- Hispanic origin (detail)
- Mexican 9%
- Common ancestry
- Slovak 5% Lithuanian 4% Romanian 1%
- Foreign-born
- 14% · China, Canada, Vietnam
- Languages at home
- 83% English-only · Spanish 6% Chinese 3% Other Asian/Pacific 3%
Political lean MEDSL · Collin
- 2024 margin
- R (+11.1) · D 43.1% · R 54.3% · Other 2.6%
- 2008→2024 swing
- +14.4pp toward D · 2008: -25.6pp · 2024: -11.1pp
- All cycles
- 2024: R+11.1 2020: R+4.3 2016: R+17.0 2012: R+31.6 2008: R+25.6
Not yet ingested
- Civics
- —
Market trends
- HPI YoY
- ▼ -83.07%
- Current HPI
- 276.6307
- Rent YoY
- ▼ -4.62%
- Metro
- Dallas-Fort Worth-Arlington, TX
- State GDP YoY
- ▲ 3.95%
- F500 in state
- 110
Industry mix (Fortune 500 HQ in TX)
| Industry | F500 HQs | Revenue |
|---|---|---|
| Energy | 16 | $1,198B |
|
||
| Technology | 5 | $198B |
|
||
| Engineering / Construction | 4 | $72B |
|
||
| Energy Services | 3 | $60B |
|
||
| Utilities | 3 | $41B |
|
||
| Healthcare | 2 | $330B |
|
||
Price history
-13.6% since first listed9 events — show timeline
- 2026-03-06 Pending — NTREIS
- 2026-02-25 Price Changed $474,900 NTREIS
- 2026-02-11 Price Changed $499,900 NTREIS
- 2026-02-02 Price Changed $500,900 NTREIS
- 2026-01-14 Price Changed $499,900 NTREIS
- 2026-01-13 Price Changed $504,900 NTREIS
- 2026-01-12 Price Changed $502,900 NTREIS
- 2025-11-26 Price Changed $499,900 NTREIS
- 2025-06-11 Listed $549,900 NTREIS
Property tax history
-8.5%/yrLatest (2025): $1,351 · +5.5% YoY. Source: county tax records.
Cash-flow waterfall
monthlySold comps — $/sqft
last 12 mo · ≤1 miLoading sold comps…