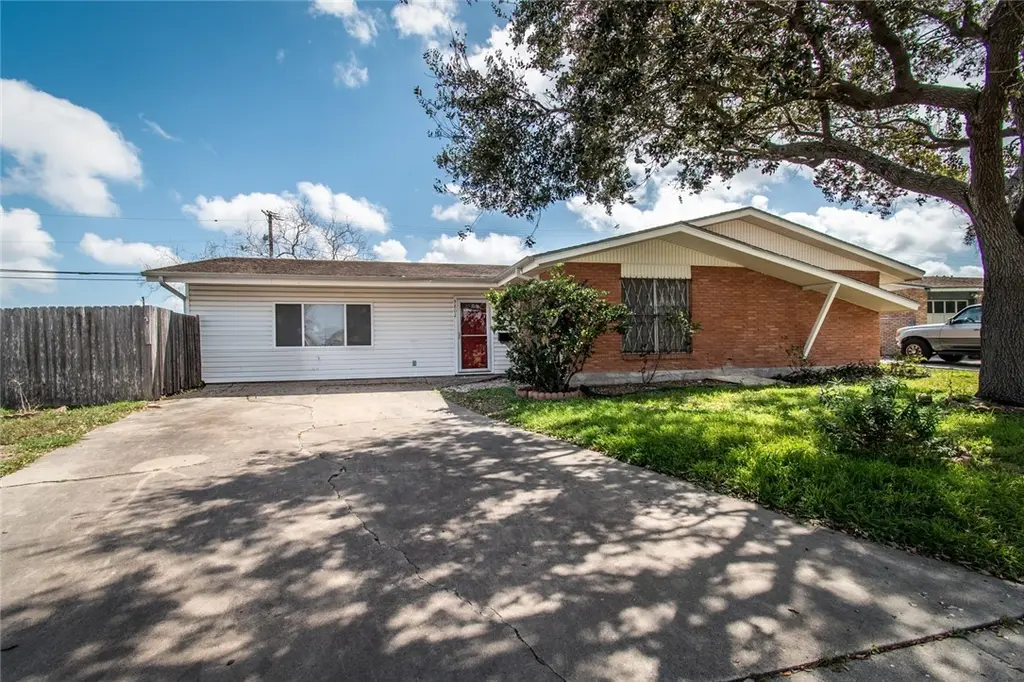
5802 Limerick Dr · Corpus Christi, TX
Flood risk 6/10 · Moderate
- FEMA flood zone
- X (unshaded)
- Chance of flooding over 30 yrs
- 0.69%
- Est. flood insurance / yr
- $507 – $1,088
Fire risk 1/10 · Minimal
- Est. fire insurance / yr
- $1,222 – $2,270
Heat risk 10/10 · Severe
- Hot days now (above 107°F)
- 6 days/yr
- Hot days in 30 yrs
- 23 days/yr
Wind risk 9/10 · Severe
- Chance of severe wind over 30 yrs
- 99.0%
Air-quality risk 1/10 · Minimal
- Unhealthy air days now
- 0 days/yr
- Unhealthy air days in 30 yrs
- 0 days/yr
Risk factors via First Street. Map © Google.
Why this score? — see what drove the C- grade
The composite is a weighted blend of 9 inputs, each scored 0–100. Each bar is that input's sub-score; the figure is the points it added to the 100-point composite (weight × sub-score).
- Cash flow +15.4/30.0
- ARV discount +15.0/15.0
- 1% rule +4.9/10.0
- DSCR +4.7/10.0
- Livability +3.9/5.0
- Schools +2.8/10.0
- Condition / age +2.5/5.0
- Rent growth +1.4/5.0
- Appreciation +0.0/10.0
$199,900
🖨 Deal sheet 📄 Offer letter ✓ Due diligence
Listing remarks
Welcome to this spacious 4-bedroom, 2-bath home located in the established Schanen Estates neighborhood. Situated on a large corner lot, this property offers extra yard space, added privacy, and great curb appeal. Inside, you’ll find a comfortable layout with generous living areas and plenty of natural light. The home features four well-sized bedrooms and two full bathrooms. Step outside and enjoy the screened-in porch, perfect for relaxing, entertaining, or enjoying the outdoors without the bugs. Located in a quiet, established neighborhood, this home offers a great balance of space, comfort, and convenience with easy access to local shopping, dining, and schools. Book your showing t
Key facts
- Screened-in porch
- Extra yard space
- Corner lot
Tags
Neighborhood map
What this means for you Summary
Snapshot
- This is a 4-bed/2.0-bath single-family listed at $200k.
Deal economics
- At list price, monthly cash flow is $78 ($938/yr) — positive.
- The deal already cash-flows at list — no discount required.
- To meet the 1% rule (rent ≥ 1% of price), the offer needs to be $198k (0.9% below list).
- Recommended offer: $188k (6.0% below list) — sets the bar for market timing.
- Cap rate 6.8% vs local median 3.6% in Corpus Christi — top-decile yield for the area; either an underpriced asset or a hidden risk that comps aren't pricing in. Stress-test before assuming the spread holds.
Location & tenants
- Location reads 78/100 on livability (#66 in TX, #2,404 nationally) — a middle-class / working-renter tenant base. Strengths: commute A+, cost of living A+, housing A+; Watch: crime F.
- Corpus Christi ISD (urban): math 31% / reading 35% proficiency, ranked #562 of 826 in TX (top 68%) — families likely to look elsewhere, expect single-tenant / working-renter base with shorter leases; 63% free/reduced lunch — lower-income household profile, screen leases tightly.
- Market conditions: Rents falling (-4.5%/yr); 220 active listings in the ZIP; 27 comparable units currently listed for rent nearby; rentals leasing fast (median 14d on market — plan ~1-2 weeks tenant-placement turnaround); 41% of comp listings sitting > 30 days — soft ceiling on asking rent; 1,397 units permitted in Nueces County in 2024 (47 in 5+ unit buildings).
- This rent runs 33% of the median local income ($73k/yr) — at the standard rent-burdened threshold; future hikes will face affordability resistance.
Forward outlook
- Local home prices are declining (-3.0%/yr); year-one equity from $1k of loan paydown is wiped out by about $6k of value loss. Plan a longer hold.
- Nueces County population projected at +36% by 2050 — long-run rental-demand tailwind backs the buy-and-hold thesis.
Negotiation context
- It's been on market 70 days — a 6% lower offer ($188k) is reasonable based on typical stale-listing flexibility.
- 5 sale attempts since 4y ago; this cycle's ask is 11323% above the opening price — seller raised mid-cycle; expect resistance to lowballs.
- Current owner paid $52k; list at $200k implies a 285% gain — meaningful room to come down on a strong offer.
Risks & watch-outs
- Climate carrying-cost: major flood risk; severe wind risk, 99% chance of damaging wind over 30y; extreme-heat days projected 6→23/yr by 2055 (HVAC capex compounding) — expect insurance premiums to compound above CPI over the hold.
Questions for the listing agent
- It's been on market 70 days. Have you received any prior offers? Is the seller open to a 6% concession, seller financing, or rate buy-down credit?
- Built in 1961 — when were the roof, HVAC, electrical panel, plumbing, and water heater last replaced?
- Why hasn't it sold? Are there any deal-killer items the seller is aware of (foundation, flood, title, zoning, code violations)?
- Is there a deadline driving the sale (1031 exchange, divorce, estate, relocation)? That informs how much negotiation room exists.
- Crime grade is F in this area — have there been break-ins, vandalism, or insurance claims at this property in the last 3 years? What carrier currently insures it and at what premium?
- What's the average days-on-market for RENTAL listings here right now (not sales)? A rising rental-DOM trend means longer vacancies and softer asking-rent achievability than the comps imply.
- What's the recent tenant-quality profile in this submarket — average credit score on applications, eviction rate, late-payment / NSF rate, and stable-employment percentage? A property-management company in the area should have these aggregated.
- How much new for-sale + rental construction is in the pipeline within 1–3 miles? Heavy new supply typically softens prices + rents 12–24 months out; constrained supply supports both.
Investment metrics
- 1% rule
- 0.99% ✗
- Cap rate
- 6.76%
- Cash-on-cash
- 1.68%
- DSCR
- 1.07
- GRM
- 8.4
CMA / ARV
- ARV (median comp)
- $245,385
- List price
- $199,900
- Delta
- -18.54%
- Verdict
- UNDERPRICED
- Comps
- 20 within 1.0 mi
Show comp detail 12 sales within ~0.75 mi
| Address | Dist | Beds/Ba | Sqft | Sold | Price | $/sf | Match |
|---|---|---|---|---|---|---|---|
| 4725 Shea Pkwy | 0.18mi | 3/2.0 (-1) | 1,979 (+4%) | 4mo | $259,000 | $131 | 77 |
| 4633 Haverhill | 0.15mi | 4/3.0 | 2,000 (+5%) | 11mo | $254,999 | $127 | 72 |
| 5014 Bromley Dr | 0.42mi | 4/3.0 | 2,060 (+8%) | 1mo | $260,000 | $126 | 62 |
| 5306 Crestwick Dr | 0.72mi | 3/2.0 (-1) | 1,896 (-0%) | 6mo | $270,000 | $142 | 56 |
| 5301 Bromley Dr | 0.70mi | 4/2.0 | 1,994 (+5%) | 8mo | $255,000 | $128 | 52 |
| 4721 Gayle Dr | 0.33mi | 3/2.0 (-1) | 1,666 (-12%) | 9mo | $189,900 | $114 | 52 |
| 4705 Donegal Dr | 0.39mi | 4/2.0 | 1,633 (-14%) | 10mo | $234,000 | $143 | 50 |
| 5413 Flynn Pkwy | 0.60mi | 4/2.0 | 1,647 (-13%) | 4mo | $245,000 | $149 | 46 |
| 5351 Flynn Pkwy | 0.65mi | 4/2.0 | 1,674 (-12%) | 10mo | $218,000 | $130 | 42 |
| 5801 Saint Andrews Dr | 0.54mi | 3/2.0 (-1) | 2,151 (+13%) | 10mo | $265,000 | $123 | 39 |
| 4170 Monaco St | 0.69mi | 5/3.0 (+1) | 2,137 (+12%) | 6mo | $304,900 | $143 | 33 |
| 4338 Murphey Dr | 0.72mi | 3/2.0 (-1) | 1,634 (-14%) | 10mo | $249,900 | $153 | 30 |
Match score weights: distance 35% · size 25% · config 20% · recency 20%. Top-matched comps best support the ARV.
Projected returns pro-forma
-3.0% appreciation · 0.0% rent growth · sell at horizon
- IRR
- -17.3%
- Equity multiple
- 0.41×
- Total profit
- $-33,125
- Equity at exit
- $29,806
- IRR
- -16.8%
- Equity multiple
- 0.21×
- Total profit
- $-44,492
- Equity at exit
- $17,284
Cash invested: $55,972 (down + closing). Projections, not guarantees.
Landlord ↔ Tenant lean methodology
- Overall (STATE)
- 87 Strongly Landlord-Friendly
- State Texas
- 87 Strongly Landlord-Friendly · R+5
- County
- — inherits STATE
- City
- — inherits STATE
ZIP-level market 78413
- Rents YoY
- -4.5%
- Active inventory
- 220
- Price-to-rent
- 8.4×
Monthly cashflow live
- Estimated rent
- $1,982 high interval (Pro) →
- Mortgage (P&I)
- −$1,048
- Tax from tax record
- −$356 /mo · $4,271/yr
- Insurance
- −$83
- HOA
- −$0
- Vacancy / Maint / Mgmt
- −$416
- Net cashflow
- $78
Break-even live
UW: 25.0% down · 7.5% · 30yr · 1.5% tax · 5.0% vac · 8.0% maint · 8.0% mgmt
Financing live
Cash to close
- Down payment
- $49,975
- Closing costs
- $5,997
- Reserves months
- —
- Total cash needed
- —
Loan-product check · same deal, 3 products live
Conventional
25% down · 7.5% · 30yr
- Down + closing
- —
- Monthly P&I
- —
- Monthly cashflow
- —
- DSCR
- —
- Eligible?
- —
Personal DTI + credit; lowest rate.
DSCR
20% down · 8.5% · 30yr
- Down + closing
- —
- Monthly P&I
- —
- Monthly cashflow
- —
- DSCR
- —
- Eligible?
- —
No personal income docs; deal must DSCR.
Hard money
10% down · 12.0% · 12mo
- Down + closing
- —
- Monthly P&I
- —
- Monthly cashflow
- —
- DSCR
- —
- Eligible?
- —
Short-term bridge; refi at stabilization.
Rent comps 27 comps
| Address | Beds | Baths | Sqft | Rent | $/sqft | DOM | Units | Dist |
|---|---|---|---|---|---|---|---|---|
| 4717 S Shea Pkwy Corpus Christi, TX | 3.0 | 2.0 | 1284 | $1,695 | $1.32 | 44d | 1 | 0.20mi |
| 4610 Donegal Dr Corpus Christi, TX | 4.0 | 2.0 | 2162 | $2,150 | $0.99 | 13d | 1 | 0.41mi |
| 4438 Donegal Dr Corpus Christi, TX | 3.0 | 2.0 | 1628 | $1,900 | $1.17 | 13d | 1 | 0.42mi |
| 4406 Donegal Dr Corpus Christi, TX | 3.0 | 2.0 | 1338 | $1,800 | $1.35 | 13d | 1 | 0.45mi |
| 5025 Romford Dr Corpus Christi, TX | 4.0 | 3.5 | 2471 | $3,195 | $1.29 | 13d | 1 | 0.47mi |
| 4402 Sutton Ln Corpus Christi, TX | 4.0 | 2.0 | 1850 | $2,100 | $1.14 | 13d | 1 | 0.48mi |
| 5122 Moultrie Dr Corpus Christi, TX | 4.0 | 2.0 | 2303 | $2,620 | $1.14 | 13d | 1 | 0.71mi |
| 4114 Cork Dr Corpus Christi, TX | 3.0 | 2.0 | 1296 | $1,595 | $1.23 | 13d | 1 | 0.77mi |
| 4117 Monaco Dr Corpus Christi, TX | 5.0 | 2.0 | 1483 | $2,100 | $1.42 | 13d | 1 | 0.81mi |
| 97 Lake Shore Dr Corpus Christi, TX | 3.0 | 2.5 | 2030 | $1,895 | $0.93 | 43d | 1 | 0.83mi |
| 4013 Kingston Dr Corpus Christi, TX | 3.0 | 2.0 | 1451 | $2,500 | $1.72 | 43d | 1 | 0.90mi |
| 4006 Panama Dr Corpus Christi, TX | 3.0 | 2.0 | 1816 | $1,949 | $1.07 | 21d | 1 | 0.96mi |
| 4009 Donaho Dr Corpus Christi, TX | 3.0 | 2.0 | 2187 | $2,400 | $1.10 | 43d | 1 | 1.01mi |
| 4937 Holmes Dr Corpus Christi, TX | 4.0 | 2.5 | 2442 | $2,595 | $1.06 | 13d | 1 | 1.07mi |
| 4830 French Dr Corpus Christi, TX | 3.0 | 2.0 | 1299 | $1,700 | $1.31 | 13d | 1 | 1.18mi |
| 5430 Saratoga Blvd Corpus Christi, TX | 1.0–3.0 | 1.0–2.5 | 1050 | $1,764 | $1.68 | 43d | 45 | 1.18mi |
| 5133 Middlecoff Cir Unit B Corpus Christi, TX | 3.0 | 2.5 | 1360 | $1,650 | $1.21 | 43d | 1 | 1.19mi |
| 4801 Lansdown Dr Corpus Christi, TX | 3.0 | 2.0 | 1242 | $1,525 | $1.23 | 13d | 1 | 1.22mi |
| 4809 Goldeneye Dr Corpus Christi, TX | 3.0 | 2.0 | 1885 | $1,995 | $1.06 | 13d | 1 | 1.28mi |
| 4205 Walnut Hills Dr Unit B Corpus Christi, TX | 3.0 | 2.5 | 2600 | $1,895 | $0.73 | 43d | 1 | 1.33mi |
| 3802 Saratoga Blvd Corpus Christi, TX | 1.0–3.0 | 1.0–2.0 | 1258 | $2,319 | $1.84 | 13d | 1 | 1.35mi |
| 6210 Brewton Dr Corpus Christi, TX | 3.0 | 2.0 | 1618 | $1,900 | $1.17 | 44d | 1 | 1.36mi |
| 4717 Edith St Unit 1268436P Corpus Christi, TX | 4.0 | 2.0 | 1496 | $4,708 | $3.15 | 43d | 1 | 1.37mi |
| 4154 Eagle Dr Corpus Christi, TX | 3.0 | 2.0 | 1843 | $1,950 | $1.06 | 43d | 1 | 1.39mi |
| 5002 Bevly Dr Unit A Corpus Christi, TX | 3.0 | 2.0 | 1400 | $1,499 | $1.07 | 21d | 1 | 1.42mi |
| 1066 Burkshire Dr Corpus Christi, TX | 3.0 | 2.0 | 2063 | $1,900 | $0.92 | 44d | 1 | 1.45mi |
| 1137 Bradshaw Dr Corpus Christi, TX | 3.0 | 2.0 | 1424 | $1,900 | $1.33 | 13d | 1 | 1.48mi |
Listing history 13 events
-
2025-02-17historical $1,750
-
2025-01-22$1,750
-
2024-09-26price $229,900
-
2024-05-25status Active
-
2024-04-13status Pending
-
2024-04-03historical Active Under Contract
-
2024-03-27$239,900 Active
-
2022-12-16historical
-
2022-10-13status Active
-
2022-09-21historical
-
2022-08-25price $239,900
-
2022-08-01$250,000 Active
-
1994-01-18soldstatus $51,900
ⓘ Source: listings_history table (triggers on properties + properties_extension) + one-shot
backfill from property_details.listing_events for pre-trigger history.
Tax reassessment forecast TX · Resets to sale price
- Current annual tax
- $4,271 · $356/mo
- Projected year-2 tax
- $4,271 · $356/mo
- Expected delta
- $0/yr ($0/mo · 0.0%)
ⓘ Screening estimate from a state-policy table — verify with the county assessor before closing.
Climate risk First Street
- Flood 6/10 Major FEMA zone X (unshaded) · 69% chance over 30 yrs
- Wildfire 1/10 Low
- Heat 10/10 Extreme 6 d/yr ≥107°F today · 23 d/yr by 30 yrs out
- Wind 9/10 Extreme 99% chance of damaging wind over 30 yrs
- Air quality 1/10 Low 0 unhealthy d/yr today · 0 by 30 yrs out
Nearby sold comps map
Loading sold comps map…
Walkable amenities ~0.75 mi
Loading nearby amenities…
Taxation est. · year 1
- Rental income
- $23,783
- − Mortgage interest
- −$11,198
- − Property taxes
- −$4,271
- − Insurance
- −$1,000
- − Repairs & maintenance
- −$1,903
- − Management
- −$1,903
- − Depreciation
- −$5,815
- Taxable loss
- −$2,306
- Est. tax savings @ 24.0%
- +$553
- After-tax cash flow
- $1,492/yr
For passive investors: Depreciation is non-cash, so a rental often shows a tax loss while cash-flowing — sheltering income. Rental losses are passive: they offset passive income freely, and up to $25,000/yr can offset ordinary (W-2) income if you actively participate and your MAGI is under $100k (phasing out to $0 by $150k); unused losses carry forward. On sale, claimed depreciation is recaptured at up to 25%, and gains may owe capital-gains tax (a 1031 exchange can defer both). Figures are a year-1 estimate at your 24.0% rate — not tax advice; consult a CPA.
Schools (NCES district)
- District
- Corpus Christi ISD
- NCES district ID
- 4815270
- Math proficiency
- 31% ▼ -18.00%
- Reading proficiency
- 35% ▼ -7.00%
- Median HH income
- $45,672
- Composite
- 28.27/100
- National rank
- #6793
- State rank
- #562 of 826 in TX
Livability — Corpus Christi
- Score
- 78/100
- State rank
- #66
- US rank
- #2404
Category grades
Schools grade is shown separately in the Schools card above.
Census & demographics
- Census place
- Corpus Christi, TX
- County
- Nueces County · 296,836 people
- City population
- 296,836
- Metro
- Corpus Christi, TX
- Population (ZIP)
- 34,289
- Household income
- $72,815
- Rent vs Own
- Severe rent burden
- 1280.0
Population outlook (Nueces County) Hauer SSP2
- Today (2025)
- 418,037 people
- By 2030
- 447,123 · +7.0%
- By 2040
- 505,911 · +21.0%
- By 2050
- 567,522 · +35.8%
- By 2075
- 729,686 · +74.6%
- By 2100
- 847,087 · +102.6%
Race, ethnicity, and origin ACS 2023
- Neighborhood character
- Majority Hispanic (60%)
- Race & ethnicity
- Hispanic / Latino 60% White 31% Two or more races 29% Black 4% Asian 3%
- Hispanic origin (detail)
- Mexican 53%
- Common ancestry
- Lithuanian 1% Serbian 1% Slovak 1%
- Foreign-born
- 8% · Canada, South Korea, China
- Languages at home
- 74% English-only · Spanish 22% Tagalog/Filipino 1% Other Indo-European 1%
Political lean MEDSL · Nueces
- 2024 margin
- R (+11.5) · D 43.8% · R 55.3%
- 2008→2024 swing
- -7.1pp toward R · 2008: -4.4pp · 2024: -11.5pp
- All cycles
- 2024: R+11.5 2020: R+2.9 2016: R+1.5 2012: R+3.2 2008: R+4.4
Not yet ingested
- Civics
- —
Market trends
- HPI YoY
- ▼ -215.69%
- Current HPI
- 173.8376
- Rent YoY
- ▼ -4.46%
- Metro
- Corpus Christi, TX
- State GDP YoY
- ▲ 3.95%
- F500 in state
- 110
Industry mix (Fortune 500 HQ in TX)
| Industry | F500 HQs | Revenue |
|---|---|---|
| Energy | 16 | $1,198B |
|
||
| Technology | 5 | $198B |
|
||
| Engineering / Construction | 4 | $72B |
|
||
| Energy Services | 3 | $60B |
|
||
| Utilities | 3 | $41B |
|
||
| Healthcare | 2 | $330B |
|
||
Price history
-96.6% since first listed13 events — show timeline
- 2025-02-17 Rental Removed $1,750 APPFOLIO
- 2025-01-22 Listed for Rent $1,750 APPFOLIO
- 2024-09-26 Price Changed $229,900 CBMLS
- 2024-05-25 Relisted — CBMLS
- 2024-04-13 Pending — CBMLS
- 2024-04-03 Contingent — CBMLS
- 2024-03-27 Listed $239,900 CBMLS
- 2022-12-16 Rental Removed — RENT.
- 2022-10-13 Relisted — CBMLS
- 2022-09-21 Delisted — CBMLS
- 2022-08-25 Price Changed $239,900 CBMLS
- 2022-08-01 Listed $250,000 CBMLS
- 1994-01-18 Sold (Public Records) $51,900 Public Records
Property tax history
+3.7%/yrLatest (2025): $4,271 · +6.1% YoY. Source: county tax records.
Cash-flow waterfall
monthlySold comps — $/sqft
last 12 mo · ≤1 miLoading sold comps…