6217 Plymouth Rock Ln, · Citrus Heights, CA
Flood risk 5/10 · Moderate
- FEMA flood zone
- X (unshaded)
- Chance of flooding over 30 yrs
- 0.32%
- Est. flood insurance / yr
- $507 – $1,088
Fire risk 1/10 · Minimal
- Est. fire insurance / yr
- $659 – $1,223
Heat risk 7/10 · Major
- Hot days now (above 102°F)
- 7 days/yr
- Hot days in 30 yrs
- 16 days/yr
Wind risk 1/10 · Minimal
- Chance of severe wind over 30 yrs
- —
Air-quality risk 10/10 · Severe
- Unhealthy air days now
- 34 days/yr
- Unhealthy air days in 30 yrs
- 36 days/yr
Risk factors via First Street. Map © Google.
Why this score? — see what drove the C+ grade
The composite is a weighted blend of 9 inputs, each scored 0–100. Each bar is that input's sub-score; the figure is the points it added to the 100-point composite (weight × sub-score).
- Cash flow +30.0/30.0
- 1% rule +10.0/10.0
- DSCR +10.0/10.0
- Schools +4.4/10.0
- Rent growth +3.0/5.0
- Livability +3.0/5.0
- Condition / age +2.5/5.0
- ARV discount +0.0/15.0
- Appreciation +0.0/10.0
$48,888
🖨 Deal sheet 📄 Offer letter ✓ Due diligence
Listing remarks MLS
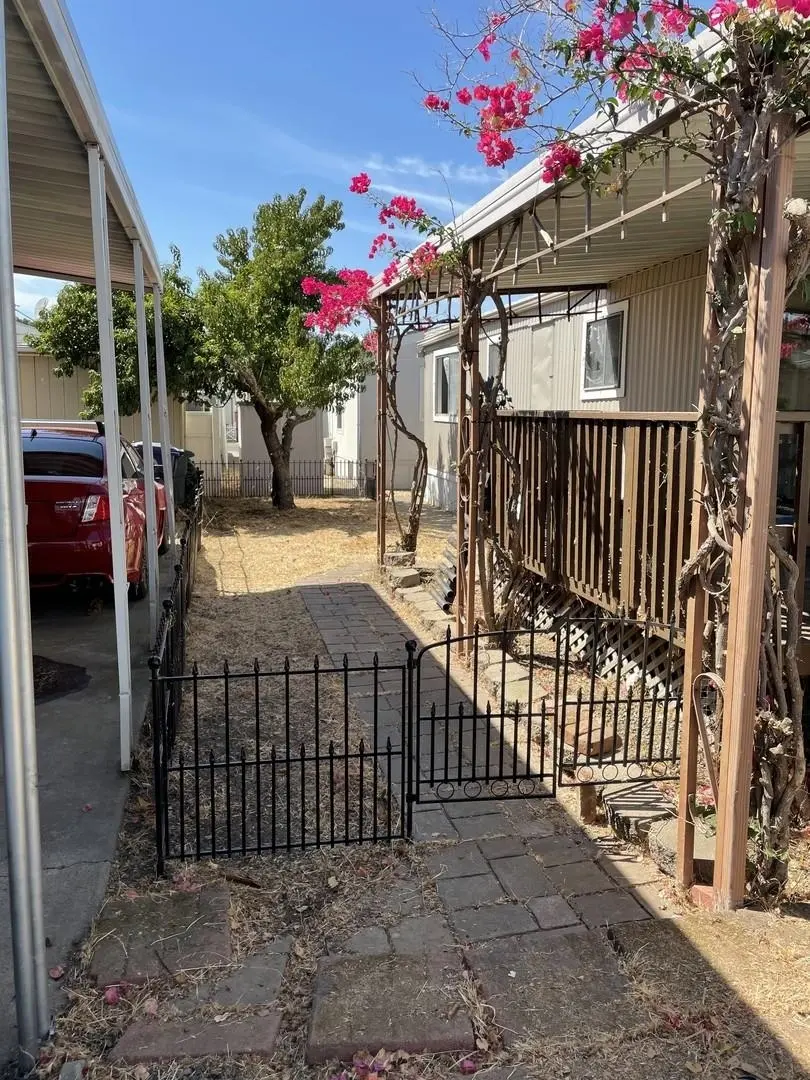
**$1000 cash and 3 months FREE RENT ** ASK ME HOW ** CAN ASSIST WITH FINANCING, MIN 5% DOWN **. This lovely, well-maintained 2 bedroom, 1 bathroom is ready for your family to call home! Features include a covered porch, 2 storage sheds, a 2 car carport. Located in desirable Creekside Estates. Some of the amenities include a relaxing swimming pool, play area for children, a community garden, and a clubhouse for entertaining. Close to freeway, shopping, and public transportation.
Key facts
- Covered porch
- Play area
- Carport
Tags
Neighborhood map
What this means for you Summary
Snapshot
- This is a 2-bed/1.0-bath manufactured listed at $49k.
Deal economics
- At list price, monthly cash flow is $1k ($15k/yr) — positive.
- The deal already cash-flows at list — no discount required.
- Meets the 1% rule at list price ($2k rent vs $49k).
- Recommended offer: $43k (12.0% below list) — sets the bar for market timing.
- Cap rate 36.7% vs local median 3.4% in Citrus Heights — top-decile yield for the area; either an underpriced asset or a hidden risk that comps aren't pricing in. Stress-test before assuming the spread holds.
Location & tenants
- Location reads 60/100 on livability (#614 in CA) — a middle-class / working-renter tenant base. Strengths: housing A+; Watch: schools D, crime D-, amenities F.
- San Juan Unified (suburban): math 40% / reading 62% proficiency, ranked #138 of 517 in CA (top 27%) — acceptable for families but not a draw, mixed tenant base, ~2y average lease.
- Market conditions: Rents rising (+1.9%/yr); 210 active listings in the ZIP; 12 comparable units currently listed for rent nearby; rentals leasing fast (median 3d on market — plan ~1-2 weeks tenant-placement turnaround); solid renter incomes; 6,825 units permitted in Sacramento County in 2024 (1,752 in 5+ unit buildings).
Forward outlook
- Local home prices are declining (-3.0%/yr); year-one equity from $338 of loan paydown is wiped out by about $1k of value loss. Plan a longer hold.
- Sacramento County population projected at +17% by 2050 — long-run rental-demand tailwind backs the buy-and-hold thesis.
- At projected returns (-3.0% appreciation + 1.9% rent growth), your $14k cash investment doubles in ~1 year — after that, you're playing with house money.
Negotiation context
- It's been on market 170 days — a 12% lower offer ($43k) is reasonable based on typical stale-listing flexibility.
- 2 sale attempts with the ask held roughly flat each time — persistent listings suggest the price (not the market) is what's stuck; bring a comps-based counter.
Risks & watch-outs
- Climate carrying-cost: moderate flood risk; extreme-heat days projected 7→16/yr by 2055 (HVAC capex compounding) — expect insurance premiums to compound above CPI over the hold.
Questions for the listing agent
- It's been on market 170 days. Have you received any prior offers? Is the seller open to a 12% concession, seller financing, or rate buy-down credit?
- Built in 1977 — when were the roof, HVAC, electrical panel, plumbing, and water heater last replaced?
- Why hasn't it sold? Are there any deal-killer items the seller is aware of (foundation, flood, title, zoning, code violations)?
- Is there a deadline driving the sale (1031 exchange, divorce, estate, relocation)? That informs how much negotiation room exists.
- Schools are D-rated, which usually means shorter tenancies and higher turnover. Who's the typical renter profile here, and what's been the actual vacancy rate?
- Crime grade is D in this area — have there been break-ins, vandalism, or insurance claims at this property in the last 3 years? What carrier currently insures it and at what premium?
- What's the average days-on-market for RENTAL listings here right now (not sales)? A rising rental-DOM trend means longer vacancies and softer asking-rent achievability than the comps imply.
- What's the recent tenant-quality profile in this submarket — average credit score on applications, eviction rate, late-payment / NSF rate, and stable-employment percentage? A property-management company in the area should have these aggregated.
- How much new for-sale + rental construction is in the pipeline within 1–3 miles? Heavy new supply typically softens prices + rents 12–24 months out; constrained supply supports both.
Investment metrics
- 1% rule
- 3.96% ✓
- Cap rate
- 36.74%
- Cash-on-cash
- 108.74%
- DSCR
- 5.84
- GRM
- 2.1
CMA / ARV
- ARV (median comp)
- $39,408
- List price
- $48,888
- Delta
- 24.05%
- Verdict
- OVERPRICED
- Comps
- 9 within 1.0 mi
Show comp detail 7 sales within ~0.75 mi
| Address | Dist | Beds/Ba | Sqft | Sold | Price | $/sf | Match |
|---|---|---|---|---|---|---|---|
| 6222 Gettysburg Ln | 0.04mi | 2/1.0 | 672 (0%) | 17mo | $70,000 | $104 | 84 |
| 5935 Auburn Blvd #160 | 0.17mi | 2/1.5 | 684 (+2%) | 4mo | $45,000 | $66 | 84 |
| 5722 Clearwater Dr #18 | 0.30mi | 1/1.0 (-1) | 675 (+0%) | 1mo | $54,900 | $81 | 80 |
| 5935 Auburn Blvd #189 | 0.22mi | 2/2.0 | 690 (+3%) | 2mo | $29,900 | $43 | 79 |
| 5935 Auburn Blvd #78 | 0.23mi | 1/1.5 (-1) | 672 (0%) | 9mo | $38,000 | $57 | 74 |
| 6226 Manitoba Ave #70 | 0.29mi | 1/1.0 (-1) | 700 (+4%) | 12mo | $40,000 | $57 | 65 |
| 6219 Tyee Ave #142 | 0.18mi | 2/1.0 | 720 (+7%) | 20mo | $59,000 | $82 | 62 |
Match score weights: distance 35% · size 25% · config 20% · recency 20%. Top-matched comps best support the ARV.
Projected returns pro-forma
-3.0% appreciation · 1.9% rent growth · sell at horizon
- IRR
- —
- Equity multiple
- 6.04×
- Total profit
- $68,963
- Equity at exit
- $7,289
- IRR
- —
- Equity multiple
- 12.20×
- Total profit
- $153,269
- Equity at exit
- $4,227
Cash invested: $13,689 (down + closing). Projections, not guarantees.
Landlord ↔ Tenant lean methodology
- Overall (STATE)
- 18 Strongly Tenant-Friendly
- State California
- 18 Strongly Tenant-Friendly · D+13
- County
- — inherits STATE
- City
- — inherits STATE
ZIP-level market 95621
- Rents YoY
- 1.9%
- Active inventory
- 210
- Price-to-rent
- 2.1×
Monthly cashflow live
- Estimated rent
- $1,938 high interval (Pro) →
- Mortgage (P&I)
- −$256
- Tax from tax record
- −$14 /mo · $168/yr
- Insurance
- −$20
- HOA
- −$0
- Vacancy / Maint / Mgmt
- −$407
- Net cashflow
- $1,240
Break-even live
UW: 25.0% down · 7.5% · 30yr · 1.5% tax · 5.0% vac · 8.0% maint · 8.0% mgmt
Financing live
Cash to close
- Down payment
- $12,222
- Closing costs
- $1,467
- Reserves months
- —
- Total cash needed
- —
Loan-product check · same deal, 3 products live
Conventional
25% down · 7.5% · 30yr
- Down + closing
- —
- Monthly P&I
- —
- Monthly cashflow
- —
- DSCR
- —
- Eligible?
- —
Personal DTI + credit; lowest rate.
DSCR
20% down · 8.5% · 30yr
- Down + closing
- —
- Monthly P&I
- —
- Monthly cashflow
- —
- DSCR
- —
- Eligible?
- —
No personal income docs; deal must DSCR.
Hard money
10% down · 12.0% · 12mo
- Down + closing
- —
- Monthly P&I
- —
- Monthly cashflow
- —
- DSCR
- —
- Eligible?
- —
Short-term bridge; refi at stabilization.
Rent comps 12 comps
| Address | Beds | Baths | Sqft | Rent | $/sqft | DOM | Units | Dist |
|---|---|---|---|---|---|---|---|---|
| 6011 Shadow Ln Citrus Heights, CA | 1.0–2.0 | 1.0–2.0 | 779 | $2,348 | $3.01 | 1d | 15 | 0.20mi |
| 5979 Devecchi Ave Citrus Heights, CA | 1.0–2.0 | 1.0–2.0 | 775 | $1,871 | $2.41 | 1d | 15 | 0.28mi |
| 6430 Verner Ave Sacramento, CA | 1.0–2.0 | 1.0–2.0 | 705 | $2,295 | $3.25 | 23d | 1 | 0.50mi |
| 5501 Keoncrest Cir Unit 1 Sacramento, CA | 2.0 | 1.0 | 750 | $1,300 | $1.73 | 1d | 1 | 0.80mi |
| 6546 Auburn Blvd Citrus Heights, CA | 2.0 | 1.0 | 624 | $1,853 | $2.97 | 4d | 10 | 0.88mi |
| 6650 Crosswoods Cir Citrus Heights, CA | 1.0 | 1.0 | 465 | $1,575 | $3.39 | 1d | 6 | 1.19mi |
| 5244 Hackberry Ln Sacramento, CA | 2.0 | 1.0 | 712 | $1,712 | $2.41 | 43d | 1 | 1.21mi |
| 5425 Garfield Ave Sacramento, CA | 1.0–2.0 | 1.0–2.0 | 787 | $1,650 | $2.10 | 20d | 5 | 1.22mi |
| 5322 Hemlock St Sacramento, CA | 1.0–2.0 | 1.0 | 800 | $1,875 | $2.34 | 1d | 2 | 1.28mi |
| 5500 Foothill Garden Ct Sacramento, CA | 1.0 | 1.0 | 750 | $1,472 | $1.96 | 1d | 2 | 1.31mi |
| 5755 Callie Ln Sacramento, CA | 1.0–2.0 | 1.0–2.0 | 723 | $2,000 | $2.76 | 3d | 13 | 1.35mi |
| 5226 Hemlock St #35 Sacramento, CA | 1.0 | 1.0 | 682 | $1,650 | $2.42 | 23d | 1 | 1.42mi |
Listing history 17 events
-
2026-06-18days on market $48,888 Active 170 DOM
-
2026-06-17days on market $48,888 Active 169 DOM
-
2026-06-16days on market $48,888 Active 168 DOM
-
2026-06-15days on market $48,888 Active 167 DOM
-
2026-06-13days on market $48,888 Active 165 DOM
-
2026-06-13days on market $48,888 Active 164 DOM
-
2026-06-09days on market $48,888 Active 161 DOM
-
2026-06-08days on market $48,888 Active 160 DOM
-
2026-06-07days on market $48,888 Active 159 DOM
-
2026-06-05days on market $48,888 Active 156 DOM
-
2026-06-03days on market $48,888 Active 155 DOM
-
2026-06-02days on market $48,888 Active 154 DOM
-
2026-06-01days on market $48,888 Active 153 DOM
-
2026-05-31days on market $48,888 Active 152 DOM
-
2025-12-30$48,888 Active 482-char remark
Show marketing remark (482 chars)
**$1000 cash and 3 months FREE RENT ** ASK ME HOW ** CAN ASSIST WITH FINANCING, MIN 5% DOWN **. This lovely, well-maintained 2 bedroom, 1 bathroom is ready for your family to call home! Features include a covered porch, 2 storage sheds, a 2 car carport. Located in desirable Creekside Estates. Some of the amenities include a relaxing swimming pool, play area for children, a community garden, and a clubhouse for entertaining. Close to freeway, shopping, and public transportation.
-
2025-09-18historical
-
2025-09-06Active
ⓘ Source: listings_history table (triggers on properties + properties_extension) + one-shot
backfill from property_details.listing_events for pre-trigger history.
Tax reassessment forecast CA · Resets to sale price
- Current annual tax
- $168 · $14/mo
- Projected year-2 tax
- $372 · $31/mo
- Expected delta
- +$204/yr (+$17/mo · 121.7%)
ⓘ Screening estimate from a state-policy table — verify with the county assessor before closing.
Climate risk First Street
- Flood 5/10 Major FEMA zone X (unshaded) · 32% chance over 30 yrs
- Wildfire 1/10 Low
- Heat 7/10 Severe 7 d/yr ≥102°F today · 16 d/yr by 30 yrs out
- Wind 1/10 Low
- Air quality 10/10 Extreme 34 unhealthy d/yr today · 36 by 30 yrs out
Nearby sold comps map
Loading sold comps map…
Walkable amenities ~0.75 mi
Loading nearby amenities…
Taxation est. · year 1
- Rental income
- $23,259
- − Mortgage interest
- −$2,738
- − Property taxes
- −$168
- − Insurance
- −$244
- − Repairs & maintenance
- −$1,861
- − Management
- −$1,861
- − Depreciation
- −$1,422
- Taxable income
- $14,964
- Est. tax owed @ 24.0%
- −$3,591
- After-tax cash flow
- $11,294/yr
For passive investors: Depreciation is non-cash, so a rental often shows a tax loss while cash-flowing — sheltering income. Rental losses are passive: they offset passive income freely, and up to $25,000/yr can offset ordinary (W-2) income if you actively participate and your MAGI is under $100k (phasing out to $0 by $150k); unused losses carry forward. On sale, claimed depreciation is recaptured at up to 25%, and gains may owe capital-gains tax (a 1031 exchange can defer both). Figures are a year-1 estimate at your 24.0% rate — not tax advice; consult a CPA.
Schools (NCES district)
- District
- San Juan Unified
- NCES district ID
- 0634620
- Math proficiency
- 40% ▲ 3.00%
- Reading proficiency
- 62% ▲ 16.00%
- Median HH income
- $55,655
- Composite
- 44.07/100
- National rank
- #2878
- State rank
- #138 of 517 in CA
Livability — Citrus Heights
- Score
- 60/100
- State rank
- #614
- US rank
- #19580
Category grades
Schools grade is shown separately in the Schools card above.
Census & demographics
- Census place
- Citrus Heights, CA
- County
- Sacramento County · 1,539,646 people
- City population
- 89,370
- Metro
- Sacramento-Roseville-Folsom, CA
- Population (ZIP)
- 42,442
- Household income
- $80,901
- Rent vs Own
- Severe rent burden
- 1854.0
Population outlook (Sacramento County) Hauer SSP2
- Today (2025)
- 1,660,763 people
- By 2030
- 1,732,990 · +4.3%
- By 2040
- 1,855,755 · +11.7%
- By 2050
- 1,941,335 · +16.9%
- By 2075
- 2,046,162 · +23.2%
- By 2100
- 1,961,444 · +18.1%
Race, ethnicity, and origin ACS 2023
- Neighborhood character
- Predominantly White (66%)
- Race & ethnicity
- White 66% Hispanic / Latino 19% Two or more races 11% Asian 6% Black 2%
- Hispanic origin (detail)
- Mexican 16%
- Common ancestry
- Subsaharan African 3% Lithuanian 3% Scotch-Irish 2%
- Foreign-born
- 15% · Canada, Vietnam
- Languages at home
- 78% English-only · Spanish 10% Russian/Polish/Slavic 6% Other Indo-European 3%
Political lean MEDSL · Sacramento
- 2024 margin
- D (+19.7) · D 58.1% · R 38.4% · Other 3.5%
- 2008→2024 swing
- +0.7pp no change · 2008: 19.0pp · 2024: 19.7pp
- All cycles
- 2024: D+19.7 2020: D+25.3 2016: D+23.7 2012: D+16.3 2008: D+19.0
Not yet ingested
- Civics
- —
Market trends
- HPI YoY
- ▼ -408.14%
- Current HPI
- 351.9333
- Rent YoY
- ▲ 1.90%
- Metro
- Sacramento-Roseville-Folsom, CA
- State GDP YoY
- ▲ 3.21%
- F500 in state
- 116
Industry mix (Fortune 500 HQ in CA)
| Industry | F500 HQs | Revenue |
|---|---|---|
| Technology | 27 | $1,492B |
|
||
| Financial Services | 3 | $174B |
|
||
| Retail | 3 | $44B |
|
||
| Insurance | 3 | $26B |
|
||
| Media / Entertainment | 2 | $115B |
|
||
| Pharmaceuticals / Biotech | 2 | $62B |
|
||
Price history
3 events — show timeline
- 2025-12-30 Listed $48,888 bridgeMLS, Bay East AOR, or Contra Costa AOR
- 2025-09-18 Listing Removed — bridgeMLS, Bay East AOR, or Contra Costa AOR
- 2025-09-06 Listed — bridgeMLS, Bay East AOR, or Contra Costa AOR
Property tax history
+5.3%/yrLatest (2025): $168 · +16.1% YoY. Source: county tax records.
Cash-flow waterfall
monthlySold comps — $/sqft
last 12 mo · ≤1 miLoading sold comps…