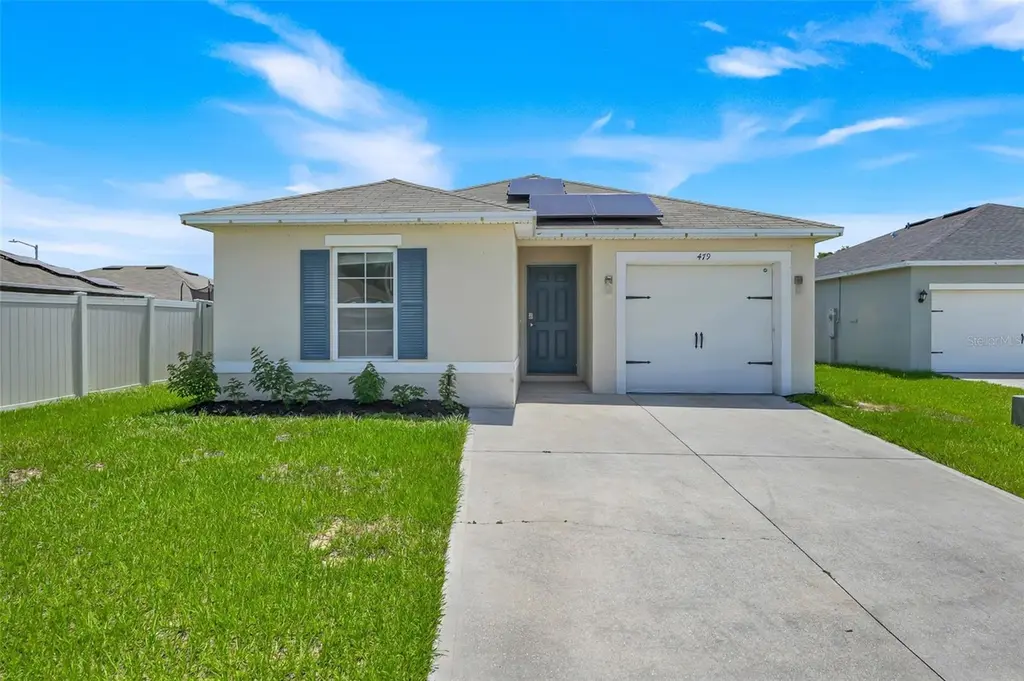
479 Jacks Way · Haines City, FL
Flood risk 1/10 · Minimal
- FEMA flood zone
- X (unshaded)
- Chance of flooding over 30 yrs
- 0.0%
- Est. flood insurance / yr
- $507 – $1,088
Fire risk 6/10 · Moderate
- Est. fire insurance / yr
- $947 – $1,759
Heat risk 8/10 · Major
- Hot days now (above 108°F)
- 7 days/yr
- Hot days in 30 yrs
- 23 days/yr
Wind risk 10/10 · Severe
- Chance of severe wind over 30 yrs
- 99.0%
Air-quality risk 1/10 · Minimal
- Unhealthy air days now
- 0 days/yr
- Unhealthy air days in 30 yrs
- 0 days/yr
Risk factors via First Street. Map © Google.
Why this score? — see what drove the D grade
The composite is a weighted blend of 9 inputs, each scored 0–100. Each bar is that input's sub-score; the figure is the points it added to the 100-point composite (weight × sub-score).
- Cash flow +12.2/30.0
- ARV discount +7.5/15.0
- Condition / age +4.8/5.0
- Livability +3.7/5.0
- DSCR +3.6/10.0
- Schools +3.5/10.0
- 1% rule +3.3/10.0
- Rent growth +1.8/5.0
- Appreciation +0.0/10.0
$270,000
🖨 Deal sheet 📄 Offer letter ✓ Due diligence
Listing remarks MLS
Under Construction. Great location in Davenport FL off of Hwy. 27 South with Shopping, Medical, Schools, and Restaurants just a few minutes away. This home is a 3 BR/ 2 BA/ with 1,239 Sq. Ft. LAYTON floor plan, located off of FDC Grove Rd. The home is all concrete block construction with Open Great Room off the kitchen, Amana Stainless Steel appliances which includes a Side by Side Refrigerator, Dishwasher, Stove and Range Hood. Appliances in the Kitchen. Master Bedroom is located in the rear of the home, with master bath vanity and a walk in closet and the other two bedrooms are located in the front of the home. Community is 10 minutes from I-4 and only 30 minutes to Disney World. * Photos are of similar model but not that of exact house. Pictures, photographs, colors, features, and sizes are for illustration purposes only and will vary from the homes as built. Home and community information including pricing, included features, terms, availability and amenities are subject to change and prior sale at any time without notice or obligation. Please note that no representations or warranties are made regarding school districts or school assignments; you should conduct your own investigation regarding current and future schools and school boundaries. Property taxes dollar amount is an approximate for data purposes only. *
Key facts
- Spacious backyard
- No rear neighbors
- Solar panels
Tags
Property features AI
Finance
- Other: Solar energy present; Energy-efficient insulation and windows; Irrigation uses reclaimed water
- HOA & community: Homeowners association with required fees (semi-annual association fee listed); Monthly HOA amount approximately $43.75; Community features include street lights; Pets allowed
Exterior
- Parking: Attached garage (1 car) — garage approximately 10 x 20
- Utilities: Public water; Public sewer; Electricity connected; Water connected; Sewer connected
- Home design: Single family residence; One story; Faces west
- Construction: Block and stucco construction; Shingle roof; Slab foundation; Built with living area 1,247 sq ft (public records)
- Exterior features: Sidewalk; Street dead-end; Paved driveway/road
Interior
- Kitchen: Microwave; Range; Refrigerator
- Bedrooms: 3 bedrooms
- Flooring: Carpet; Tile
- Bathrooms: 2 full bathrooms
- Heating & cooling: Electric heating; Central air conditioning
- Interior features: Walk-in closet(s); 8 total rooms
- Laundry & utility: Inside laundry room with electric dryer hookup; Irrigation equipment
Neighborhood map
What this means for you Summary
Snapshot
- This is a 3-bed/2.0-bath single-family listed at $270k. Condition is rated excellent.
Deal economics
- At list price, monthly cash flow is $-52 ($-629/yr) — negative.
- To cash-flow at today's rent, offer at most $261k (3.4% below list).
- To meet the 1% rule (rent ≥ 1% of price), the offer needs to be $223k (17.4% below list).
- Recommended offer: $223k (17.4% below list) — sets the bar for 1% rule.
Location & tenants
- Location reads 74/100 on livability (#285 in FL, #4,575 nationally) — a middle-class / working-renter tenant base. Strengths: crime A+, cost of living A+, housing A+; Watch: amenities F, commute F, employment F.
- Polk (suburban): math 39% / reading 43% proficiency, ranked #62 of 73 in FL (top 85%) — families likely to look elsewhere, expect single-tenant / working-renter base with shorter leases.
- Zoned schools: Horizons Elementary School (math 37% / reading 39%, grade F, #1,587 of 2,144 statewide, top 74%, 1,468 students, 42% FRL); Ridge Community High School (math 12% / reading 33%, grade F, #539 of 667 statewide, top 81%, 2,711 students, 48% FRL).
- Market conditions: Rents soft (-2.7%/yr); 1382 active listings in the ZIP; 8 comparable units currently listed for rent nearby; rentals at typical pace (median 14d on market — plan ~3-4 weeks tenant-placement turnaround); solid renter incomes; 10,384 units permitted in Polk County in 2024 (1,716 in 5+ unit buildings).
- This rent runs 33% of the median local income ($81k/yr) — at the standard rent-burdened threshold; future hikes will face affordability resistance.
Forward outlook
- Local home prices are declining (-3.0%/yr); year-one equity from $2k of loan paydown is wiped out by about $8k of value loss. Plan a longer hold.
- Polk County population projected at +33% by 2050 — long-run rental-demand tailwind backs the buy-and-hold thesis.
Negotiation context
- Only 9 days on market — expect competitive offers; lowballing is unlikely to land.
- 3 sale attempts since 5y ago with the ask held roughly flat each time — persistent listings suggest the price (not the market) is what's stuck; bring a comps-based counter.
Risks & watch-outs
- Climate carrying-cost: severe wind risk, 99% chance of damaging wind over 30y; major wildfire risk; extreme-heat days projected 7→23/yr by 2055 (HVAC capex compounding) — expect insurance premiums to compound above CPI over the hold.
Questions for the listing agent
- What do current leases actually rent for vs. the listed asking? Can we see a recent rent roll and the last 12 months of T-12 income?
- What does the HOA fee cover, when was the last increase, and are there any pending special assessments or reserve-fund shortfalls?
- Is there a deadline driving the sale (1031 exchange, divorce, estate, relocation)? That informs how much negotiation room exists.
- Schools are D-rated, which usually means shorter tenancies and higher turnover. Who's the typical renter profile here, and what's been the actual vacancy rate?
- The area grade is low — what's the realistic commute time and amenity access for the typical tenant pool here? Any planned neighborhood developments (good or bad) we should know about?
- What's the average days-on-market for RENTAL listings here right now (not sales)? A rising rental-DOM trend means longer vacancies and softer asking-rent achievability than the comps imply.
- What's the recent tenant-quality profile in this submarket — average credit score on applications, eviction rate, late-payment / NSF rate, and stable-employment percentage? A property-management company in the area should have these aggregated.
- How much new for-sale + rental construction is in the pipeline within 1–3 miles? Heavy new supply typically softens prices + rents 12–24 months out; constrained supply supports both.
Investment metrics
- 1% rule
- 0.83% ✗
- Cap rate
- 6.06%
- Cash-on-cash
- -0.83%
- DSCR
- 0.96
- GRM
- 10.1
CMA / ARV
No comps found within radius.
Projected returns pro-forma
-3.0% appreciation · 0.0% rent growth · sell at horizon
- IRR
- -21.0%
- Equity multiple
- 0.29×
- Total profit
- $-53,623
- Equity at exit
- $40,258
- IRR
- -23.0%
- Equity multiple
- -0.01×
- Total profit
- $-76,234
- Equity at exit
- $23,345
Cash invested: $75,600 (down + closing). Projections, not guarantees.
Landlord ↔ Tenant lean methodology
- Overall (STATE)
- 87 Strongly Landlord-Friendly
- State Florida
- 87 Strongly Landlord-Friendly · R+3
- County
- — inherits STATE
- City
- — inherits STATE
ZIP-level market 33837
- Home prices YoY
- -33.9%
- Rents YoY
- -2.7%
- Active inventory
- 1382
- Price-to-rent
- 10.1×
Monthly cashflow live
- Estimated rent
- $2,229 high interval (Pro) →
- Mortgage (P&I)
- −$1,416
- Tax from tax record
- −$242 /mo · $2,903/yr
- Insurance
- −$112
- HOA
- −$43
- Vacancy / Maint / Mgmt
- −$468
- Net cashflow
- $-52
Break-even live
UW: 25.0% down · 7.5% · 30yr · 1.5% tax · 5.0% vac · 8.0% maint · 8.0% mgmt
Financing live
Cash to close
- Down payment
- $67,500
- Closing costs
- $8,100
- Reserves months
- —
- Total cash needed
- —
Loan-product check · same deal, 3 products live
Conventional
25% down · 7.5% · 30yr
- Down + closing
- —
- Monthly P&I
- —
- Monthly cashflow
- —
- DSCR
- —
- Eligible?
- —
Personal DTI + credit; lowest rate.
DSCR
20% down · 8.5% · 30yr
- Down + closing
- —
- Monthly P&I
- —
- Monthly cashflow
- —
- DSCR
- —
- Eligible?
- —
No personal income docs; deal must DSCR.
Hard money
10% down · 12.0% · 12mo
- Down + closing
- —
- Monthly P&I
- —
- Monthly cashflow
- —
- DSCR
- —
- Eligible?
- —
Short-term bridge; refi at stabilization.
Rent comps 8 comps
| Address | Beds | Baths | Sqft | Rent | $/sqft | DOM | Units | Dist |
|---|---|---|---|---|---|---|---|---|
| 210 Garberia Dr Davenport, FL | 3.0 | 2.0 | 1433 | $1,995 | $1.39 | 2d | 1 | 0.14mi |
| 1548 Catbriar Way Davenport, FL | 3.0 | 2.0 | 1400 | $1,990 | $1.42 | 14d | 1 | 1.06mi |
| 1246 Westwinds Dr Davenport, FL | 3.0 | 2.0 | 1118 | $1,905 | $1.70 | 10d | 1 | 1.12mi |
| 730 Sierra Cir Davenport, FL | 3.0 | 2.0 | 1218 | $1,845 | $1.51 | 23d | 1 | 1.20mi |
| 223 Bergamot Loop Davenport, FL | 3.0 | 2.0 | 1080 | $2,300 | $2.13 | 2d | 1 | 1.33mi |
| 220 Champions Way Davenport, FL | 1.0–3.0 | 1.0–2.5 | 1107 | $1,997 | $1.80 | 2d | 7 | 1.35mi |
| 2441 Oakwood Ln Davenport, FL | 3.0 | 2.0 | 1420 | $2,199 | $1.55 | 23d | 1 | 1.41mi |
| 1188 Sugarwood St Davenport, FL | 3.0 | 2.0 | 1443 | $2,400 | $1.66 | 23d | 1 | 1.43mi |
HOA detail
- Monthly dues
- $43 · $516/yr
Listing history 7 events
-
2026-06-18days on market $270,000 Active 9 DOM
-
2026-06-17days on market $270,000 Active 8 DOM
-
2026-06-16days on market $270,000 Active 7 DOM
-
2026-06-15days on market $270,000 Active 6 DOM
-
2026-06-13days on market $270,000 Active 4 DOM
-
2026-06-10remarks 636-char remark
-
2026-06-10$270,000 Active 1 DOM
ⓘ Source: listings_history table (triggers on properties + properties_extension) + one-shot
backfill from property_details.listing_events for pre-trigger history.
Tax reassessment forecast FL · Resets to sale price
- Current annual tax
- $2,903 · $242/mo
- Projected year-2 tax
- $2,903 · $242/mo
- Expected delta
- $0/yr ($0/mo · 0.0%)
ⓘ Screening estimate from a state-policy table — verify with the county assessor before closing.
Climate risk First Street
- Flood 1/10 Low FEMA zone X (unshaded) · 0% chance over 30 yrs
- Wildfire 6/10 Major
- Heat 8/10 Severe 7 d/yr ≥108°F today · 23 d/yr by 30 yrs out
- Wind 10/10 Extreme 99% chance of damaging wind over 30 yrs
- Air quality 1/10 Low 0 unhealthy d/yr today · 0 by 30 yrs out
Nearby sold comps map
Loading sold comps map…
Walkable amenities ~0.75 mi
Loading nearby amenities…
Taxation est. · year 1
- Rental income
- $26,748
- − Mortgage interest
- −$15,124
- − Property taxes
- −$2,903
- − Insurance
- −$1,350
- − Repairs & maintenance
- −$2,140
- − Management
- −$2,140
- − HOA
- −$516
- − Depreciation
- −$7,855
- Taxable loss
- −$5,280
- Est. tax savings @ 24.0%
- +$1,267
- After-tax cash flow
- $638/yr
For passive investors: Depreciation is non-cash, so a rental often shows a tax loss while cash-flowing — sheltering income. Rental losses are passive: they offset passive income freely, and up to $25,000/yr can offset ordinary (W-2) income if you actively participate and your MAGI is under $100k (phasing out to $0 by $150k); unused losses carry forward. On sale, claimed depreciation is recaptured at up to 25%, and gains may owe capital-gains tax (a 1031 exchange can defer both). Figures are a year-1 estimate at your 24.0% rate — not tax advice; consult a CPA.
Condition & rehab AI · 6 photos
This move-in-ready home in a desirable location offers excellent curb appeal and is in excellent condition. Minor updates can further enhance its value.
Value-add opportunities
- Both Painting exterior and interior walls — Fresh paint enhances curb appeal and interior aesthetics
- Both Landscaping and curb appeal improvements — Enhances curb appeal and can attract more buyers
- Both Add a small front porch or patio — Can increase living space and add value
- Both Install smart home features — Can increase home's marketability and attract tech-savvy buyers
Renovation cost estimate screening
Value-add ROI direction
- Both Painting exterior and interior walls — Fresh paint enhances curb appeal and interior aesthetics ↑
- Both Landscaping and curb appeal improvements — Enhances curb appeal and can attract more buyers ↑
- Both Add a small front porch or patio — Can increase living space and add value ↑
- Both Install smart home features — Can increase home's marketability and attract tech-savvy buyers ↑
ⓘ Cost ranges are severity-bucket heuristics (US national rule-of-thumb). Get contractor quotes + a written scope before underwriting a rehab budget.
Schools (NCES district)
- District
- Polk
- NCES district ID
- 1201590
- Math proficiency
- 39% ▼ -11.00%
- Reading proficiency
- 43% ▼ -4.00%
- Median HH income
- $43,979
- Composite
- 34.74/100
- National rank
- #5132
- State rank
- #62 of 73 in FL
Livability — Haines City
- Score
- 74/100
- State rank
- #285
- US rank
- #4575
Category grades
Schools grade is shown separately in the Schools card above.
Census & demographics
- County
- Polk County · 740,051 people
- City population
- 51,255
- Metro
- Lakeland-Winter Haven, FL
- Population (ZIP)
- 47,389
- Household income
- $81,276
- Rent vs Own
- Severe rent burden
- 424.0
Population outlook (Polk County) Hauer SSP2
- Today (2025)
- 752,975 people
- By 2030
- 804,621 · +6.9%
- By 2040
- 906,117 · +20.3%
- By 2050
- 1,000,476 · +32.9%
- By 2075
- 1,197,520 · +59.0%
- By 2100
- 1,271,518 · +68.9%
Race, ethnicity, and origin ACS 2023
- Neighborhood character
- Diverse neighborhood (Simpson 0.68)
- Race & ethnicity
- Hispanic / Latino 42% White 36% Two or more races 16% Black 15% Asian 2%
- Hispanic origin (detail)
- Mexican 7% Puerto Rican 22% Cuban 2% Dominican 1%
- Common ancestry
- Hispanic 5% Romanian 3% Lithuanian 1%
- Foreign-born
- 18% · Canada, Jamaica
- Languages at home
- 55% English-only · Spanish 35% French/Haitian/Cajun 6% Other Indo-European 2%
Political lean MEDSL · Polk
- 2024 margin
- Strong R (+20.7) · D 39.2% · R 59.9%
- 2008→2024 swing
- -14.6pp toward R · 2008: -6.1pp · 2024: -20.7pp
- All cycles
- 2024: R+20.7 2020: R+14.4 2016: R+14.1 2012: R+6.8 2008: R+6.1
Not yet ingested
- Civics
- —
Market trends
- HPI YoY
- ▼ -131.62%
- Current HPI
- 256.8165
- Rent YoY
- ▼ -2.73%
- Metro
- Lakeland-Winter Haven, FL
- State GDP YoY
- ▲ 3.28%
- F500 in state
- 36
Industry mix (Fortune 500 HQ in FL)
| Industry | F500 HQs | Revenue |
|---|---|---|
| Industrial Technology | 2 | $29B |
|
||
| Insurance | 2 | $17B |
|
||
| Retail | 1 | $60B |
|
||
| Technology Distribution | 1 | $58B |
|
||
| Homebuilding | 1 | $35B |
|
||
| Technology Manufacturing | 1 | $35B |
|
||
Price history
+8.9% since first listed10 events — show timeline
- 2026-05-29 Listed $270,000 Stellar MLS as Distributed by MLS Grid
- 2021-05-25 Sold (MLS) $257,990 Stellar MLS as Distributed by MLS Grid
- 2021-04-06 Pending — Stellar MLS as Distributed by MLS Grid
- 2021-04-02 Price Changed $260,990 Stellar MLS as Distributed by MLS Grid
- 2021-04-02 Relisted — Stellar MLS as Distributed by MLS Grid
- 2021-03-23 Pending — Stellar MLS as Distributed by MLS Grid
- 2021-03-02 Price Changed $255,990 Stellar MLS as Distributed by MLS Grid
- 2021-02-16 Price Changed $252,990 Stellar MLS as Distributed by MLS Grid
- 2021-02-04 Price Changed $249,990 Stellar MLS as Distributed by MLS Grid
- 2021-02-02 Listed $247,990 Stellar MLS as Distributed by MLS Grid
Property tax history
+132.4%/yrLatest (2025): $2,903 · +3.8% YoY. Source: county tax records.
Cash-flow waterfall
monthlySold comps — $/sqft
last 12 mo · ≤1 miLoading sold comps…