135 Hillview Unit Dr68 · Fairfield Bay, AR
Flood risk No data
- FEMA flood zone
- —
- Chance of flooding over 30 yrs
- —
- Est. flood insurance / yr
- —
Fire risk No data
- Est. fire insurance / yr
- —
Heat risk No data
- Hot days now (above threshold)
- —
- Hot days in 30 yrs
- —
Wind risk No data
- Chance of severe wind over 30 yrs
- —
Air-quality risk No data
- Unhealthy air days now
- —
- Unhealthy air days in 30 yrs
- —
Risk factors via First Street. Map © Google.
Why this score? — see what drove the B grade
The composite is a weighted blend of 9 inputs, each scored 0–100. Each bar is that input's sub-score; the figure is the points it added to the 100-point composite (weight × sub-score).
- Cash flow +30.0/30.0
- 1% rule +10.0/10.0
- DSCR +10.0/10.0
- ARV discount +6.1/15.0
- Appreciation +4.8/10.0
- Schools +3.8/10.0
- Livability +3.1/5.0
- Rent growth +2.5/5.0
- Condition / age +2.2/5.0
$98,000
🖨 Deal sheet (PDF) 📄 Offer letter ✓ Due diligence
Listing remarks MLS
Beautifully updated, FURNISHED town home in the desirable community of Lakewood Hills in picturesque Fairfield Bay, AR. As you enter the unit, you are greeted by gorgeous wood flooring, a fully updated kitchen with quartz counters, new cabinets & fixtures, including an undermounted stainless steel sink, upgraded lighting and an open floor plan. The stylishly decorated unit offers ample storage, a convenient first floor half bath and a spacious deck open to a serene, wooded overlook. As you venture upstairs, you will find a spacious, glamorous bathroom with upgraded cabinets, vanity counter & finishes. There are two nicely appointed, spacious bedrooms with ample closet space and an additional bonus room tucked away behind barnwood doors, which could double for a bedroom or easily converted to an office. The community features a dedicated parking space, with additional parking on the premises as well as a private pool. Fairfield Bay is a hidden, Ozark gem nestled on the banks of the pristine Greers Ferry Lake. Featuring 2 golf courses, three community pools, ATV trails, a full-service marina, pickle ball & tennis courts, bowling alley, a variety of dining options, & more.
Key facts
- Wood flooring
- Spacious deck
- Glamorous bathroom
Tags
Neighborhood map
What this means for you Summary
Snapshot
- This is a 2-bed/1.5-bath townhouse listed at $98k. Condition is rated fair.
Deal economics
- At list price, monthly cash flow is $562 ($7k/yr) — positive.
- The deal already cash-flows at list — no discount required.
- Meets the 1% rule at list price ($2k rent vs $98k).
- Recommended offer: $89k (9.0% below list) — sets the bar for market timing.
- Cap rate 13.2% vs local median 5.7% in Fairfield Bay — top-decile yield for the area; either an underpriced asset or a hidden risk that comps aren't pricing in. Stress-test before assuming the spread holds.
Location & tenants
- Location reads 62/100 on livability (#220 in AR) — a middle-class / working-renter tenant base. Strengths: cost of living A+, housing A+, crime B; Watch: employment D+, amenities F, commute F.
- Shirley School District (rural): math 44% / reading 42% proficiency, ranked #132 of 245 in AR (top 54%) — families likely to look elsewhere, expect single-tenant / working-renter base with shorter leases; 73% free/reduced lunch — lower-income household profile, screen leases tightly.
- Zoned schools: Shirley Elementary School (math 12% / reading 12%, grade F, #419 of 454 statewide, top 93%, 180 students, 100% FRL); Shirley High School (math 22% / reading 32%, grade F, #164 of 292 statewide, top 61%, 139 students, 100% FRL) — zoned schools average 100% FRL vs 73% district-wide (27 pts higher); higher-poverty schools than district average — tighter screening recommended.
- Zoned-school proficiency averages 20% at this address vs 43% district-wide (-24 pts) — the specific schools serving this property underperform the Shirley School District average; the district grade overstates school quality for this exact location.
- Market conditions: 263 active listings in the ZIP; 1 comparable units currently listed for rent nearby; 16 units permitted in Van Buren County in 2024 (0 in 5+ unit buildings).
Forward outlook
- In year one you build about $211 of equity ($678 loan paydown + $-467 appreciation (-0.5% local appreciation)).
- Van Buren County population projected at -27% by 2050 — secular population decline; favor cash flow + early exit over multi-decade hold.
- At projected returns (-0.5% appreciation + 3.0% rent growth), your $27k cash investment doubles in ~4 years — after that, you're playing with house money.
Negotiation context
- It's been on market 110 days — a 9% lower offer ($89k) is reasonable based on typical stale-listing flexibility.
- 2 sale attempts since 10y ago with the ask held roughly flat each time — persistent listings suggest the price (not the market) is what's stuck; bring a comps-based counter.
- Current owner paid $25k; list at $98k implies a 292% gain — meaningful room to come down on a strong offer.
Questions for the listing agent
- It's been on market 110 days. Have you received any prior offers? Is the seller open to a 9% concession, seller financing, or rate buy-down credit?
- Have any recent inspections been done? Can we get a copy of the seller's disclosures and any deferred-maintenance estimates?
- Built in 1975 — when were the roof, HVAC, electrical panel, plumbing, and water heater last replaced?
- What does the HOA fee cover, when was the last increase, and are there any pending special assessments or reserve-fund shortfalls?
- Why hasn't it sold? Are there any deal-killer items the seller is aware of (foundation, flood, title, zoning, code violations)?
- Is there a deadline driving the sale (1031 exchange, divorce, estate, relocation)? That informs how much negotiation room exists.
- Schools are F-rated, which usually means shorter tenancies and higher turnover. Who's the typical renter profile here, and what's been the actual vacancy rate?
- What's the average days-on-market for RENTAL listings here right now (not sales)? A rising rental-DOM trend means longer vacancies and softer asking-rent achievability than the comps imply.
- What's the recent tenant-quality profile in this submarket — average credit score on applications, eviction rate, late-payment / NSF rate, and stable-employment percentage? A property-management company in the area should have these aggregated.
- How much new for-sale + rental construction is in the pipeline within 1–3 miles? Heavy new supply typically softens prices + rents 12–24 months out; constrained supply supports both.
Investment metrics
- 1% rule
- 2.04% ✓
- Cap rate
- 13.17%
- Cash-on-cash
- 24.57%
- DSCR
- 2.09
- GRM
- 4.1
CMA / ARV
- ARV (median comp)
- $95,027
- List price
- $98,000
- Delta
- 3.13%
- Verdict
- FAIR
- Comps
- 20 within 1.0 mi
Show comp detail 12 sales within ~0.75 mi
| Address | Dist | Beds/Ba | Sqft | Sold | Price | $/sf | Match |
|---|---|---|---|---|---|---|---|
| 135 Hillview Dr #101 | 0.00mi | 2/1.5 | 1,117 (0%) | 1mo | $75,000 | $67 | 99 |
| 135 Hillview Dr #116 | 0.00mi | 2/1.5 | 1,117 (0%) | 2mo | $98,000 | $88 | 98 |
| 135 Hillview Dr #6 | 0.00mi | 2/1.5 | 1,133 (+1%) | 8mo | $98,000 | $86 | 90 |
| 135 Hillview #52 | 0.00mi | 2/1.5 | 1,117 (0%) | 14mo | $89,000 | $80 | 88 |
| 135 Hillview Dr #82 | 0.00mi | 2/1.5 | 1,179 (+6%) | 10mo | $79,900 | $68 | 82 |
| 120 Shorthaven Ln | 0.27mi | 2/1.5 | 1,102 (-1%) | 13mo | $125,000 | $113 | 74 |
| 134 Richwood Dr #3 | 0.43mi | 1/2.0 (-1) | 1,095 (-2%) | 1mo | $85,000 | $78 | 69 |
| 118 Richwood Dr #49 | 0.32mi | 2/2.0 | 1,218 (+9%) | 2mo | $80,000 | $66 | 66 |
| 125 Chelsea Dr #33 | 0.72mi | 2/2.0 | 1,156 (+4%) | 10mo | $185,000 | $160 | 50 |
| 104 Chelsea Dr #42 | 0.58mi | 2/2.5 | 1,066 (-5%) | 14mo | $99,000 | $93 | 49 |
| 134 Richwood Dr #12 | 0.43mi | 2/2.0 | 1,272 (+14%) | 13mo | $132,500 | $104 | 44 |
| 134 Richwood Dr #11 | 0.43mi | 1/2.0 (-1) | 970 (-13%) | 18mo | $89,500 | $92 | 36 |
Match score weights: distance 35% · size 25% · config 20% · recency 20%. Top-matched comps best support the ARV.
Projected returns pro-forma
-0.48% appreciation · 3.0% rent growth · sell at horizon
- IRR
- 23.8%
- Equity multiple
- 2.13×
- Total profit
- $30,977
- Equity at exit
- $26,144
- IRR
- 28.5%
- Equity multiple
- 4.08×
- Total profit
- $84,472
- Equity at exit
- $29,636
Cash invested: $27,440 (down + closing). Projections, not guarantees.
Landlord ↔ Tenant lean methodology
- Overall (STATE)
- 92 Strongly Landlord-Friendly
- State Arkansas
- 92 Strongly Landlord-Friendly · R+14
- County
- — inherits STATE
- City
- — inherits STATE
ZIP-level market 72088
- Home prices YoY
- -0.2%
- Active inventory
- 263
- Price-to-rent
- 4.1×
Monthly cashflow live
- Estimated rent
- $2,000 medium interval (Pro) →
- Mortgage (P&I)
- −$514
- Tax est. 1.5%
- −$122 /mo · $1,470/yr
- Insurance
- −$41
- HOA
- −$341
- Vacancy / Maint / Mgmt
- −$420
- Net cashflow
- $562
Break-even live
Sensitivity live
| Price | -10% $629 | -5% $596 | +0% $562 | +5% $528 | +10% $494 |
|---|---|---|---|---|---|
| Rent | -10% $404 | -5% $483 | +0% $562 | +5% $641 | +10% $720 |
| Rate | -1.0pp $611 | -0.5pp $587 | base $562 | +0.5pp $536 | +1.0pp $511 |
UW: 25.0% down · 7.5% · 30yr · 1.5% tax · 5.0% vac · 8.0% maint · 8.0% mgmt
Financing live
Cash to close
- Down payment
- $24,500
- Closing costs
- $2,940
- Reserves months
- —
- Total cash needed
- —
Loan-product check · same deal, 3 products live
Conventional
25% down · 7.5% · 30yr
- Down + closing
- —
- Monthly P&I
- —
- Monthly cashflow
- —
- DSCR
- —
- Eligible?
- —
Personal DTI + credit; lowest rate.
DSCR
20% down · 8.5% · 30yr
- Down + closing
- —
- Monthly P&I
- —
- Monthly cashflow
- —
- DSCR
- —
- Eligible?
- —
No personal income docs; deal must DSCR.
Hard money
10% down · 12.0% · 12mo
- Down + closing
- —
- Monthly P&I
- —
- Monthly cashflow
- —
- DSCR
- —
- Eligible?
- —
Short-term bridge; refi at stabilization.
Rent comps 1 comps
| Address | Beds | Baths | Sqft | Rent | $/sqft | DOM | Units | Dist |
|---|---|---|---|---|---|---|---|---|
| 106 Set Ct Fairfield Bay, AR | 3.0 | 2.0 | 1300 | $2,000 | $1.54 | 46d | 1 | 0.72mi |
HOA detail
- Monthly dues
- $341 · $4,092/yr
- Likely covers
- pool
Listing history 22 events
-
2026-06-22days on market $98,000 Active 110 DOM
-
2026-06-21days on market $98,000 Active 109 DOM
-
2026-06-19days on market $98,000 Active 107 DOM
-
2026-06-18days on market $98,000 Active 106 DOM
-
2026-06-17days on market $98,000 Active 105 DOM
-
2026-06-16days on market $98,000 Active 104 DOM
-
2026-06-15days on market $98,000 Active 103 DOM
-
2026-06-14days on market $98,000 Active 101 DOM
-
2026-06-12days on market $98,000 Active 100 DOM
-
2026-06-09days on market $98,000 Active 97 DOM
-
2026-06-08days on market $98,000 Active 96 DOM
-
2026-06-07days on market $98,000 Active 95 DOM
-
2026-06-07days on market $98,000 Active 94 DOM
-
2026-06-04days on market $98,000 Active 91 DOM
-
2026-06-02days on market $98,000 Active 90 DOM
-
2026-06-01days on market $98,000 Active 89 DOM
-
2026-05-31days on market $98,000 Active 88 DOM
-
2026-05-31days on market $98,000 Active 87 DOM
-
2026-03-03$103,000 New Listing 1211-char remark
Show marketing remark (1211 chars)
Beautifully updated, FURNISHED town home in the desirable community of Lakewood Hills in picturesque Fairfield Bay, AR. As you enter the unit, you are greeted by gorgeous wood flooring, a fully updated kitchen with quartz counters, new cabinets & fixtures, including an undermounted stainless steel sink, upgraded lighting and an open floor plan. The stylishly decorated unit offers ample storage, a convenient first floor half bath and a spacious deck open to a serene, wooded overlook. As you venture upstairs, you will find a spacious, glamorous bathroom with upgraded cabinets, vanity counter & finishes. There are two nicely appointed, spacious bedrooms with ample closet space and an additional bonus room tucked away behind barnwood doors, which could double for a bedroom or easily converted to an office. The community features a dedicated parking space, with additional parking on the premises as well as a private pool. Fairfield Bay is a hidden, Ozark gem nestled on the banks of the pristine Greers Ferry Lake. Featuring 2 golf courses, three community pools, ATV trails, a full-service marina, pickle ball & tennis courts, bowling alley, a variety of dining options, & more.
-
2017-01-12status Under Contract 372-char remark
Show marketing remark (372 chars)
If you are looking for a condo that is furnished and ready to use this is a good one. Comes furnished. The pool is across the parking lot and in front of this unit. Only just a few steps to swimming. The deck looks out onto the woods behind. A great location in this complex. With just a few improvements this could be a great lake get-a-way. The A/C is about 5 years old.
-
2017-01-12soldstatus $25,000 Sold 372-char remark
Show marketing remark (372 chars)
If you are looking for a condo that is furnished and ready to use this is a good one. Comes furnished. The pool is across the parking lot and in front of this unit. Only just a few steps to swimming. The deck looks out onto the woods behind. A great location in this complex. With just a few improvements this could be a great lake get-a-way. The A/C is about 5 years old.
-
2016-07-29$28,000 New Listing 372-char remark
Show marketing remark (372 chars)
If you are looking for a condo that is furnished and ready to use this is a good one. Comes furnished. The pool is across the parking lot and in front of this unit. Only just a few steps to swimming. The deck looks out onto the woods behind. A great location in this complex. With just a few improvements this could be a great lake get-a-way. The A/C is about 5 years old.
ⓘ Source: listings_history table (triggers on properties + properties_extension) + one-shot
backfill from property_details.listing_events for pre-trigger history.
Nearby sold comps map
Loading sold comps map…
Walkable amenities ~0.75 mi
Loading nearby amenities…
Taxation est. · year 1
- Rental income
- $24,000
- − Mortgage interest
- −$5,490
- − Property taxes
- −$1,470
- − Insurance
- −$490
- − Repairs & maintenance
- −$1,920
- − Management
- −$1,920
- − HOA
- −$4,092
- − Depreciation
- −$2,851
- Taxable income
- $5,768
- Est. tax owed @ 24.0%
- −$1,384
- After-tax cash flow
- $5,357/yr
For passive investors: Depreciation is non-cash, so a rental often shows a tax loss while cash-flowing — sheltering income. Rental losses are passive: they offset passive income freely, and up to $25,000/yr can offset ordinary (W-2) income if you actively participate and your MAGI is under $100k (phasing out to $0 by $150k); unused losses carry forward. On sale, claimed depreciation is recaptured at up to 25%, and gains may owe capital-gains tax (a 1031 exchange can defer both). Figures are a year-1 estimate at your 24.0% rate — not tax advice; consult a CPA.
Condition & rehab AI · 12 photos
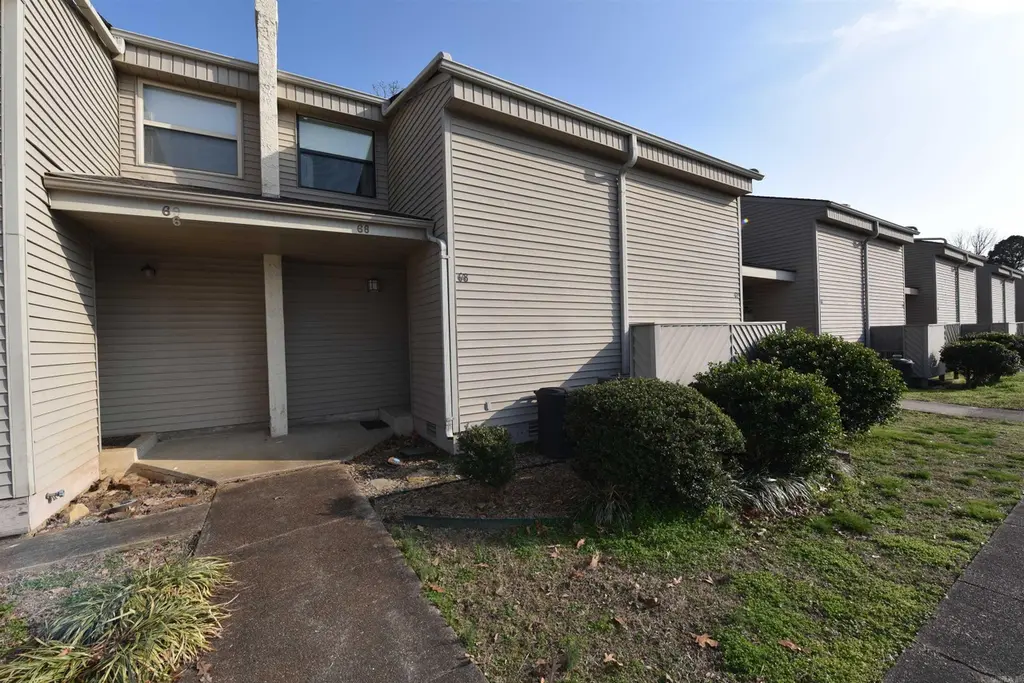
The property requires significant exterior repairs and landscaping improvements to increase its value. Interior updates are minimal and the home is currently move-in ready.
Repairs flagged
- Major Exterior siding — Significant damage and debris suggest major repairs are needed.
- Major Landscaping — Debris and construction materials indicate landscaping needs attention.
- Major Exterior entrance — Debris and construction materials suggest major repairs are needed at the entrance.
Value-add opportunities
- Resale Exterior siding repair — Repairing the siding will improve the home's curb appeal and overall appearance.
- Rental Landscaping improvement — A well-maintained landscape can attract more renters and increase rental value.
- Both Exterior entrance repair — Repairing the entrance will improve the home's appearance and increase both resale and rental value.
Renovation cost estimate screening
| Repair item | Severity | Est. cost |
|---|---|---|
| Exterior siding · Significant damage and debris suggest major repairs are needed. | Major | $15,000–50,000 |
| Landscaping · Debris and construction materials indicate landscaping needs attention. | Major | $15,000–50,000 |
| Exterior entrance · Debris and construction materials suggest major repairs are needed at the entrance. | Major | $15,000–50,000 |
| Total estimated repair cost · 3 items | $45,000–150,000 |
Value-add ROI direction
- Resale Exterior siding repair — Repairing the siding will improve the home's curb appeal and overall appearance. ↑
- Rental Landscaping improvement — A well-maintained landscape can attract more renters and increase rental value. ↑
- Both Exterior entrance repair — Repairing the entrance will improve the home's appearance and increase both resale and rental value. ↑
ⓘ Cost ranges are severity-bucket heuristics (US national rule-of-thumb). Get contractor quotes + a written scope before underwriting a rehab budget.
Schools (NCES district)
- District
- Shirley School District
- NCES district ID
- 0512420
- Math proficiency
- 44% ▲ 4.00%
- Reading proficiency
- 42% ▲ 1.00%
- Median HH income
- $36,296
- Composite
- 37.98/100
- National rank
- #8669
- State rank
- #132 of 245 in AR
Livability — Fairfield Bay
- Score
- 62/100
- State rank
- #220
- US rank
- #16778
Category grades
Schools grade is shown separately in the Schools card above.
Census & demographics
- Census place
- Fairfield Bay, AR
- City population
- 2,264
- Population (ZIP)
- 2,264
Population outlook (Van Buren County) Hauer SSP2
- Today (2025)
- 15,459 people
- By 2030
- 14,645 · -5.3%
- By 2040
- 12,918 · -16.4%
- By 2050
- 11,263 · -27.1%
- By 2075
- 7,870 · -49.1%
- By 2100
- 4,918 · -68.2%
Race, ethnicity, and origin ACS 2023
- Neighborhood character
- Predominantly White (88%)
- Race & ethnicity
- White 88% Hispanic / Latino 6% Two or more races 3% Asian 2%
- Hispanic origin (detail)
- Mexican 6%
- Common ancestry
- Lithuanian 9% Iranian 2% Romanian 2%
- Foreign-born
- 3% · Canada, Dominican Republic
- Languages at home
- 94% English-only · Other Asian/Pacific 4% Tagalog/Filipino 1% Spanish 1%
Political lean MEDSL · Van Buren
- 2024 margin
- Solid R (+60.2) · D 18.9% · R 79.0% · Other 2.1%
- 2008→2024 swing
- -28.5pp toward R · 2008: -31.7pp · 2024: -60.2pp
- All cycles
- 2024: R+60.2 2020: R+56.9 2016: R+53.9 2012: R+39.5 2008: R+31.7
Not yet ingested
- Civics
- —
Market trends
- HPI YoY
- ▼ -0.48%
- Current HPI
- 238.2694
- Rent YoY
- —
- Metro
- —
- State GDP YoY
- ▲ 3.80%
- F500 in state
- 10
Industry mix (Fortune 500 HQ in AR)
| Industry | F500 HQs | Revenue |
|---|---|---|
| Retail | 1 | $681B |
|
||
| Food / Agriculture | 1 | $53B |
|
||
| Retail / Energy | 1 | $22B |
|
||
| Transportation / Logistics | 1 | $12B |
|
||
| Energy | 1 | $4B |
|
||
Price history
+267.9% since first listed4 events — show timeline
- 2026-03-03 Listed $103,000 CARMLS
- 2017-01-12 Pending — CARMLS
- 2017-01-12 Sold (MLS) $25,000 CARMLS
- 2016-07-29 Listed $28,000 CARMLS
Cash-flow waterfall
monthlySold comps — $/sqft
last 12 mo · ≤1 miLoading sold comps…