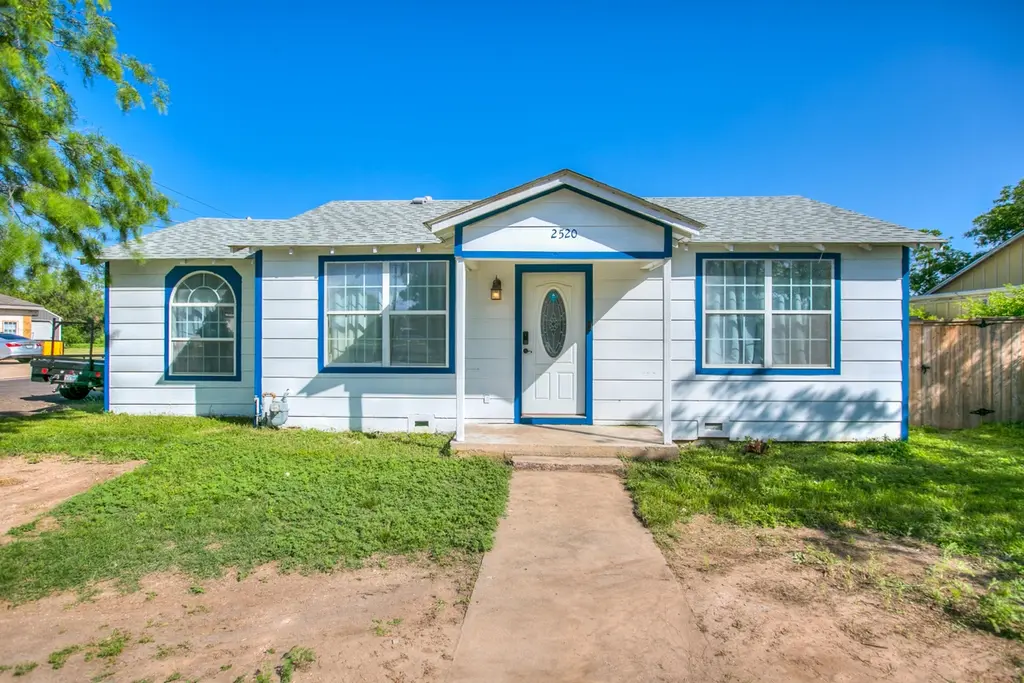
2520 Forest Park Ave · San Angelo, TX
Flood risk 1/10 · Minimal
- FEMA flood zone
- X (unshaded)
- Chance of flooding over 30 yrs
- 0.0%
- Est. flood insurance / yr
- $507 – $1,088
Fire risk 7/10 · Major
- Est. fire insurance / yr
- $1,222 – $2,270
Heat risk 7/10 · Major
- Hot days now (above 104°F)
- 7 days/yr
- Hot days in 30 yrs
- 23 days/yr
Wind risk 4/10 · Minor
- Chance of severe wind over 30 yrs
- 14.0%
Air-quality risk 1/10 · Minimal
- Unhealthy air days now
- 0 days/yr
- Unhealthy air days in 30 yrs
- 0 days/yr
Risk factors via First Street. Map © Google.
Why this score? — see what drove the C grade
The composite is a weighted blend of 9 inputs, each scored 0–100. Each bar is that input's sub-score; the figure is the points it added to the 100-point composite (weight × sub-score).
- Cash flow +15.0/30.0
- Appreciation +10.0/10.0
- ARV discount +9.1/15.0
- 1% rule +4.7/10.0
- DSCR +4.6/10.0
- Rent growth +3.9/5.0
- Livability +3.7/5.0
- Schools +2.6/10.0
- Condition / age +2.5/5.0
$135,000
🖨 Deal sheet (PDF) 📄 Offer letter ✓ Due diligence
Listing remarks
Check out this 2 bedroom, 1 bath home! Located on a corner lot, with a large backyard, this home features a 2-year-old roof, a workshop with electricity and a window unit, 2 extra storage sheds, and new exterior paint. Inside, you'll find a functional layout with opportunity to update and customize to your style. This home offers great value and endless possibilities!
Key facts
- 2 year old roof
- New exterior paint
- Large backyard
Tags
Property features AI
Exterior
- Parking: No specific parking details provided
- Security: Smoke detector(s)
- Utilities: Public water; Public sewer; Electricity available; Natural gas connected; Water connected; Sewer available
- Home design: Single family residence; One story; Corner lot; City street frontage; Paved, publicly maintained road
- Construction: Frame and other construction materials; Composition roof; Pillar/post/pier and slab foundation; Built on a 0.16-acre lot
- Exterior features: Porch; Shed(s); Workshop; Privacy fencing / fenced yard
Interior
- Kitchen: Built-in electric oven; Electric range; Microwave; Dishwasher; Vented exhaust fan
- Bedrooms: 5 total rooms (includes bedrooms and living areas)
- Flooring: Carpet; Laminate; Tile
- Bathrooms: 1 full bathroom
- Heating & cooling: Central heating (natural gas); Central air; Electric cooling; Ceiling fan(s)
- Interior features: Laminate counters; Ceiling fan(s); Storage
- Laundry & utility: Washer hookup inside; Electric dryer hookup; Electric water heater
Neighborhood map
What this means for you Summary
Snapshot
- This is a 2-bed/1.0-bath single-family listed at $135k.
Deal economics
- At list price, monthly cash flow is $43 ($513/yr) — positive.
- The deal already cash-flows at list — no discount required.
- To meet the 1% rule (rent ≥ 1% of price), the offer needs to be $132k (2.5% below list).
- Recommended offer: $131k (3.0% below list) — sets the bar for market timing.
- Cap rate 6.7% vs local median 3.8% in San Angelo — top-decile yield for the area; either an underpriced asset or a hidden risk that comps aren't pricing in. Stress-test before assuming the spread holds.
Location & tenants
- Location reads 73/100 on livability (#199 in TX) — a middle-class / working-renter tenant base. Strengths: cost of living A+, housing A+, health & safety A+; Watch: employment C-, amenities F, commute F.
- San Angelo ISD (urban): math 27% / reading 33% proficiency, ranked #627 of 826 in TX (top 76%) — families likely to look elsewhere, expect single-tenant / working-renter base with shorter leases.
- Zoned schools: Fannin El (math 27% / reading 12%, grade F, #3,583 of 4,322 statewide, top 86%, 306 students, 92% FRL); Lincoln Middle (math 19% / reading 23%, grade F, #1,387 of 1,662 statewide, top 85%, 844 students, 78% FRL); Lake View H S (math 6% / reading 22%, grade F, #1,527 of 1,632 statewide, top 94%, 1,085 students, 64% FRL) — zoned schools average 78% FRL vs 53% district-wide (26 pts higher); higher-poverty schools than district average — tighter screening recommended.
- Market conditions: Rents rising fast (+5.8%/yr); 331 active listings in the ZIP; 19 comparable units currently listed for rent nearby; rentals lingering (median 45d on market — plan ~5-8 weeks vacancy on turnover, expect pricing pressure); 53% of comp listings sitting > 30 days — soft ceiling on asking rent; 233 units permitted in Tom Green County in 2024 (0 in 5+ unit buildings).
Forward outlook
- In year one you build about $14k of equity ($933 loan paydown + $14k appreciation (10.0% local appreciation)).
- Tom Green County population projected at +35% by 2050 — long-run rental-demand tailwind backs the buy-and-hold thesis.
- At projected returns (10.0% appreciation + 5.8% rent growth), your $38k cash investment doubles in ~3 years — after that, you're playing with house money.
- By year 3, paydown + projected appreciation supports a ~$37k cash-out refi (75% LTV) — recoverable capital for the next deal without selling this one.
Negotiation context
- It's been on market 51 days — a 3% lower offer ($131k) is reasonable based on typical stale-listing flexibility.
- 4 sale attempts since 12y ago; this cycle's ask has dropped $10k (7%) from the opening price — seller is motivated, your offer sets the floor, not the list.
Risks & watch-outs
- Watch-outs: built in 1958 — expect roof / HVAC / electrical / plumbing capex.
- Climate carrying-cost: major wildfire risk; extreme-heat days projected 7→23/yr by 2055 (HVAC capex compounding) — expect insurance premiums to compound above CPI over the hold.
Questions for the listing agent
- It's been on market 51 days. Have you received any prior offers? Is the seller open to a 3% concession, seller financing, or rate buy-down credit?
- Built in 1958 — when were the roof, HVAC, electrical panel, plumbing, and water heater last replaced?
- Is there a deadline driving the sale (1031 exchange, divorce, estate, relocation)? That informs how much negotiation room exists.
- Schools are F-rated, which usually means shorter tenancies and higher turnover. Who's the typical renter profile here, and what's been the actual vacancy rate?
- What's the average days-on-market for RENTAL listings here right now (not sales)? A rising rental-DOM trend means longer vacancies and softer asking-rent achievability than the comps imply.
- What's the recent tenant-quality profile in this submarket — average credit score on applications, eviction rate, late-payment / NSF rate, and stable-employment percentage? A property-management company in the area should have these aggregated.
- How much new for-sale + rental construction is in the pipeline within 1–3 miles? Heavy new supply typically softens prices + rents 12–24 months out; constrained supply supports both.
Investment metrics
- 1% rule
- 0.97% ✗
- Cap rate
- 6.67%
- Cash-on-cash
- 1.36%
- DSCR
- 1.06
- GRM
- 8.6
CMA / ARV
- ARV (median comp)
- $139,923
- List price
- $135,000
- Delta
- -3.52%
- Verdict
- FAIR
- Comps
- 20 within 1.0 mi
Show comp detail 12 sales within ~0.75 mi
| Address | Dist | Beds/Ba | Sqft | Sold | Price | $/sf | Match |
|---|---|---|---|---|---|---|---|
| 2410 Lindell Ave | 0.22mi | 2/1.0 | 960 (+2%) | 2mo | $157,000 | $164 | 85 |
| 2223 Coleman St | 0.36mi | 2/1.0 | 894 (-5%) | 6mo | $80,000 | $89 | 70 |
| 1825 N St St | 0.64mi | 2/1.0 | 940 (0%) | 5mo | $100,000 | $106 | 66 |
| 2006 Howard Ave | 0.63mi | 2/1.0 | 940 (0%) | 7mo | $127,000 | $135 | 65 |
| 2414 Chestnut St | 0.60mi | 2/1.0 | 910 (-3%) | 4mo | $142,000 | $156 | 63 |
| 1906 Juanita Ave | 0.59mi | 2/2.0 | 964 (+3%) | 3mo | $165,000 | $171 | 62 |
| 2510 Glenwood Dr | 0.47mi | 3/1.5 (+1) | 1,000 (+6%) | 2mo | $150,000 | $150 | 59 |
| 2104 Juanita Ave | 0.43mi | 3/1.0 (+1) | 1,040 (+11%) | 6mo | $175,000 | $168 | 52 |
| 2019 Freeland Ave | 0.69mi | 2/1.0 | 1,008 (+7%) | 4mo | $127,500 | $126 | 52 |
| 2526 Chestnut St | 0.59mi | 2/1.0 | 810 (-14%) | 2mo | $115,000 | $142 | 48 |
| 1908 Woodlawn Dr | 0.57mi | 3/2.0 (+1) | 1,016 (+8%) | 6mo | $145,900 | $144 | 46 |
| 2840 Field St | 0.50mi | 3/1.5 (+1) | 1,053 (+12%) | 5mo | $105,000 | $100 | 46 |
Match score weights: distance 35% · size 25% · config 20% · recency 20%. Top-matched comps best support the ARV.
Projected returns pro-forma
10.0% appreciation · 5.78% rent growth · sell at horizon
- IRR
- 26.3%
- Equity multiple
- 3.12×
- Total profit
- $80,087
- Equity at exit
- $121,619
- IRR
- 23.9%
- Equity multiple
- 7.41×
- Total profit
- $242,406
- Equity at exit
- $262,275
Cash invested: $37,800 (down + closing). Projections, not guarantees.
Landlord ↔ Tenant lean methodology
- Overall (STATE)
- 87 Strongly Landlord-Friendly
- State Texas
- 87 Strongly Landlord-Friendly · R+5
- County
- — inherits STATE
- City
- — inherits STATE
ZIP-level market 76901
- Home prices YoY
- 6.4%
- Rents YoY
- 5.8%
- Active inventory
- 331
- Price-to-rent
- 8.6×
Monthly cashflow live
- Estimated rent
- $1,316 high interval (Pro) →
- Mortgage (P&I)
- −$708
- Tax from tax record
- −$232 /mo · $2,789/yr
- Insurance
- −$56
- HOA
- −$0
- Vacancy / Maint / Mgmt
- −$276
- Net cashflow
- $43
Break-even live
Sensitivity live
| Price | -10% $119 | -5% $81 | +0% $43 | +5% $5 | +10% $-34 |
|---|---|---|---|---|---|
| Rent | -10% $-61 | -5% $-9 | +0% $43 | +5% $95 | +10% $147 |
| Rate | -1.0pp $111 | -0.5pp $77 | base $43 | +0.5pp $8 | +1.0pp $-28 |
UW: 25.0% down · 7.5% · 30yr · 1.5% tax · 5.0% vac · 8.0% maint · 8.0% mgmt
Financing live
Cash to close
- Down payment
- $33,750
- Closing costs
- $4,050
- Reserves months
- —
- Total cash needed
- —
Loan-product check · same deal, 3 products live
Conventional
25% down · 7.5% · 30yr
- Down + closing
- —
- Monthly P&I
- —
- Monthly cashflow
- —
- DSCR
- —
- Eligible?
- —
Personal DTI + credit; lowest rate.
DSCR
20% down · 8.5% · 30yr
- Down + closing
- —
- Monthly P&I
- —
- Monthly cashflow
- —
- DSCR
- —
- Eligible?
- —
No personal income docs; deal must DSCR.
Hard money
10% down · 12.0% · 12mo
- Down + closing
- —
- Monthly P&I
- —
- Monthly cashflow
- —
- DSCR
- —
- Eligible?
- —
Short-term bridge; refi at stabilization.
Rent comps 19 comps
| Address | Beds | Baths | Sqft | Rent | $/sqft | DOM | Units | Dist |
|---|---|---|---|---|---|---|---|---|
| 2630 Waco St San Angelo, TX | 3.0 | 2.0 | 1024 | $1,600 | $1.56 | 22d | 1 | 0.32mi |
| 1405 Hassell St San Angelo, TX | 3.0 | 2.0 | 1064 | $1,950 | $1.83 | 44d | 1 | 0.34mi |
| 705 Childress St San Angelo, TX | 2.0 | 1.0 | 872 | $1,400 | $1.61 | 44d | 1 | 0.35mi |
| 2102 Raney St San Angelo, TX | 3.0 | 1.0 | 1040 | $1,295 | $1.25 | 22d | 1 | 0.59mi |
| 1929 Raney St San Angelo, TX | 1.0–2.0 | 1.0–2.0 | 765 | $1,000 | $1.31 | 22d | 4 | 0.61mi |
| 1717 Greenwood St San Angelo, TX | 1.0 | 1.0 | 754 | $625 | $0.83 | 22d | 1 | 0.98mi |
| 121 N Van Buren St Unit A San Angelo, TX | 2.0 | 1.0 | 715 | $1,095 | $1.53 | 22d | 1 | 1.01mi |
| 212 S Fillmore St Unit B San Angelo, TX | 2.0 | 1.0 | 800 | $999 | $1.25 | 44d | 1 | 1.10mi |
| 3755 Arden Rd San Angelo, TX | 2.0–3.0 | 1.0 | 875 | $925 | $1.06 | 22d | 1 | 1.11mi |
| 3801 Arden Rd Apt 108 San Angelo, TX | 2.0 | 2.0 | 1025 | $1,215 | $1.19 | 44d | 1 | 1.20mi |
| 3801 Arden Rd Apt 93 San Angelo, TX | 1.0 | 1.0 | 670 | $971 | $1.45 | 44d | 1 | 1.20mi |
| 3801 Arden Rd Unit 131 San Angelo, TX | 1.0 | 1.0 | 670 | $933 | $1.39 | 44d | 1 | 1.20mi |
| 3801 Arden Rd Apt 65 San Angelo, TX | 2.0 | 2.0 | 1025 | $1,199 | $1.17 | 22d | 1 | 1.20mi |
| 3130 W Beauregard Ave San Angelo, TX | 1.0–2.0 | 1.0 | 690 | $875 | $1.27 | 22d | 1 | 1.21mi |
| 2065 Live Oak St San Angelo, TX | 2.0 | 1.0 | 720 | $950 | $1.32 | 44d | 1 | 1.28mi |
| 902 Shiloh St Unit RE-908-16 San Angelo, TX | 2.0 | 1.0 | 875 | $1,125 | $1.29 | 44d | 1 | 1.36mi |
| 902 Shiloh St Unit RE-908-C San Angelo, TX | 2.0 | 1.5 | 925 | $1,175 | $1.27 | 44d | 1 | 1.36mi |
| 902 Shiloh St Unit RE-908-20 San Angelo, TX | 1.0 | 1.0 | 800 | $1,025 | $1.28 | 44d | 1 | 1.36mi |
| 810 W 19th St San Angelo, TX | 3.0 | 2.0 | 1090 | $1,249 | $1.15 | 22d | 1 | 1.42mi |
Listing history 22 events
-
2026-06-19days on market $135,000 Active 51 DOM
-
2026-06-18days on market $135,000 Active 50 DOM
-
2026-06-17days on market $135,000 Active 49 DOM
-
2026-06-16days on market $135,000 Active 48 DOM
-
2026-06-15days on market $135,000 Active 47 DOM
-
2026-06-14days on market $135,000 Active 45 DOM
-
2026-06-13days on market $135,000 Active 44 DOM
-
2026-06-10days on market $135,000 Active 42 DOM
-
2026-06-09days on market $135,000 Active 41 DOM
-
2026-06-08days on market $135,000 Active 40 DOM
-
2026-06-07days on market $135,000 Active 39 DOM
-
2026-06-02days on market $135,000 Active 34 DOM
-
2026-06-01days on market $135,000 Active 33 DOM
-
2026-05-31pricedays on market $135,000 Active 32 DOM
-
2026-05-30days on market $145,000 Active 31 DOM
-
2026-04-29$145,000 Active 370-char remark
-
2023-07-20$119,000 Active
-
2023-07-15$129,000 Active
-
2014-11-21soldstatus
-
2014-11-20soldstatus
-
2014-08-09$71,500
-
2005-05-23soldstatus
ⓘ Source: listings_history table (triggers on properties + properties_extension) + one-shot
backfill from property_details.listing_events for pre-trigger history.
Tax reassessment forecast TX · Resets to sale price
- Current annual tax
- $2,789 · $232/mo
- Projected year-2 tax
- $2,789 · $232/mo
- Expected delta
- $0/yr ($0/mo · 0.0%)
ⓘ Screening estimate from a state-policy table — verify with the county assessor before closing.
Climate risk First Street
- Flood 1/10 Low FEMA zone X (unshaded) · 0% chance over 30 yrs
- Wildfire 7/10 Severe
- Heat 7/10 Severe 7 d/yr ≥104°F today · 23 d/yr by 30 yrs out
- Wind 4/10 Moderate 14% chance of damaging wind over 30 yrs
- Air quality 1/10 Low 0 unhealthy d/yr today · 0 by 30 yrs out
Nearby sold comps map
Loading sold comps map…
Walkable amenities ~0.75 mi
Loading nearby amenities…
Taxation est. · year 1
- Rental income
- $15,787
- − Mortgage interest
- −$7,562
- − Property taxes
- −$2,789
- − Insurance
- −$675
- − Repairs & maintenance
- −$1,263
- − Management
- −$1,263
- − Depreciation
- −$3,927
- Taxable loss
- −$1,692
- Est. tax savings @ 24.0%
- +$406
- After-tax cash flow
- $919/yr
For passive investors: Depreciation is non-cash, so a rental often shows a tax loss while cash-flowing — sheltering income. Rental losses are passive: they offset passive income freely, and up to $25,000/yr can offset ordinary (W-2) income if you actively participate and your MAGI is under $100k (phasing out to $0 by $150k); unused losses carry forward. On sale, claimed depreciation is recaptured at up to 25%, and gains may owe capital-gains tax (a 1031 exchange can defer both). Figures are a year-1 estimate at your 24.0% rate — not tax advice; consult a CPA.
Schools (NCES district)
- District
- San Angelo ISD
- NCES district ID
- 4838700
- Math proficiency
- 27% ▼ -9.00%
- Reading proficiency
- 33% ▼ -3.00%
- Median HH income
- $43,501
- Composite
- 25.56/100
- National rank
- #7427
- State rank
- #627 of 826 in TX
Livability — San Angelo
- Score
- 73/100
- State rank
- #199
- US rank
- #5030
Category grades
Schools grade is shown separately in the Schools card above.
Census & demographics
- Census place
- San Angelo, TX
- County
- Tom Green County · 113,188 people
- City population
- 81,357
- Metro
- San Angelo, TX
- Population (ZIP)
- 31,831
- Household income
- $69,450
- Rent vs Own
- Severe rent burden
- 1034.0
Population outlook (Tom Green County) Hauer SSP2
- Today (2025)
- 135,110 people
- By 2030
- 144,090 · +6.6%
- By 2040
- 162,561 · +20.3%
- By 2050
- 182,158 · +34.8%
- By 2075
- 232,274 · +71.9%
- By 2100
- 268,218 · +98.5%
Race, ethnicity, and origin ACS 2023
- Neighborhood character
- Majority White (55%)
- Race & ethnicity
- White 55% Hispanic / Latino 41% Two or more races 17% Black 2%
- Hispanic origin (detail)
- Mexican 38%
- Common ancestry
- Lithuanian 3% Slovak 3% Iranian 1%
- Foreign-born
- 5% · Canada
- Languages at home
- 77% English-only · Spanish 21% German/W. Germanic 1%
Political lean MEDSL · Tom Green
- 2024 margin
- Solid R (+48.0) · D 25.5% · R 73.5% · Other 1.0%
- 2008→2024 swing
- -6.3pp toward R · 2008: -41.7pp · 2024: -48.0pp
- All cycles
- 2024: R+48.0 2020: R+44.4 2016: R+47.9 2012: R+47.9 2008: R+41.7
Not yet ingested
- Civics
- —
Market trends
- HPI YoY
- ▲ 47.96%
- Current HPI
- 798.58
- Rent YoY
- ▲ 5.78%
- Metro
- San Angelo, TX
- State GDP YoY
- ▲ 3.95%
- F500 in state
- 110
Industry mix (Fortune 500 HQ in TX)
| Industry | F500 HQs | Revenue |
|---|---|---|
| Energy | 16 | $1,198B |
|
||
| Technology | 5 | $198B |
|
||
| Engineering / Construction | 4 | $72B |
|
||
| Energy Services | 3 | $60B |
|
||
| Utilities | 3 | $41B |
|
||
| Healthcare | 2 | $330B |
|
||
Price history
+88.8% since first listed8 events — show timeline
- 2026-05-30 Price Changed $135,000 SAAR TX
- 2026-04-29 Listed $145,000 SAAR TX
- 2023-07-20 Listed $119,000 SAAR TX
- 2023-07-15 Listed $129,000 SAAR TX
- 2014-11-21 Sold (Public Records) — Public Records
- 2014-11-20 Sold (MLS) — SAAR TX
- 2014-08-09 Listed $71,500 SAAR TX
- 2005-05-23 Sold (Public Records) — Public Records
Property tax history
+4.7%/yrLatest (2025): $2,789 · +15.9% YoY. Source: county tax records.
Cash-flow waterfall
monthlySold comps — $/sqft
last 12 mo · ≤1 miLoading sold comps…