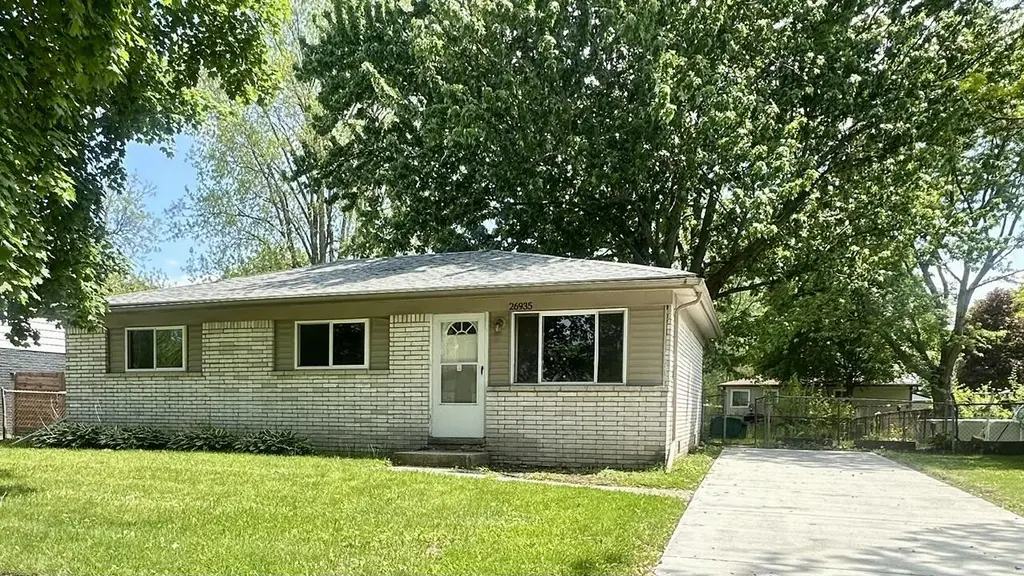
26935 California St · Taylor, MI
Flood risk 1/10 · Minimal
- FEMA flood zone
- X (unshaded)
- Chance of flooding over 30 yrs
- 0.0%
- Est. flood insurance / yr
- $507 – $1,088
Fire risk 2/10 · Minimal
- Est. fire insurance / yr
- $784 – $1,456
Heat risk 3/10 · Minor
- Hot days now (above 97°F)
- 7 days/yr
- Hot days in 30 yrs
- 15 days/yr
Wind risk 2/10 · Minimal
- Chance of severe wind over 30 yrs
- —
Air-quality risk 2/10 · Minimal
- Unhealthy air days now
- 1 days/yr
- Unhealthy air days in 30 yrs
- 3 days/yr
Risk factors via First Street. Map © Google.
Why this score? — see what drove the C grade
The composite is a weighted blend of 9 inputs, each scored 0–100. Each bar is that input's sub-score; the figure is the points it added to the 100-point composite (weight × sub-score).
- Cash flow +20.8/30.0
- ARV discount +10.7/15.0
- DSCR +6.6/10.0
- 1% rule +5.8/10.0
- Livability +3.8/5.0
- Rent growth +3.7/5.0
- Condition / age +2.5/5.0
- Schools +1.8/10.0
- Appreciation +0.0/10.0
$150,000
🖨 Deal sheet (PDF) 📄 Offer letter ✓ Due diligence
Listing remarks MLS
Great opportunity to own this charming brick ranch home located in heart of Taylor. Featuring three bedrooms, 1 bath, First floor laundry, Central air, Large fenced in yard. Seller providing C of O at close! Email all offers to [email protected]
Key facts
- First floor laundry
- Brick ranch home
- Central air
Tags
Property features AI
Exterior
- Utilities: Public water supply
- Home design: Ranch-style single family residence; Single-story
- Construction: Built in 1971; Brick construction
- Exterior features: Lot around 0.16 acres; Public water
Interior
- Kitchen: Two kitchens listed (one 11 x 9 and one listed as Kitchen without dimensions)
- Bedrooms: Primary bedroom approximately 11 x 10; Bedroom 2 approximately 10 x 10; Bedroom 3 approximately 10 x 10
- Bathrooms: One full bathroom; Primary bathroom
- Heating & cooling: Forced air heating; Has central cooling
- Interior features: Five total rooms; Crawl space and slab foundation/basement configuration
Neighborhood map
What this means for you Summary
Snapshot
- This is a 3-bed/1.0-bath single-family listed at $150k.
Deal economics
- At list price, monthly cash flow is $205 ($2k/yr) — positive.
- The deal already cash-flows at list — no discount required.
- Meets the 1% rule at list price ($2k rent vs $150k).
- Cap rate 7.9% vs local median 5.4% in Taylor — top-decile yield for the area; either an underpriced asset or a hidden risk that comps aren't pricing in. Stress-test before assuming the spread holds.
Location & tenants
- Location reads 76/100 on livability (#144 in MI, #3,684 nationally) — a middle-class / working-renter tenant base. Strengths: commute A+, cost of living A+, housing A+; Watch: employment D+, crime F.
- Taylor School District (urban): math 14% / reading 27% proficiency, ranked #462 of 540 in MI (top 86%) — low school quality limits family demand, transient renter base, plan for 1-2y turnover; 68% free/reduced lunch — lower-income household profile, screen leases tightly.
- Zoned schools: Myers Elementary School (math 10% / reading 10%, grade F, #1,230 of 1,397 statewide, top 91%, 297 students, 96% FRL); Hoover Middle School (math 12% / reading 27%, grade F, #425 of 493 statewide, top 87%, 490 students, 81% FRL); Taylor High School (math 37% / reading 52%, grade F, #214 of 713 statewide, top 36%, 1,394 students, 66% FRL).
- Market conditions: Rents rising fast (+4.9%/yr); 289 active listings in the ZIP; 2,639 units permitted in Wayne County in 2024 (1,216 in 5+ unit buildings).
- This rent runs 32% of the median local income ($61k/yr) — at the standard rent-burdened threshold; future hikes will face affordability resistance.
Forward outlook
- Local home prices are declining (-3.0%/yr); year-one equity from $1k of loan paydown is wiped out by about $4k of value loss. Plan a longer hold.
- Wayne County population projected at -17% by 2050 — secular population decline; favor cash flow + early exit over multi-decade hold.
Negotiation context
- Only 14 days on market — expect competitive offers; lowballing is unlikely to land.
- 22 sale attempts since 27y ago with the ask held roughly flat each time — persistent listings suggest the price (not the market) is what's stuck; bring a comps-based counter.
Questions for the listing agent
- Built in 1971 — when were the roof, HVAC, electrical panel, plumbing, and water heater last replaced?
- Is there a deadline driving the sale (1031 exchange, divorce, estate, relocation)? That informs how much negotiation room exists.
- Schools are F-rated, which usually means shorter tenancies and higher turnover. Who's the typical renter profile here, and what's been the actual vacancy rate?
- Crime grade is F in this area — have there been break-ins, vandalism, or insurance claims at this property in the last 3 years? What carrier currently insures it and at what premium?
- What's the average days-on-market for RENTAL listings here right now (not sales)? A rising rental-DOM trend means longer vacancies and softer asking-rent achievability than the comps imply.
- What's the recent tenant-quality profile in this submarket — average credit score on applications, eviction rate, late-payment / NSF rate, and stable-employment percentage? A property-management company in the area should have these aggregated.
- How much new for-sale + rental construction is in the pipeline within 1–3 miles? Heavy new supply typically softens prices + rents 12–24 months out; constrained supply supports both.
Investment metrics
- 1% rule
- 1.08% ✓
- Cap rate
- 7.93%
- Cash-on-cash
- 5.85%
- DSCR
- 1.26
- GRM
- 7.7
CMA / ARV
- ARV (on-the-fly)
- $161,304
- Comps found
- 12
Show comp detail 12 sales within ~0.75 mi
| Address | Dist | Beds/Ba | Sqft | Sold | Price | $/sf | Match |
|---|---|---|---|---|---|---|---|
| 16226 Karin St | 0.15mi | 3/1.0 | 1,034 (0%) | 2mo | $165,000 | $160 | 92 |
| 26914 California St | 0.03mi | 3/1.0 | 1,034 (0%) | 11mo | $159,000 | $154 | 89 |
| 15910 Hampden St | 0.24mi | 3/1.5 | 1,017 (-2%) | 6mo | $125,000 | $123 | 79 |
| 15815 Wellington St | 0.30mi | 3/1.0 | 1,054 (+2%) | 8mo | $164,900 | $156 | 76 |
| 15746 Meadow St | 0.66mi | 3/1.0 | 1,050 (+2%) | 1mo | $175,000 | $167 | 66 |
| 15684 Mcguire St | 0.58mi | 3/1.0 | 995 (-4%) | 1mo | $145,000 | $146 | 66 |
| 15789 Meadow St | 0.63mi | 3/1.0 | 1,008 (-2%) | 10mo | $186,000 | $185 | 58 |
| 15390 Beech Daly Rd | 0.73mi | 3/1.0 | 1,071 (+4%) | 5mo | $160,500 | $150 | 56 |
| 15812 Orchard St | 0.72mi | 3/1.0 | 1,008 (-2%) | 9mo | $176,000 | $175 | 54 |
| 26625 Eureka Rd | 0.63mi | 3/1.0 | 987 (-4%) | 10mo | $105,000 | $106 | 54 |
| 15605 Mcguire St | 0.64mi | 3/1.0 | 976 (-6%) | 11mo | $159,500 | $163 | 52 |
| 15720 Beech Daly Rd | 0.65mi | 3/1.0 | 967 (-6%) | 11mo | $150,052 | $155 | 50 |
Match score weights: distance 35% · size 25% · config 20% · recency 20%. Top-matched comps best support the ARV.
Projected returns pro-forma
-3.0% appreciation · 4.9% rent growth · sell at horizon
- IRR
- -5.0%
- Equity multiple
- 0.81×
- Total profit
- $-8,037
- Equity at exit
- $22,365
- IRR
- 6.8%
- Equity multiple
- 1.56×
- Total profit
- $23,534
- Equity at exit
- $12,969
Cash invested: $42,000 (down + closing). Projections, not guarantees.
Landlord ↔ Tenant lean methodology
- Overall (STATE)
- 62 Landlord-Friendly
- State Michigan
- 62 Landlord-Friendly · EVEN
- County
- — inherits STATE
- City
- — inherits STATE
ZIP-level market 48180
- Rents YoY
- 4.9%
- Active inventory
- 289
- Price-to-rent
- 7.7×
Monthly cashflow live
- Estimated rent
- $1,627 medium interval (Pro) →
- Mortgage (P&I)
- −$787
- Tax from tax record
- −$231 /mo · $2,778/yr
- Insurance
- −$62
- HOA
- −$0
- Vacancy / Maint / Mgmt
- −$342
- Net cashflow
- $205
Break-even live
Sensitivity live
| Price | -10% $290 | -5% $247 | +0% $205 | +5% $162 | +10% $120 |
|---|---|---|---|---|---|
| Rent | -10% $76 | -5% $141 | +0% $205 | +5% $269 | +10% $333 |
| Rate | -1.0pp $280 | -0.5pp $243 | base $205 | +0.5pp $166 | +1.0pp $126 |
UW: 25.0% down · 7.5% · 30yr · 1.5% tax · 5.0% vac · 8.0% maint · 8.0% mgmt
Financing live
Cash to close
- Down payment
- $37,500
- Closing costs
- $4,500
- Reserves months
- —
- Total cash needed
- —
Loan-product check · same deal, 3 products live
Conventional
25% down · 7.5% · 30yr
- Down + closing
- —
- Monthly P&I
- —
- Monthly cashflow
- —
- DSCR
- —
- Eligible?
- —
Personal DTI + credit; lowest rate.
DSCR
20% down · 8.5% · 30yr
- Down + closing
- —
- Monthly P&I
- —
- Monthly cashflow
- —
- DSCR
- —
- Eligible?
- —
No personal income docs; deal must DSCR.
Hard money
10% down · 12.0% · 12mo
- Down + closing
- —
- Monthly P&I
- —
- Monthly cashflow
- —
- DSCR
- —
- Eligible?
- —
Short-term bridge; refi at stabilization.
Listing history 50 events
-
2026-06-07status $150,000 Pending 14 DOM
-
2026-06-04days on market $150,000 Active 14 DOM
-
2026-06-03days on market $150,000 Active 13 DOM
-
2026-06-02days on market $150,000 Active 12 DOM
-
2026-06-01days on market $150,000 Active 11 DOM
-
2026-05-31days on market $150,000 Active 10 DOM
-
2026-05-21$150,000 Active 246-char remark
Show marketing remark (246 chars)
Great opportunity to own this charming brick ranch home located in heart of Taylor. Featuring three bedrooms, 1 bath, First floor laundry, Central air, Large fenced in yard. Seller providing C of O at close! Email all offers to [email protected]
-
2026-05-21$150,000 Active
Show marketing remark (246 chars)
Great opportunity to own this charming brick ranch home located in heart of Taylor. Featuring three bedrooms, 1 bath, First floor laundry, Central air, Large fenced in yard. Seller providing C of O at close! Email all offers to [email protected]
-
2026-05-21$150,000 Active 246-char remark
Show marketing remark (246 chars)
Great opportunity to own this charming brick ranch home located in heart of Taylor. Featuring three bedrooms, 1 bath, First floor laundry, Central air, Large fenced in yard. Seller providing C of O at close! Email all offers to [email protected]
-
2026-03-06status Pending
-
2026-03-06status Pending
-
2026-03-03historical
-
2026-02-24$150,000 Active
-
2026-02-24$150,000 Active
-
2021-10-07soldstatus $1,483,000
-
2021-06-08soldstatus $95,000
-
2018-12-05soldstatus $93,000
-
2018-05-21soldstatus $56,000
-
2018-05-04soldstatus $56,000 Sold
-
2018-05-04soldstatus $56,000 Closed
-
2018-04-05status Pending
-
2018-04-05status Pending
-
2018-04-02$64,900 Active
-
2018-04-02$64,900 Active
-
2010-03-30soldstatus $18,151
-
2010-02-12$20,000
-
2009-12-04historical
-
2009-05-09$39,900
-
2009-05-09historical
-
2009-04-23$49,900
-
2009-04-23historical
-
2009-04-16$59,900
-
2009-04-16historical
-
2009-02-27$69,999
-
2009-02-27historical
-
2009-01-30$69,999
-
2009-01-30historical
-
2008-08-24$84,000
-
2008-02-26historical
-
2007-09-09$94,900
-
2007-09-09historical
-
2007-08-17$94,900
-
2007-08-17historical
-
2007-07-29$94,900
-
2007-07-29historical
-
2007-04-17$94,900
-
2007-04-17historical
-
2006-12-11$99,900
-
2006-12-11historical
-
2006-08-15$99,900
ⓘ Source: listings_history table (triggers on properties + properties_extension) + one-shot
backfill from property_details.listing_events for pre-trigger history.
Tax reassessment forecast MI · Partial reset (capped growth)
- Current annual tax
- $2,778 · $231/mo
- Projected year-2 tax
- $2,778 · $231/mo
- Expected delta
- $0/yr ($0/mo · 0.0%)
ⓘ Screening estimate from a state-policy table — verify with the county assessor before closing.
Climate risk First Street
- Flood 1/10 Low FEMA zone X (unshaded) · 0% chance over 30 yrs
- Wildfire 2/10 Low
- Heat 3/10 Moderate 7 d/yr ≥97°F today · 15 d/yr by 30 yrs out
- Wind 2/10 Low
- Air quality 2/10 Low 1 unhealthy d/yr today · 3 by 30 yrs out
Nearby sold comps map
Loading sold comps map…
Walkable amenities ~0.75 mi
Loading nearby amenities…
Taxation est. · year 1
- Rental income
- $19,526
- − Mortgage interest
- −$8,402
- − Property taxes
- −$2,778
- − Insurance
- −$750
- − Repairs & maintenance
- −$1,562
- − Management
- −$1,562
- − Depreciation
- −$4,364
- Taxable income
- $108
- Est. tax owed @ 24.0%
- −$26
- After-tax cash flow
- $2,433/yr
For passive investors: Depreciation is non-cash, so a rental often shows a tax loss while cash-flowing — sheltering income. Rental losses are passive: they offset passive income freely, and up to $25,000/yr can offset ordinary (W-2) income if you actively participate and your MAGI is under $100k (phasing out to $0 by $150k); unused losses carry forward. On sale, claimed depreciation is recaptured at up to 25%, and gains may owe capital-gains tax (a 1031 exchange can defer both). Figures are a year-1 estimate at your 24.0% rate — not tax advice; consult a CPA.
Schools (NCES district)
- District
- Taylor School District
- NCES district ID
- 2633540
- Math proficiency
- 14% ▼ -7.00%
- Reading proficiency
- 27% ▼ -4.00%
- Median HH income
- $43,062
- Composite
- 17.62/100
- National rank
- #9034
- State rank
- #462 of 540 in MI
Livability — Taylor
- Score
- 76/100
- State rank
- #144
- US rank
- #3684
Category grades
Schools grade is shown separately in the Schools card above.
Census & demographics
- Census place
- Taylor, MI
- County
- Wayne County · 1,562,939 people
- City population
- 62,081
- Metro
- Detroit-Warren-Dearborn, MI
- Population (ZIP)
- 62,081
- Household income
- $61,081
- Rent vs Own
- Severe rent burden
- 1957.0
Population outlook (Wayne County) Hauer SSP2
- Today (2025)
- 1,675,273 people
- By 2030
- 1,620,300 · -3.3%
- By 2040
- 1,502,341 · -10.3%
- By 2050
- 1,384,039 · -17.4%
- By 2075
- 1,124,592 · -32.9%
- By 2100
- 881,193 · -47.4%
Race, ethnicity, and origin ACS 2023
- Neighborhood character
- Majority White (65%)
- Race & ethnicity
- White 65% Black 19% Two or more races 9% Hispanic / Latino 9% Asian 2%
- Hispanic origin (detail)
- Mexican 6% Puerto Rican 2%
- Common ancestry
- Romanian 8% Lithuanian 3% Slovak 2%
- Foreign-born
- 7% · Canada
- Languages at home
- 89% English-only · Spanish 4% Arabic 3% Other Indo-European 3%
Political lean MEDSL · Wayne
- 2024 margin
- Strong D (+29.0) · D 62.7% · R 33.7% · Other 3.6%
- 2008→2024 swing
- -20.5pp toward R · 2008: 49.5pp · 2024: 29.0pp
- All cycles
- 2024: D+29.0 2020: D+38.1 2016: D+37.3 2012: D+46.9 2008: D+49.5
Not yet ingested
- Civics
- —
Market trends
- HPI YoY
- ▼ -212.33%
- Current HPI
- 228.921
- Rent YoY
- ▲ 4.90%
- Metro
- Detroit-Warren-Dearborn, MI
- State GDP YoY
- ▲ 1.37%
- F500 in state
- 28
Industry mix (Fortune 500 HQ in MI)
| Industry | F500 HQs | Revenue |
|---|---|---|
| Automotive Parts | 3 | $48B |
|
||
| Automotive | 2 | $372B |
|
||
| Chemicals | 1 | $45B |
|
||
| Automotive Retail | 1 | $29B |
|
||
| Healthcare / Medical Devices | 1 | $23B |
|
||
| Automotive Technology | 1 | $20B |
|
||
Price history
+354.5% since first listed50 events — show timeline
- 2026-05-21 Listed $150,000 REALCOMP
- 2026-05-21 Listed $150,000 SW Michigan MLS
- 2026-05-21 Listed $150,000 MiRealSource-MiMLS
- 2026-03-06 Pending — MiRealSource-MiMLS
- 2026-03-06 Pending — REALCOMP
- 2026-03-03 Listing Removed — MiRealSource-MiMLS
- 2026-02-24 Listed $150,000 REALCOMP
- 2026-02-24 Listed $150,000 MiRealSource-MiMLS
- 2021-10-07 Sold (Public Records) $1,483,000 Public Records
- 2021-06-08 Sold (Public Records) $95,000 Public Records
- 2018-12-05 Sold (Public Records) $93,000 Public Records
- 2018-05-21 Sold (Public Records) $56,000 Public Records
- 2018-05-04 Sold (MLS) $56,000 MiRealSource-MiMLS
- 2018-05-04 Sold (MLS) $56,000 REALCOMP
- 2018-04-05 Pending — MiRealSource-MiMLS
- 2018-04-05 Pending — REALCOMP
- 2018-04-02 Listed $64,900 MiRealSource-MiMLS
- 2018-04-02 Listed $64,900 REALCOMP
- 2010-03-30 Sold (MLS) $18,151 REALCOMP
- 2010-02-12 Listed $20,000 REALCOMP
- 2009-12-04 Listing Removed — REALCOMP
- 2009-05-09 Listing Removed — REALCOMP
- 2009-05-09 Listed $39,900 REALCOMP
- 2009-04-23 Listing Removed — REALCOMP
- 2009-04-23 Listed $49,900 REALCOMP
- 2009-04-16 Listing Removed — REALCOMP
- 2009-04-16 Listed $59,900 REALCOMP
- 2009-02-27 Listing Removed — REALCOMP
- 2009-02-27 Listed $69,999 REALCOMP
- 2009-01-30 Listing Removed — REALCOMP
- 2009-01-30 Listed $69,999 REALCOMP
- 2008-08-24 Listed $84,000 REALCOMP
- 2008-02-26 Listing Removed — REALCOMP
- 2007-09-09 Listing Removed — REALCOMP
- 2007-09-09 Listed $94,900 REALCOMP
- 2007-08-17 Listing Removed — REALCOMP
- 2007-08-17 Listed $94,900 REALCOMP
- 2007-07-29 Listing Removed — REALCOMP
- 2007-07-29 Listed $94,900 REALCOMP
- 2007-04-17 Listing Removed — REALCOMP
- 2007-04-17 Listed $94,900 REALCOMP
- 2006-12-11 Listing Removed — REALCOMP
- 2006-12-11 Listed $99,900 REALCOMP
- 2006-08-15 Listing Removed — REALCOMP
- 2006-08-15 Listed $99,900 REALCOMP
- 2006-07-05 Listed $103,900 REALCOMP
- 2003-03-05 Sold (Public Records) $88,500 Public Records
- 2000-03-24 Listing Removed — REALCOMP
- 1999-10-12 Listed $69,900 REALCOMP
- 1996-08-05 Sold (Public Records) $33,000 Public Records
Property tax history
+2.5%/yrLatest (2025): $2,778 · -10.2% YoY. Source: county tax records.
Cash-flow waterfall
monthlySold comps — $/sqft
last 12 mo · ≤1 miLoading sold comps…