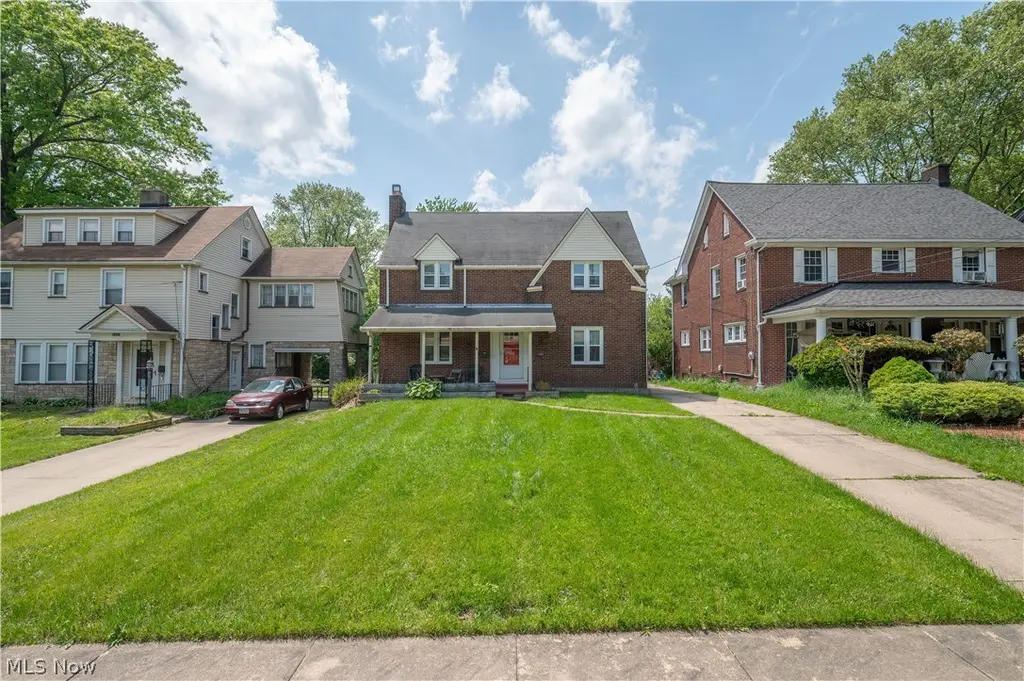
1842 Coronado Ave · Youngstown, OH
Flood risk 1/10 · Minimal
- FEMA flood zone
- X (unshaded)
- Chance of flooding over 30 yrs
- 0.0%
- Est. flood insurance / yr
- $473 – $860
Fire risk 1/10 · Minimal
- Est. fire insurance / yr
- $713 – $1,323
Heat risk 3/10 · Minor
- Hot days now (above 97°F)
- 7 days/yr
- Hot days in 30 yrs
- 15 days/yr
Wind risk 1/10 · Minimal
- Chance of severe wind over 30 yrs
- —
Air-quality risk 2/10 · Minimal
- Unhealthy air days now
- 1 days/yr
- Unhealthy air days in 30 yrs
- 2 days/yr
Risk factors via First Street. Map © Google.
Why this score? — see what drove the D grade
The composite is a weighted blend of 9 inputs, each scored 0–100. Each bar is that input's sub-score; the figure is the points it added to the 100-point composite (weight × sub-score).
- ARV discount +12.7/15.0
- Cash flow +9.0/30.0
- Appreciation +8.4/10.0
- Livability +4.0/5.0
- DSCR +2.5/10.0
- Rent growth +2.5/5.0
- Condition / age +2.5/5.0
- 1% rule +2.4/10.0
- Schools +0.9/10.0
$139,900
🖨 Deal sheet 📄 Offer letter ✓ Due diligence
Listing remarks MLS
Immaculate home! Brick 2 story, 4 bedroom home featuring marble fireplace in living room, new Lennox Elite furnace and central air in 2004, hot water tank 2 years old, and glass block windows in full basement. Cedar closet in bedroom and 1.5 baths. Hardwood floors throughout home with most rooms carpeted. You must see this quality built home. Home is eligible for down payment assistance through YNDC's Healthy Homeownership Program. Call for details.
Key facts
- Formal dining room
- Cozy fireplace
- 7,492 sq ft lot
Tags
Property features AI
Exterior
- Parking: Concrete parking surface
- Utilities: Public water; Public sewer
- Home design: Two-story home; Brick construction; Asphalt roof
- Construction: Built as recorded in public records; Brick construction; Asphalt roof; Full basement
- Exterior features: Shed(s)
Interior
- Bedrooms: Three bedrooms (all on second level)
- Flooring: Carpet in one bedroom; Wood flooring in two bedrooms
- Bathrooms: One full bathroom; One half bathroom; One main-level bathroom
- Heating & cooling: Central air conditioning; Forced air heating (gas)
- Interior features: Full basement; Updated/remodeled condition; One fireplace
Neighborhood map
What this means for you Summary
Snapshot
- This is a 3-bed/1.5-bath single-family listed at $140k.
Deal economics
- At list price, monthly cash flow is $-110 ($-1k/yr) — negative.
- To cash-flow at today's rent, offer at most $120k (13.9% below list).
- To meet the 1% rule (rent ≥ 1% of price), the offer needs to be $103k (26.3% below list).
- Recommended offer: $103k (26.3% below list) — sets the bar for 1% rule.
- Cap rate 5.3% vs local median 7.0% in Youngstown — below-typical yield; the buyer is paying a premium for something (appreciation thesis, condition, location) that the cap rate doesn't capture.
Location & tenants
- Location reads 81/100 on livability (#99 in OH, #1,506 nationally) — a professional / high-income tenant draw. Strengths: amenities A+, commute A+, cost of living A+; Watch: crime F, employment F.
- Youngstown City (urban): math 8% / reading 17% proficiency, ranked #649 of 656 in OH (top 99%) — low school quality limits family demand, transient renter base, plan for 1-2y turnover; 88% free/reduced lunch — lower-income household profile, screen leases tightly.
- Market conditions: 28 active listings in the ZIP; 4 comparable units currently listed for rent nearby; rentals lingering (median 44d on market — plan ~5-8 weeks vacancy on turnover, expect pricing pressure); 50% of comp listings sitting > 30 days — soft ceiling on asking rent; lower-income renter base — watch delinquency; 147 units permitted in Mahoning County in 2024 (0 in 5+ unit buildings).
- This rent runs 31% of the median local income ($40k/yr) — at the standard rent-burdened threshold; future hikes will face affordability resistance.
Forward outlook
- In year one you build about $10k of equity ($967 loan paydown + $9k appreciation (6.7% local appreciation)).
- Mahoning County population projected at -14% by 2050 — secular population decline; favor cash flow + early exit over multi-decade hold.
- By year 4, paydown + projected appreciation supports a ~$36k cash-out refi (75% LTV) — recoverable capital for the next deal without selling this one.
Negotiation context
- It's been on market 30 days — a 2% lower offer ($138k) is reasonable based on typical stale-listing flexibility.
- 3 sale attempts since 17y ago with the ask held roughly flat each time — persistent listings suggest the price (not the market) is what's stuck; bring a comps-based counter.
- Current owner paid $51k; list at $140k implies a 174% gain — meaningful room to come down on a strong offer.
Risks & watch-outs
- Watch-outs: built in 1947 — expect roof / HVAC / electrical / plumbing capex.
Questions for the listing agent
- What do current leases actually rent for vs. the listed asking? Can we see a recent rent roll and the last 12 months of T-12 income?
- Built in 1947 — when were the roof, HVAC, electrical panel, plumbing, and water heater last replaced?
- Is there a deadline driving the sale (1031 exchange, divorce, estate, relocation)? That informs how much negotiation room exists.
- Crime grade is F in this area — have there been break-ins, vandalism, or insurance claims at this property in the last 3 years? What carrier currently insures it and at what premium?
- The area grade is low — what's the realistic commute time and amenity access for the typical tenant pool here? Any planned neighborhood developments (good or bad) we should know about?
- What's the average days-on-market for RENTAL listings here right now (not sales)? A rising rental-DOM trend means longer vacancies and softer asking-rent achievability than the comps imply.
- What's the recent tenant-quality profile in this submarket — average credit score on applications, eviction rate, late-payment / NSF rate, and stable-employment percentage? A property-management company in the area should have these aggregated.
- How much new for-sale + rental construction is in the pipeline within 1–3 miles? Heavy new supply typically softens prices + rents 12–24 months out; constrained supply supports both.
Investment metrics
- 1% rule
- 0.74% ✗
- Cap rate
- 5.35%
- Cash-on-cash
- -3.37%
- DSCR
- 0.85
- GRM
- 11.3
CMA / ARV
- ARV (on-the-fly)
- $158,080
- Comps found
- 12
Show comp detail 12 sales within ~0.75 mi
| Address | Dist | Beds/Ba | Sqft | Sold | Price | $/sf | Match |
|---|---|---|---|---|---|---|---|
| 435 Catalina Ave | 0.29mi | 4/1.5 (+1) | 2,000 (+1%) | 3mo | $155,000 | $78 | 77 |
| 280 Upland Ave | 0.40mi | 4/1.5 (+1) | 1,960 (-1%) | 3mo | $95,000 | $48 | 72 |
| 495 Madera Ave | 0.27mi | 3/2.0 | 1,868 (-6%) | 10mo | $176,000 | $94 | 68 |
| 156 Halleck St | 0.57mi | 4/1.0 (+1) | 1,936 (-2%) | 2mo | $72,000 | $37 | 62 |
| 244 Outlook Ave | 0.47mi | 4/2.0 (+1) | 2,114 (+7%) | 1mo | $112,500 | $53 | 58 |
| 232 Upland Ave | 0.45mi | 3/1.5 | 1,814 (-8%) | 12mo | $159,900 | $88 | 55 |
| 1960 Guadalupe Ave | 0.30mi | 3/3.5 | 2,052 (+4%) | 23mo | $181,000 | $88 | 52 |
| 487 Carlotta Dr | 0.30mi | 3/2.5 | 1,711 (-13%) | 11mo | $145,000 | $85 | 50 |
| 3001 Dade Ave | 0.69mi | 3/2.5 | 1,977 (+0%) | 22mo | $208,000 | $105 | 45 |
| 211 Outlook Ave | 0.50mi | 3/1.0 | 1,742 (-12%) | 12mo | $138,900 | $80 | 45 |
| 2510 Elm St | 0.56mi | 4/1.5 (+1) | 2,086 (+6%) | 19mo | $112,500 | $54 | 43 |
| 2131 Elm St | 0.51mi | 3/1.0 | 1,696 (-14%) | 15mo | $89,900 | $53 | 38 |
Match score weights: distance 35% · size 25% · config 20% · recency 20%. Top-matched comps best support the ARV.
Projected returns pro-forma
6.72% appreciation · 3.0% rent growth · sell at horizon
- IRR
- 14.4%
- Equity multiple
- 2.01×
- Total profit
- $39,440
- Equity at exit
- $94,409
- IRR
- 14.5%
- Equity multiple
- 4.07×
- Total profit
- $120,151
- Equity at exit
- $177,083
Cash invested: $39,172 (down + closing). Projections, not guarantees.
Landlord ↔ Tenant lean methodology
- Overall (STATE)
- 73 Landlord-Friendly
- State Ohio
- 73 Landlord-Friendly · R+6
- County
- — inherits STATE
- City
- — inherits STATE
ZIP-level market 44504
- Home prices YoY
- 4.0%
- Active inventory
- 28
- Price-to-rent
- 11.3×
Monthly cashflow live
- Estimated rent
- $1,031 medium interval (Pro) →
- Mortgage (P&I)
- −$734
- Tax from tax record
- −$133 /mo · $1,591/yr
- Insurance
- −$58
- HOA
- −$0
- Vacancy / Maint / Mgmt
- −$216
- Net cashflow
- $-110
Break-even live
UW: 25.0% down · 7.5% · 30yr · 1.5% tax · 5.0% vac · 8.0% maint · 8.0% mgmt
Financing live
Cash to close
- Down payment
- $34,975
- Closing costs
- $4,197
- Reserves months
- —
- Total cash needed
- —
Loan-product check · same deal, 3 products live
Conventional
25% down · 7.5% · 30yr
- Down + closing
- —
- Monthly P&I
- —
- Monthly cashflow
- —
- DSCR
- —
- Eligible?
- —
Personal DTI + credit; lowest rate.
DSCR
20% down · 8.5% · 30yr
- Down + closing
- —
- Monthly P&I
- —
- Monthly cashflow
- —
- DSCR
- —
- Eligible?
- —
No personal income docs; deal must DSCR.
Hard money
10% down · 12.0% · 12mo
- Down + closing
- —
- Monthly P&I
- —
- Monthly cashflow
- —
- DSCR
- —
- Eligible?
- —
Short-term bridge; refi at stabilization.
Rent comps 4 comps
| Address | Beds | Baths | Sqft | Rent | $/sqft | DOM | Units | Dist |
|---|---|---|---|---|---|---|---|---|
| 465 Gypsy Ln Youngstown, OH | 2.0 | 1.0–2.0 | 1060 | $920 | $0.87 | 13d | 1 | 0.37mi |
| 465 Gypsy Ln Youngstown, OH | 2.0 | 2.0 | 1320 | $1,120 | $0.85 | 43d | 1 | 0.42mi |
| 176 Upland Ave Unit 1 Youngstown, OH | 4.0 | 2.0 | 1300 | $1,225 | $0.94 | 43d | 1 | 0.64mi |
| 351 Lincoln Ave Youngstown, OH | 3.0–5.0 | 3.0–5.0 | 1527 | $699 | $0.46 | 13d | 10 | 1.39mi |
Listing history 22 events
-
2026-06-19days on market $139,900 Active 30 DOM
-
2026-06-18days on market $139,900 Active 29 DOM
-
2026-06-17days on market $139,900 Active 28 DOM
-
2026-06-16days on market $139,900 Active 27 DOM
-
2026-06-15days on market $139,900 Active 26 DOM
-
2026-06-14days on market $139,900 Active 24 DOM
-
2026-06-13days on market $139,900 Active 23 DOM
-
2026-06-10days on market $139,900 Active 21 DOM
-
2026-06-09days on market $139,900 Active 20 DOM
-
2026-06-08days on market $139,900 Active 19 DOM
-
2026-06-07days on market $139,900 Active 18 DOM
-
2026-06-03days on market $139,900 Active 14 DOM
-
2026-06-02days on market $139,900 Active 13 DOM
-
2026-06-01days on market $139,900 Active 12 DOM
-
2026-05-31days on market $139,900 Active 11 DOM
-
2026-05-30days on market $139,900 Active 10 DOM
-
2026-05-20$139,900 Active
-
2010-12-23soldstatus $51,000
-
2010-12-22soldstatus $51,000 453-char remark
Show marketing remark (453 chars)
Immaculate home! Brick 2 story, 4 bedroom home featuring marble fireplace in living room, new Lennox Elite furnace and central air in 2004, hot water tank 2 years old, and glass block windows in full basement. Cedar closet in bedroom and 1.5 baths. Hardwood floors throughout home with most rooms carpeted. You must see this quality built home. Home is eligible for down payment assistance through YNDC's Healthy Homeownership Program. Call for details.
-
2010-08-31$57,500 453-char remark
Show marketing remark (453 chars)
Immaculate home! Brick 2 story, 4 bedroom home featuring marble fireplace in living room, new Lennox Elite furnace and central air in 2004, hot water tank 2 years old, and glass block windows in full basement. Cedar closet in bedroom and 1.5 baths. Hardwood floors throughout home with most rooms carpeted. You must see this quality built home. Home is eligible for down payment assistance through YNDC's Healthy Homeownership Program. Call for details.
-
2010-06-30historical
-
2009-07-30$65,000
ⓘ Source: listings_history table (triggers on properties + properties_extension) + one-shot
backfill from property_details.listing_events for pre-trigger history.
Tax reassessment forecast OH · Partial reset (capped growth)
- Current annual tax
- $1,591 · $133/mo
- Projected year-2 tax
- $1,887 · $157/mo
- Expected delta
- +$296/yr (+$25/mo · 18.6%)
ⓘ Screening estimate from a state-policy table — verify with the county assessor before closing.
Climate risk First Street
- Flood 1/10 Low FEMA zone X (unshaded) · 0% chance over 30 yrs
- Wildfire 1/10 Low
- Heat 3/10 Moderate 7 d/yr ≥97°F today · 15 d/yr by 30 yrs out
- Wind 1/10 Low
- Air quality 2/10 Low 1 unhealthy d/yr today · 2 by 30 yrs out
Nearby sold comps map
Loading sold comps map…
Walkable amenities ~0.75 mi
Loading nearby amenities…
Taxation est. · year 1
- Rental income
- $12,371
- − Mortgage interest
- −$7,837
- − Property taxes
- −$1,591
- − Insurance
- −$700
- − Repairs & maintenance
- −$990
- − Management
- −$990
- − Depreciation
- −$4,070
- Taxable loss
- −$3,806
- Est. tax savings @ 24.0%
- +$913
- After-tax cash flow
- $-409/yr
For passive investors: Depreciation is non-cash, so a rental often shows a tax loss while cash-flowing — sheltering income. Rental losses are passive: they offset passive income freely, and up to $25,000/yr can offset ordinary (W-2) income if you actively participate and your MAGI is under $100k (phasing out to $0 by $150k); unused losses carry forward. On sale, claimed depreciation is recaptured at up to 25%, and gains may owe capital-gains tax (a 1031 exchange can defer both). Figures are a year-1 estimate at your 24.0% rate — not tax advice; consult a CPA.
Schools (NCES district)
- District
- Youngstown City
- NCES district ID
- 3904516
- Math proficiency
- 8% ▼ -15.00%
- Reading proficiency
- 17% ▼ -10.00%
- Median HH income
- $25,257
- Composite
- 9.29/100
- National rank
- #9858
- State rank
- #649 of 656 in OH
Livability — Youngstown
- Score
- 81/100
- State rank
- #99
- US rank
- #1506
Category grades
Schools grade is shown separately in the Schools card above.
Census & demographics
- Census place
- Youngstown, OH
- County
- Mahoning · 224,175 people
- City population
- 28,503
- Metro
- Youngstown-Warren, OH
- Population (ZIP)
- 5,185
- Household income
- $40,156
- Rent vs Own
- Severe rent burden
- 15.7
Population outlook (Mahoning County) Hauer SSP2
- Today (2025)
- 223,932 people
- By 2030
- 218,387 · -2.5%
- By 2040
- 205,367 · -8.3%
- By 2050
- 193,606 · -13.5%
- By 2075
- 173,694 · -22.4%
- By 2100
- 151,147 · -32.5%
Race, ethnicity, and origin ACS 2023
- Neighborhood character
- Diverse neighborhood (Simpson 0.65)
- Race & ethnicity
- White 45% Black 38% Two or more races 8% Asian 5% Hispanic / Latino 4%
- Common ancestry
- Italian 4% Serbian 1% Romanian 1%
- Foreign-born
- 7% · Canada, Dominican Republic, South Korea
- Languages at home
- 93% English-only · Other Indo-European 4% Spanish 1%
Political lean MEDSL · Mahoning
- 2024 margin
- Lean R (+9.4) · D 44.9% · R 54.4%
- 2008→2024 swing
- -36.1pp toward R · 2008: 26.6pp · 2024: -9.4pp
- All cycles
- 2024: R+9.4 2020: R+1.9 2016: D+3.0 2012: D+27.7 2008: D+26.6
Not yet ingested
- Civics
- —
Market trends
- HPI YoY
- ▲ 6.72%
- Current HPI
- 174.9495
- Rent YoY
- —
- Metro
- —
- State GDP YoY
- ▲ 1.98%
- F500 in state
- 48
Industry mix (Fortune 500 HQ in OH)
| Industry | F500 HQs | Revenue |
|---|---|---|
| Insurance | 3 | $145B |
|
||
| Industrial Machinery | 3 | $49B |
|
||
| Financial Services | 3 | $24B |
|
||
| Consumer Goods | 2 | $93B |
|
||
| Aerospace / Defense | 2 | $47B |
|
||
| Utilities | 2 | $33B |
|
||
Price history
+115.2% since first listed6 events — show timeline
- 2026-05-20 Listed $139,900 MLSNOW
- 2010-12-23 Sold (Public Records) $51,000 Public Records
- 2010-12-22 Sold (MLS) $51,000 MLSNOW
- 2010-08-31 Listed $57,500 MLSNOW
- 2010-06-30 Listing Removed — MLSNOW
- 2009-07-30 Listed $65,000 MLSNOW
Property tax history
+3.1%/yrLatest (2025): $1,591 · -9.6% YoY. Source: county tax records.
Cash-flow waterfall
monthlySold comps — $/sqft
last 12 mo · ≤1 miLoading sold comps…